Publisher’s version / Version de l'éditeur:
Vous avez des questions? Nous pouvons vous aider. Pour communiquer directement avec un auteur, consultez la première page de la revue dans laquelle son article a été publié afin de trouver ses coordonnées. Si vous n’arrivez pas à les repérer, communiquez avec nous à [email protected].
Questions? Contact the NRC Publications Archive team at
[email protected]. If you wish to email the authors directly, please see the first page of the publication for their contact information.
https://publications-cnrc.canada.ca/fra/droits
L’accès à ce site Web et l’utilisation de son contenu sont assujettis aux conditions présentées dans le site LISEZ CES CONDITIONS ATTENTIVEMENT AVANT D’UTILISER CE SITE WEB.
Rough Sets, Fuzzy Sets, Data Mining, and Granular Computing, Lecture Notes in
Computer Science; Volume 3642, pp. 362-371
READ THESE TERMS AND CONDITIONS CAREFULLY BEFORE USING THIS WEBSITE. https://nrc-publications.canada.ca/eng/copyright
NRC Publications Archive Record / Notice des Archives des publications du CNRC :
https://nrc-publications.canada.ca/eng/view/object/?id=ed378d76-e02c-49d9-9c9a-4b18c393e1d6
https://publications-cnrc.canada.ca/fra/voir/objet/?id=ed378d76-e02c-49d9-9c9a-4b18c393e1d6
NRC Publications Archive
Archives des publications du CNRC
For the publisher’s version, please access the DOI link below./ Pour consulter la version de l’éditeur, utilisez le lien DOI ci-dessous.
https://doi.org/10.1007/11548706_38
Access and use of this website and the material on it are subject to the Terms and Conditions set forth at
Relevant attribute discovery in high dimensional data based on rough
sets and unsupervised classification: application to Leukemia gene
expressions
Council Canada Institute for Information Technology de recherches Canada Institut de technologie de l'information
Relevant Attribute Discovery in High Dimensional
Data Based on Rough Sets Applications to
Leukemia Gene Expressions *
Valdes, J., and Barton, A.
September 2005
* published at The Tenth International Conference on Rough Sets, Fuzzy Sets, Data Mining and Granular Computing (RSFDGrC 2005) - Lecture Notes in Computer Sciences / Lecture Notes in Artificial Intelligence. August 31 - September 3, 2005. Regina,
Saskatchewan, Canada. NRC 48122.
Copyright 2005 by
National Research Council of Canada
Permission is granted to quote short excerpts and to reproduce figures and tables from this report, provided that the source of such material is fully acknowledged.
Relevant attribute discovery in high dimensional data
based on rough sets and unsupervised classification:
Application to Leukemia gene expressions.
Julio J. Vald´es1and Alan J. Barton1
National Research Council Canada, M50, 1200 Montreal Rd., Ottawa, ON K1A 0R6 , [email protected],
WWW home page: http://iit-iti.nrc-cnrc.gc.ca
Abstract. A pipelined approach using two clustering algorithms in combination with Rough Sets is investigated for the purpose discovering important combina-tion of attributes in high dimensional data. In many domains, the data objects are described in terms of a large number of features, like in gene expression ex-periments, or in samples characterized by spectral information. The Leader and several k-means algorithms are used as fast procedures for attribute set simpli-fication of the information systems presented to the rough sets algorithms. The data submatrices described in terms of these features are then discretized w.r.t the decision attribute according to different rough set based schemes. From them, the reducts and their derived rules are extracted, which are applied to test data in order to evaluate the resulting classification accuracy. An exploration of this approach (using Leukemia gene expression data) was conducted in a series of ex-periments within a high-throughput distributed-computing environment. They led to subsets of genes with high discrimination power. Good results were obtained with no preprocessing applied to the data.
1
Introduction
As a consequence of the information explosion and the development of sensor and ob-servation technologies, it is now common in many domains to have data objects char-acterized by an increasingly larger number of attributes, leading to high dimensional databases in terms of the set of fields. A typical example is a gene expression experi-ment, where the genetic content of samples of tissues are obtained with high throughput technologies (microchips). Usually, thousands of genes are investigated in such experi-ments. In other bio-medical research contexts, the samples are characterized by infrared, ultraviolet, and other kinds of spectra, where the absorbtion properties, with respect to a large number of wavelengths, are investigated. The same situation occurs in other domains, and the common denominator is to have a set of data objects of a very high dimensional nature.
This paper investigates one, of the possibly many approaches to the problem of finding relevant attributes in high dimensional datasets. The approach is based on a combination of clustering and rough sets techniques in a high throughput distributed
computing environment, with low dimensional virtual reality data representations aid-ing data analysis understandaid-ing. The goals are: i) to investigate the behavior of the combination of these techniques into a knowledge discovery process, and ii) to per-form preliminary comparisons of the experimental results from the point of view of the discovered relevant attributes, applied to the example problem of finding relevant genes.
2
Experimental Methodology
2.1 Clustering methods
Clustering with classical partition methods constructs crisp (non overlapping) subpop-ulations of objects or attributes. Two such classical algorithms were used in this study: the Leader algorithm [10], and several variants of k-means [1].
The leader algorithm operates with a dissimilarity or similarity measure and a preset threshold. A single pass is made through the data objects, assigning each object to the first cluster whose leader (i.e. representative) is close enough to the current object w.r.t. the specified measure and threshold. If no such matching leader is found, then the algorithm will set the current object to be a new leader; forming a new cluster. This technique is fast; however, it has several negative properties. For example, i) the first data object always defines a cluster and therefore, appears as a leader, ii) the partition formed is not invariant under a permutation of the data objects, and iii) the algorithm is biased, as the first clusters tend to be larger than the later ones since they get first chance at ”absorbing” each object as it is allocated. Variants of this algorithm with the purpose of reducing bias include: a) reversing the order of presentation of a data object to the list of currently formed leaders, and b) selecting the absolute best leader found (thus making the object presentation order irrelevant).
The k-means algorithm is actually a family of techniques, where a dissimilarity or similarity measure is supplied, together with an initial partition of the data (e.g. initial partition strategies include: random, the first k objects, k-seed elements, etc). The goal is to alter cluster membership so as to obtain a better partition w.r.t. the measure. Differ-ent variants very often give differDiffer-ent partition results. However, in papers dealing with gene expression analysis, very seldom are the specificities of the k-means algorithm described. For the purposes of this study, the following k-means variants were used: Forgy’s, Jancey’s, convergent, and MacQueen’s [1].
The classical Forgy’s k-means algorithm consists of the following steps: i) begin with any desired initial configuration. Go to ii) if beginning with a set of seed objects, or go to iii) if beginning with a partition of the dataset. ii) allocate each object to the cluster with the nearest (most similar) seed object (centroid). The seed objects remain fixed for a full cycle through the entire dataset. iii) Compute new centroids of the clusters. iv) alternate ii) and iii) until the process converges (that is, until no objects change their cluster membership). In Jancey’s variant, the first set of cluster seed objects is either given or computed as the centroids of clusters in the initial partition. At all succeeding stages each new seed point is found by reflecting the old one through the new centroid for the cluster. MacQueen’s method is composed of the following steps: i) take the first k data units as clusters of one member each. ii) assign each of the remaining objects to
Relevant attribute discovery in high dimensional data 3
the cluster with the nearest (most similar) centroid. After each assignment, recompute the centroid of the gaining cluster. iii) after all objects have been assigned in step ii), take the existing cluster centroids as fixed points and make one more pass through the dataset assigned each object to the nearest (most similar) seed object. A so called convergent k-means is defined by the following steps: i) begin with an initial partition like in Forgy’s and Jancey’s methods (or the output of MacQueen’s method). ii) take each object in sequence and compute the distances (similarities) to all cluster centroids; if the nearest (most similar) is not that of the object’s parent cluster, reassign the object and update the centroids of the losing and gaining clusters. iii) repeat steps ii) and iii) until convergence is achieved (that is, until there is no change in cluster membership).
The leader and the k-means algorithms were used with a similarity measure rather than with a distance. In particular Gower’s general coefficient was used [9], where the similarity between objectsi and j is given by Sij =P
p
k=1sijk/P
p
k=1wijkwhere the
weight of the attribute (wijk) is set equal to0 or 1 depending on whether the comparison
is considered valid for attributek. For quantitative attributes (like the ones of the dataset used in the paper), the scoressijkare assigned assijk = 1 − |Xik− Xjk|/Rk, where
Xikis the value of attributek for object i (similarly for object j), and Rk is the range
of attributek. 2.2 Rough Sets
The Rough Set Theory [12] bears on the assumption that in order to define a set, some knowledge about the elements of the data set is needed. This is in contrast to the classical approach where a set is uniquely defined by its elements. In the Rough Set Theory, some elements may be indiscernible from the point of view of the avail-able information and it turns out that vagueness and uncertainty are strongly related to indiscernibility. Within this theory, knowledge is understood to be the ability of char-acterizing all classes of the classification. More specifically, an information system is a pair A = (U, A) where U is a non-empty finite set called the universe and A is a non-empty finite set of attributes such thata : U → Vafor everya ∈ A . The set Vais
called the value set ofa. For example, a decision table is any information system of the form A = (U, A ∪ {d}), where d ∈ A is the decision attribute and the elements of A are the condition attributes. For anyB ⊆ A an equivalence relation IN D(B) defined as IN D(B) = {(x, x′) ∈ U2|∀a ∈ B, a(x) = a(x′
)}, is associated. In the Rough Set Theory a pair of precise concepts (called lower and upper approximations) replaces each vague concept; the lower approximation of a concept consists of all objects, which surely belong to the concept, whereas the upper approximation of the concept con-sists of all objects, which possibly belong to the concept. A reduct is a minimal set of attributesB ⊆ A such that IN D(B) = IN D(A) (i.e. a minimal attribute subset that preserves the partitioning of the universe). The set of all reducts of an information system A is denoted RED(A). Reduction of knowledge consists of removing super-fluous partitions such that the set of elementary categories in the information system is preserved, in particular, w.r.t. those categories induced by the decision attribute. In particular, minimum reducts (those with a small number of attributes), are extremely important, as decision rules can be constructed from them [2]. However, the problem of reduct computation is NP-hard, and several heuristics have been proposed [18].
2.3 Experimental Methodology
The datasets consist of information systems with an attribute set composed of ratio and interval variables, and a nominal or ordinal decision attribute. More general infor-mation systems have been described in [16]. The general idea is to construct subsets of relatively similar attributes, such that a simplified representation of the data objects is obtained by using the corresponding attribute subset representatives. The attributes of these simplified information systems are explored from the point of view of their reducts. From them, rules are learned and applied systematically to testing data sub-sets not involved in the learning process (Fig-1). The whole procedure can be seen as a pipeline.
Fig. 1.Data processing strategy combining clustering with Rough Sets analysis and crossvalida-tion.
In a first step, the objects in the dataset are shuffled using a randomized approach in order to reduce the possible biases introduced within the learning process by data chunks sharing the same decision attribute. Then, the attributes of the shuffled dataset are clustered using the two families of fast clustering algorithms described in previ-ous sections (the leader, and k-means). Each of the formed clusters of attributes is represented by exactly one of the original data attributes. By the nature of the leader algorithm, the representative is the leader (called an l-leader), whereas for a k-means
Relevant attribute discovery in high dimensional data 5
algorithm, a cluster is represented by the most similar object w.r.t. the centroid of the corresponding cluster (called a k-leader). This operation can be seen as a filtering of the attribute set of the original information system. As a next step, the filtered information system undergoes a segmentation with the purpose of learning classification rules, and testing their generalization ability in a cross-validation framework. N-folds are used as training sets; where the numeric attributes present are converted into nominal at-tributes via a discretization process (many possibilities exist), and from them, reducts are constructed. Finally, classification rules are built from the reducts, and applied to a discretized version of the test fold (according to the cuts obtained previously), from which the generalization ability of the generated rules can be evaluated. Besides the numeric descriptors associated with the application of classification rules to data, use of visual data mining techniques, like the virtual reality representation (section 2.4), enables structural understanding of the data described in terms of the selected subset of attributes and/or the rules learned from them. Each stage feeds its results to the next stage of processing, yielding a pipelined data analysis stream.
2.4 Virtual Reality Representation Of Relational Structures
A virtual reality, visual, data mining technique extending the concept of 3D modelling to relational structures was introduced in http://www.hybridstrategies.com and [15]. It is oriented to the understanding of i) large heterogeneous, incomplete and imprecise data, and ii) symbolic knowledge. The notion of data is not restricted to databases, but includes logical relations and other forms of both structured and non-structured knowl-edge. In this approach, the data objects are considered as tuples from a heterogeneous space [16], given by a Cartesian product of different source sets like: nominal, ordinal, real-valued, fuzzy-valued, image-valued, time-series-valued, graph-valued, etc. A set of relations of different arities may be defined over these objects. The construction of a VR-space requires the specification of several sets and a collection of extra mappings, which may be defined in infinitely many ways. A desideratum for the VR-space is to keep as many properties from the original space as possible, in particular, the similarity structure of the data [4]. In this sense, the objective of the mapping is to maximize some metric/non-metric structure preservation criteria [13], or minimize some measure of in-formation loss. In a supervised approach, when a decision attribute is used explicitly, measures of class separability can be used for constructing virtual reality spaces with nonlinear features maximizing the differentiation of the data objects from the point of view of the classes of the decision attribute. This technique was used as a visual data mining aid for the interpretation of the datasets described only in terms of the subsets of attributes resulting from the data processing pipelines.
2.5 Implementation
A detailed perspective of data mining procedures provides insight into additional im-portant issues to consider (e.g. storage/memory/communication/management/time/etc) when evaluating a computational methodology; consisting of combined techniques. This study presents one possible implementation, from which more software devel-opment may occur in order to integrate better and/or different tools. In addition, all of
these issues become even more pronounced when, as in this study, a complex problem is investigated.
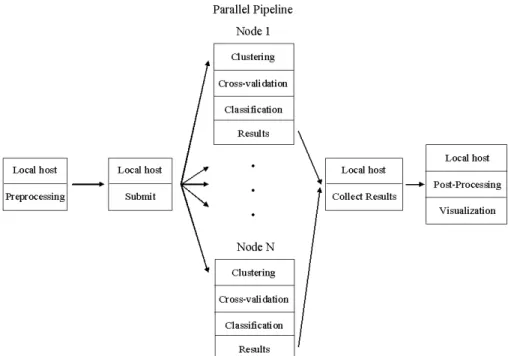
The implementation is in the paradigm of a high throughput pipeline (Fig-2) con-sisting of many co-operating programs, which was automatically generated. The file generation program (written in Python and running on the local host) created a pipeline oriented towards Condor (http://www.cs.wisc.edu/condor/), a distributed computing en-vironment developed by the Condor Research Project at the University of Wisconsin-Madison (UW-Wisconsin-Madison). Condor is a specialized workload management system for compute-intensive jobs. Like other full-featured batch systems, Condor provides a job queueing mechanism, scheduling policy, priority scheme, resource monitoring, and re-source management.
The initial preprocessing stage of the pipe, occurring on the local host after gener-ation of files, involves shuffling the input data records as described previously and in Fig-1. The shuffled data is stored on the local host’s disk, in order to provide the same randomized data to the next stage of processing, which occurs on the remote hosts (Fig-2).
A Condor submission program, which was also automatically generated, is used to specify all of the data and configuration files for the programs that will execute on the remote host. The submission process enables Condor to i) schedule jobs for execution, ii)check point them (put a job on hold), iii) transfer all data to the remote host, and iv) transfer all generated data back to the local host (submitting machine).
The final postprocessing stage of the pipe involves collecting all of the results (pars-ing the files) and report(pars-ing them in a database. These results may then be queried and visualized using a high dimensional visualization system (as described in the VR sec-tion above) for the purpose of aiding results interpretasec-tion.
3
Experimental Settings
3.1 Leukemia Gene Expression Data
The example high dimensional dataset selected is that of [8], and consists of 7129 genes where patients are separated into i) a training set containing 38 bone marrow samples: 27 acute lymphoblastic leukemia (ALL) and 11 acute myeloid leukemia (AML), ob-tained from patients at the time of diagnosis, and ii) a testing set containing 34 samples (24 bone marrow and 10 peripheral blood samples), where 20 are ALL and 14 AML. Note that, the test set contains a much broader range of biological samples, including those from peripheral blood rather than bone marrow, from childhood AML patients, and from different reference laboratories that used different sample preparation proto-cols. Further, the dataset is known to have two types of ALL, namely B-cell and T-cell. For the purposes of investigation, only the AML and ALL distinction was made. The dataset distributed by [8] contains preprocessed intensity values, which were obtained by re-scaling such that overall intensities for each chip are equivalent (A linear regres-sion model using all genes was fit to the data). In this paper no explicit preprocessing of the data was performed, in order to not introduce bias and to be able to expose the behavior of the data processing strategy, the methods used, and their robustness. That
Relevant attribute discovery in high dimensional data 7
Fig. 2.Automatically generated high throughput pipeline oriented towards the Condor distributed computing environment.
is, no background subtraction, deletions, filtering, or averaging of samples/genes were applied, as it is typically done in gene expression experiments.
3.2 Settings
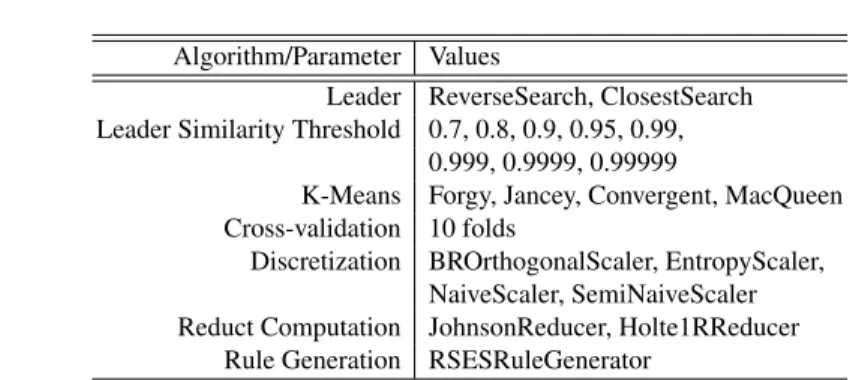
The pipeline (Fig-1) was investigated through the generation of480 k-leader and 160 l-leader for a total of640 experiments (Table-1).
The discretization, reduct computation and rule generation algorithms are those in-cluded in the Rosetta system [11]. This approach leads to the generation of 74 files per experiment, with 10-fold cross-validation.
4
Results
From the experiments completed so far, one was chosen which illustrates the kind of results obtained with the explored methodology. It corresponds to a leader clustering algorithm with a similarity threshold of0.99 (leading to 766 l-leader attributes), used as input to the data processing pipeline containing 38 samples. The results of the best10 fold cross-validated experiment has a mean accuracy of0.925 and a standard deviation of0.168. This experiment led to 766 reducts (all of them singleton attributes), which was consistent across each of the10 folds. The obtained classification accuracy repre-sents a slight improvement over those results reported in [17] (0.912). It was conjectured
Algorithm/Parameter Values
Leader ReverseSearch, ClosestSearch Leader Similarity Threshold 0.7, 0.8, 0.9, 0.95, 0.99,
0.999, 0.9999, 0.99999
K-Means Forgy, Jancey, Convergent, MacQueen Cross-validation 10 folds
Discretization BROrthogonalScaler, EntropyScaler, NaiveScaler, SemiNaiveScaler Reduct Computation JohnsonReducer, Holte1RReducer
Rule Generation RSESRuleGenerator
Table 1.The set of parameters and values used in the experiments using the distributed pipeline environment.
in that study that the introduction of a cross-validated methodology could improve the obtained classification accuracies, which is indeed the case. It is interesting to observe that all of the7 relevant attributes (genes) reported in [17] are contained (subsumed) within the single experiment mentioned above. Moreover, they were collectively found using both the leader and k-means algorithms, with different dissimilarity thresholds and number of clusters, whereas with the present approach, a single leader clustering input was required to get the better result. Among the relevant attributes (genes) ob-tained, many coincide with those reported by [8], [7], and [17].
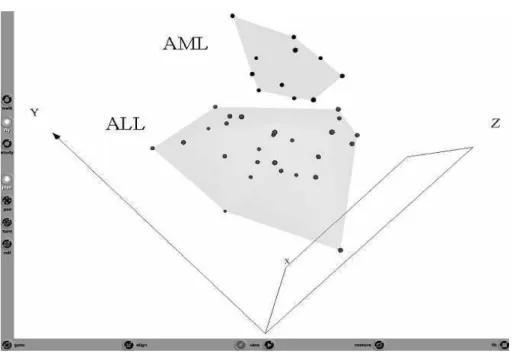
At a post-processing stage, a virtual reality representation of the above mentioned experiment is shown in Fig-3. Due to the limitations of representing an interactive vir-tual world on static media, a snapshot from an appropriate perspective is presented. Sammon’s error [13] was used as criteria for computing the virtual reality space, and also Gower’s similarity was used for characterizing the data in the space of the766 selected genes. After 200 iterations a satisfactory error level of0.0998 was obtained. It is interesting to see that the ALL and AML classes can be clearly differentiated.
5
Conclusions
Good results were obtained with the proposed high throughput pipeline based on the combination of clustering and rough sets techniques for the discovery of relevant at-tributes in high dimensional data. In particular, the introduction of a fast attribute re-duction procedure aided rough set reduct discovery in terms of computational time, of which the former is further improvable via its amenability for parallel and distributed computing. Cross-validated experiments using Leukemia gene expression data demon-strates the possibilities of the proposed approach. More thorough studies are required to correctly evaluate the impact of the experimental settings on the data mining effectivity. Visual exploration of the results (when focusing on selected genes) was very useful for understanding the properties of the pipeline outputs, and the relationships between the discovered attributes and the class structure. Further experiments with this approach are necessary.
Relevant attribute discovery in high dimensional data 9
Fig. 3.Snapshot of the Virtual Reality representation of the union of all of the reducts obtained from 10 fold cross-validation input (38 samples with 766 genes). The leader clustering algo-rithm was used with a similarity threshold of 0.99. The ALL and the AML classes are perfectly separated. Representation error = 0.0998.
6
Acknowledgements
This research was conducted within the scope of the BioMine project (National Re-search Council Canada (NRC), Institute for Information Technology (IIT)). The authors would like to thank Fazel Famili, and Robert Orchard from the Integrated Reasoning Group (NRC-IIT).
References
1. Anderberg, M.: Cluster Analysis for Applications. Academic Press, (1973) 359pp.
2. Bazan, J.G., Skowron A., Synak, P: Dynamic Reducts as a Tool for Extracting Laws from Decision Tables. Proc. of the Symp. on Methodologies for Intelligent Systems. Charlotte, NC, Oct. 16-19 1994. Lecture Notes in Artificial Intelligence 869, Springer-Verlag (1994), 346– 355.
3. Bazan, J.G., Szczuka S., Wroblewski, J: A New Version of Rough Set Exploration System. Third. Int. Conf. on Rough Sets and Current Trends in Computing RSCTC 2002. Malvern, PA, USA, Oct 14-17. Alpigini, Peters, Skowron, Zhong (Eds.) Lecture Notes in Computer Science (Lecture Notes in Artificial Intelligence Series) LNCS 2475, Springer-Verlag (2002), 397–404.
4. Borg, I., and Lingoes, J., Multidimensional similarity structure analysis: Springer-Verlag, New York, NY (1987), 390 p.
5. Brenner, N., Marix Transposition in Place. Comm. of the ACM vol 16, No. 11, (1973), 692– 694.
6. Chandon, J.L., and Pinson, S., Analyse typologique. Thorie et applications: Masson, Paris (1981), 254 p.
7. Famili, F. and Ouyang, J., Data mining: understanding data and disease modeling. In Proceed-ings of the 21st IASTED International Conference, Applied Informatics, Innsbruck, Austria, 32–37. Feb. 10-13, (2003).
8. Golub, T.R., etal. Molecular classification of cancer: class discovery and class prediction by gene expression monitoring. Science, vol. 286, pp531–537.
9. Gower, J.C., A general coefficient of similarity and some of its properties: Biometrics, v.1, no. 27, p. 857–871. (1973).
10. Hartigan, J.: Clustering Algorithms. John Wiley & Sons, 351 pp, (1975).
11. Øhrn A., Komorowski J.: Rosetta- A Rough Set Toolkit for the Analysis of Data. Proc. of Third Int. Join Conf. on Information Sciences (JCIS97), Durham, NC, USA, March 1-5, (1997), 403–407.
12. Pawlak, Z., Rough sets: Theoretical aspects of reasoning about data: Kluwer Academic Pub-lishers, Dordrecht, Netherlands, 229 p. (1991).
13. Sammon, J.W. A non-linear mapping for data structure analysis. IEEE Trans. on Computers C18, p 401–409 (1969).
14. Son H. Nguyen, Hoa S. Nguyen. Discretization Methods in Data Mining. In: L. Polkowski, A. Skowron (eds.): Rough Sets in Knowledge Discovery. Physica-Verlag, Heidelberg, pp. 451-482 (1998).
15. Vald´es, J.J.: Virtual Reality Representation of Relational Systems and Decision Rules: An exploratory Tool for understanding Data Structure. In Theory and Application of Relational Structures as Knowledge Instruments. Meeting of the COST Action 274 (P. Hajek. Ed). Prague, November 14–16 (2002).
16. Vald´es, J.J : Similarity-Based Heterogeneous Neurons in the Context of General Observa-tional Models. Neural Network World. Vol 12, No. 5, pp 499–508, (2002).
17. Vald´es, J.J.,Barton A.J: Gene Discovery in Leukemia Revisited: A Computational Intelli-gence Perspective. Proceedings of the 17th International Conference on Industrial & Engi-neering Applications of Artificial Intelligence & Expert Systems May 17-20, 2004, Ottawa, Canada. Lecture Notes in Artificial Intelligence LNAI 3029, pp 118–127. Springer-Verlag, (2004).
18. Wr´oblewski, J: Ensembles of Classifiers Based on Approximate Reducts. Fundamenta Infor-maticae 47 IOS Press, (2001), 351–360.