DOI: 10.1007/s00340-005-2010-3 Lasers and Optics
m. taslakov v. simeonov m. froidevaux h. van den berghu
Open-path ozone detection
by quantum-cascade laser
Air and Soil Pollution Laboratory (LPAS), Swiss Federal Institute of Technology (EPFL), 1015 Lausanne, Switzerland
Received: 27 August 2004/Final version: 26 August 2005 Published online: 21 December 2005 • © Springer-Verlag 2005 ABSTRACTOpen-path ozone measurements performed by mid-IR differential absorption spectroscopy are reported. Ozone spectrum was taken by fast repetitive sweeping of a quantum-cascade laser wavelength over a spectral feature from theν3
ab-sorption band of ozone, centered at 1031.2 cm−1. Short (100 ns) sweeping times were essential to prevent line-distortions caused by atmospheric turbulence. For fast wavelength sweeping, a technique that employed the thermal chirp during 140 ns exci-tation pulses was used. The lowest detection limit of 0.3 ppm.m was estimated from the minimum detectable differential absorp-tion. We present the results from cell and open-path measure-ments over 440 and 5800 m, together with experimental data regarding the tuning range, the tuning rate and the tuning linear-ity of the QCL while operated with 140 ns excitation pulses.
PACS42.62.Fi; 82.80.Gk; 92.60.Sz
1 Introduction
Numerical models used in air pollution studies pro-vide a space- and time-averaged description of the atmo-sphere. Since these models have a typical spatial resolution of 1–5 km for urban areas, running and validating them re-quires input data of similar resolution [1–3]. Although point measurements cannot accurately represent a large spatial area for this purpose, particularly in poorly mixed atmospheres [4], there exist optical remote sensing techniques, such as DOAS and FTIR that can directly provide accurate, simultaneous measurements of the average concentration of a number of trace gases over long open paths. However, DOAS measure-ments are limited to a few compounds absorbing in the UV-visible spectral region. Due to high molecular absorption, the operational range of commercial DOAS systems rarely ex-ceeds 2 km and their measuring abilities are further reduced in aerosol-rich (i.e., smoggy) environments.
Mid-infrared absorption spectroscopy is widely used for monitoring trace atmospheric species. This spectral region is attractive for direct detection in the open atmosphere because of its potentially high sensitivity and selectivity as well as its intrinsic high immunity against aerosol influence. The tra-ditionally used mid-IR spectroscopy active FTIR technique, u Fax: +41 69 33 626, E-mail: hubert.vandenberg@epfl.ch
which employs non-coherent light sources, has relatively low sensitivity and relatively high cost.
Successful detection of various trace gases at concentra-tion levels typically of the order of parts per billion has been achieved with mid-IR coherent light sources such as differ-ence frequency generation (DFG) devices and lead-salt tun-able diode lasers (TDL) [5].
By employing different nonlinear crystals, DFG devices can cover a wide wavelength range (2–20µm) [6, 7], thus having the potential of detecting a great number of atmo-spheric species. However, DFG sources not only have low optical power, usually in the sub-mW range, but also are cumbersome and relatively difficult to tune. Despite the low optical power and complexity, a number of successful cell ex-periments for trace gas detection have been reported [8–10]
Lead-salt TDLs have been used to carry out a consid-erable number of mid IR trace-gas detection studies ever since they became available in the mid 60 s because they are particularly good for spectroscopic applications; they have a wide temperature tuning range (up to 100 cm−1), easy tunability by temperature and current, and they can perform at wavelengths from 3 to 30µm [5, 11]. Routine detection of a number of atmospheric species at ppb lev-els [12], as well as detection limits as low as parts per trillion have been achieved using lead-salt TDLs [12–15]. Most of these instruments employ multiple-pass low-pressure cells, but open path measurements of NO, NO2 CO, and CO2
for distances of several meters [12] and detection of CO at distances of 610 m [16] have also been reported. However, because of the high temperature tuning rates (2–5 cm−1/K) and current tuning rates (0.02–0.07 cm−1/mA), lead salt lasers require temperature stabilization better than 1 mK and low noise current controllers (better than 10µA) [5, 11]. In addition, the need for cryogenic cooling makes them less suitable for field applications and unattended automatic operation.
The advance of quantum-cascade lasers (QCL) [17] al-lows the application of a tunable, compact, non-cryogenic source for real-time spectroscopic monitoring of molecular species in the mid-IR. The high optical power of these lasers (up to 6 W in pulsed mode [18]) makes it possible to use ther-moelectrically cooled IR detectors with lower D* [19, 20] and hence, to build entirely non-cryogenic instruments for trace gas monitoring. QCLs have been used to detect a number of
trace gases, such as CH4, C2H6, NO, NO2, CO, NH3and O3, among others, in ppb or sub-ppb [21] concentrations [21–26]. With a few exceptions [20, 25, 27] multiple-pass absorption cells (White or Herriott) or optical cavities operated at low gas pressure were used in these experiments in order to attain high sensitivity.
These techniques can suffer from wall and reaction effects due to sample-handling if highly reactive species in trace con-centrations, such as HNO3, NH3 or OH, are to be detected. In addition, as in all point-sampling methods, they can easily be affected by neighboring pollutant sources. This makes the results only locally representative and not suitable for applica-tion with numerical models.
An obvious way to overcome the drawbacks of the point-sampling methods is probing over an open-air path. The spa-tial resolution of open-path measurements can be adapted to the resolution of numerical models [1–3]. Nevertheless, when operating in the open air, a number of complications arise from pressure-induced line-broadening and from atmospheric turbulence. The line-broadening reduces the line contrast, and hence the sensitivity of the measurement and imposes require-ments for a broader laser tuning range. The lower sensitivity can be compensated, to some extent, by increasing the opti-cal path-length. However, the maximum path-length is in turn limited significantly by atmospheric attenuation and turbu-lence. The attenuation for distances of several kilometers is no longer a serious problem thanks to the high optical power of QCLs. Atmospheric turbulence causes random amplitude variations of the detected signal. These variations induce sig-nificant line-distortions when the time for scanning a spec-tral line is longer than, or comparable with the characteris-tic time of turbulent processes [28]. The turbulence-induced line-distortions can be removed if the scanning time is of the order of hundreds of microseconds. For such time scales, the atmosphere can be considered “frozen” [28, 29] and the turbulence affects only the amplitude but not the shape of the recorded spectrum. The individual fast scans are then av-eraged to minimize the random noise. The widely applied methods for wavelength tuning are too slow to be applicable to open-path measurements. Sub-threshold ramp tuning, fre-quently used in low-pressure systems, has millisecond tuning times and limited tunability. External-temperature tuning has sufficient tuning range but the tuning times are of the order of minutes.
Fast wavelength tuning can be realized by driving the laser with “long” (hundreds of nanoseconds) current pulses [20, 30]. The tuning is a result of the self-heating of the laser struc-ture during the pulse (thermal chirp). Tuning ranges of more than one cm−1and tuning times of the order of hundreds of nanoseconds can be achieved by this technique.
In this paper, we report on experiments of open-path ozone detection over distances of 440 m and 5800 m, em-ploying a quantum-cascade laser tuned by long pulses (in-trapulse spectroscopy). The results of these experiments, together with cell measurements of ozone concentrations within the 0.93–2000 ppm m range taken for calibration pur-poses, are analyzed. Experimental data regarding the tun-ing range, the tuntun-ing rate and the tuntun-ing linearity of the QCL while operated with long excitation pulses are also presented.
2 Experimental setup
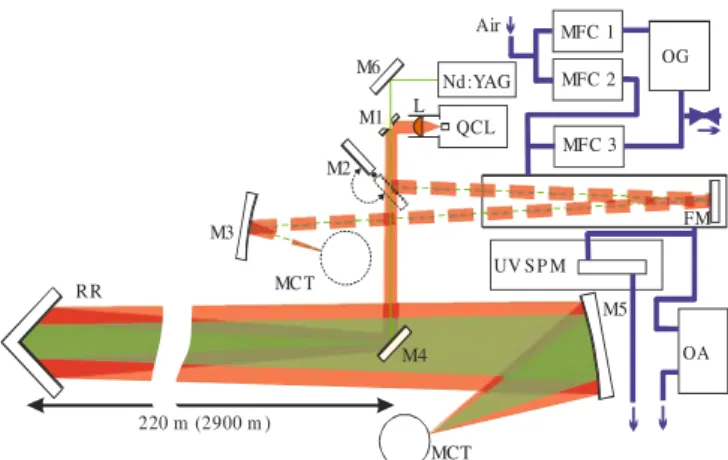
The experimental setup was designed to allow easy adaptation from the laboratory measurements in a cell to open path experiments (Fig. 1). In both studies, the light source was a pulsed DFB quantum-cascade laser (Alpes Lasers). The characteristic emission wavelength of the laser at 273 K is 9.69 µm (1031.5 cm−1) and the maximum average output power is 5 mW, measured at 2% duty cycle with 50 ns pulses and 11 V laser supply voltage. The wavelength selection was determined by the available laser sources and the necessity to achieve maximum differential ozone absorption, minimizing at the same time the influence of CO2and water vapor. Even though CO2and water vapor absorption is low in the 8–13µm atmospheric window, their influence can be significant over a long optical path because of their relatively high concentra-tions. As discussed above another essential requirement for the successful detection of atmospheric species over long op-tical paths in the open atmosphere is the fast frequency sweep. Therefore, in our experiments we employed a thermal chirp during 140 ns excitation pulses to achieve a tuning range of 0.6 cm−1within 100 ns.
Because long optical trajectory measurements require high collection efficiency and low beam divergence, the laser radiation was collimated by a f/1, 25-mm-focal-length, AR-coated aspheric ZnSe lens (L). The lens is also used as an output window, allowing the removal of the original flat-parallel laser window. Thus, the parasitic interference fringes caused by the original window are eliminated. For precise adjustment of the beam direction and divergence, the lens is mounted on a hermetically sealed X–Y –Z holder. To facilitate the optical alignment, a green (532 nm) beam from a 5 mW laser pointer is directed coaxially to the collimated IR beam through a 1 mm hole in the first steering mirror (M1). The two beams can be either delivered to the cell in the labora-tory measurements or transmitted into the atmosphere in the open-path experiments by a removable mirror (M2) installed on a flipper mount.
For the cell measurements, mirror M2is inserted in the op-tical path and the beam is directed through the 1 meter long cell into which air with a predefined ozone content flows.
FIGURE 1 Experimental setup; L–collimating lens, M–mirror, MFC–mass flow controller, OG–ozone generator, OA–ozone analyzer, UV SPM–UV spectrometer, RR–retroreflector
The cell is equipped with a 12µm thick polypropylene pel-licle input/output window and an Al -coated, path-folding mirror (FM) placed inside the cell. By using a pellicle win-dow, we avoid the interference fringes caused by flat-parallel windows. After a double pass within the cell (L= 196 cm – effective absorption pathlength), the QCL beam is focused on the detector by a 15 cm focal-length, Al-coated spherical mirror (M3).
The open path experiments were carried out with a mono-static (transmitter-retroreflector-receiver) configuration. In these experiments, mirror M2 is removed from the IR beam path and the laser radiation is transmitted into the atmosphere coaxially to the receiver telescope by a flat, Al-coated mir-ror (M4). A single, hollow, corner-cube retroreflector (RR) with 60 mm clear aperture, placed at distances of 220 m and 2900 mfrom the laboratory returns part of the laser radiation back to the receiver. A 220 mm in diameter, F/5, Al-coated, off-axis parabolic mirror M5serves as a receiver telescope and focuses the radiation on the detector. The detector is liquid-nitrogen cooled MCT photovoltaic type, (KMPV11-1-J1/DC of Kolmar technology) with 0.2 × 0.2 mm2 active area and 200 MHz (small signal) bandwidth. We used the same de-tector for all experiments to prevent possible discrepancies between the cell and the open path measurements. An 8-bit, 5-GSPS, 1 GHz, digital oscilloscope (LeCroy Waverunner 6100) was used for signal acquisition in both experiments. The choice of the oscilloscope was determined by the ne-cessity to have the ADC Nyquist frequency at least 10 times higher than the bandwidth of the detector to ensure proper digitization of the signals.
The ozone for the cell measurements was produced from air by a corona-discharge ozone- generator (OG). The gen-erator (Fisher OZ 503) was operated at a fixed ozone pro-duction rate and the ozone concentrations needed for the ex-periment, ranging from 0.5 to 1000 ppm, were obtained by diluting ozone with air. Dilution ratios from 1/100 to up to 10/1 were achieved using four mass-flow controllers (MFC); one 10 l/min maximum flow rate MFC to control the pure air flow and three MFCs with maximum flow rates of 0.1, 2.0 and 5.0 l/min for controlling the ozone flow. A calibrated ozone analyzer (OA)–EC 9810 directly measured ozone concen-trations within 0.5–30 ppm range. The ozone concentrations from 10 ppm to 1000 ppm were derived from the UV absorp-tion at 255.5 nm, measured in a 110 mm cell by an UV-visible spectrophotometer (UV SPM)–Hitachi U 2001 using the ab-sorption cross section cited in [31]. Throughout the meas-urements the cell pressure and temperature were monitored and the total gas flow rate through the cell was maintained at 9.0 l/min.
3 Wavelength calibration, tuning range and tuning linearity
The absolute laser wavelength derived by the man-ufacturer from FTIR measurements is 1031.5 cm−1at 273 K. We verified it by spectral identification of the CO2 line at 1031.477 cm−1, measured with the laser at ambient pressure, with the spectrum from the HITRAN 2004 database [32, 33].
Subsequently the tuning range, the tuning rate and lin-earity for 140 ns drive pulses were measured. During these
measurements, we noticed that an overshot of the optical power higher than 300% appeared on the rising edge of the pulse when the laser was driven with pulses longer than 50 ns. This overshot, caused by an overshot of the driving current, not only reduced the useful part of the pulse by almost 50%, because of the induced strong detector ringing, but also over-loaded the detector and reduced its dynamic range. The prob-lem was solved by adding a low-pass RC filter between the last driver stage and the gate of the output MOSFET of the original laser driver.
The tuning range and the tuning rate and linearity were studied by means of an uncoated Ge etalon with a free spectral range of 1.871 GHz (0.0624 cm−1). The measurements were performed under the following operational conditions; laser temperature 271 K, pulse duration 140 ns and peak current pulse 1.8 A. Experimental results showing the reference pulse and the etalon fringes before and after normalization are pre-sented in Fig. 2. For better visualization, the fringes are scaled and transposed. The steady increase of the interference con-trast seen on the normalized pulse could possibly be explained by a decrease of the instantaneous laser linewidth. The exper-imentally obtained tuning range and tuning rate are shown in Fig. 3. As seen from the figure, the usable tuning range is
ap-FIGURE 2 Laser wavelength calibration with an etalon
prox 0.6 cm−1. The experimental tuning rate was fitted with a third order polynomial:
ν = 1031.58 − 7.83 ×10⁻³t+ 1.77 × 10⁻⁵t2+ 4.56 × 10⁻⁸t3 (1) whereν is the wavenumber in cm−1and t the time from the beginning of the pulse in ns. The fitting function was used for wavelength linearization during the spectra treatment. The tuning nonlinearity decreases over time, as seen from the evo-lution of the tuning rate, and therefore it is preferable to use the last part of the pulse when possible.
4 Cell measurements
The absorption spectra of ozone at different con-centrations were first measured in a cell at atmospheric pres-sure in order to simulate open-path conditions. The results were used to define the lower detection limit and to cali-brate the open path measurements. The spectra were acquired in the 1030.75–1031.35 cm−1range where the atmospheric absorption is defined predominantly by the unresolved at at-mospheric pressure ν3 lines 111,10–121,11, 105,6–115,7 and 112,9–122,10[32].
The measurements were taken at eight ozone column den-sities ranging from 0.93 ppm m to 2000 ppm m. This range covers all observable ozone concentrations in real conditions for optical path-lengths of up to 10 km. The data for each con-centration consisted of a set of ten individual measurements, each obtained after averaging over 10 000 laser pulses. First, a baseline value was subtracted. The baseline was computed as an average of 100 data points prior to the start of the optical pulse. The transmittance at a given concentration was calcu-lated as the ratio from a signal measured at this concentration to a reference signal recorded without ozone.
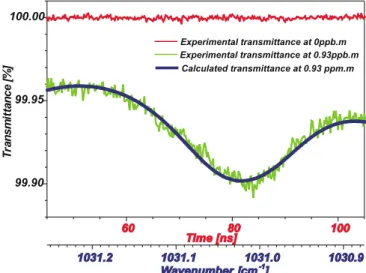
To verify the results, the experimental and simulated (from HITRAN 2004 within the 1029–1032 cm−1range) transmit-tances were compared. All ozone lines in this range and the pressure broadening at 970 hPa were accounted for in the calculations. To illustrate the results, the experimental transmittance, measured at the lower ozone column density of 0.93 ppm m, and the simulated transmission spectra are compared in Fig. 4. The comparison demonstrates very good agreement, with relative discrepancies between the predicted and experimental transmittances not exceeding 10%.
The differential ozone transmittances, calculated as a ratio between the transmittances at 1031.215 cm−1 and 1031.025 cm−1, were then derived from the experimental
O3concentration O3concentration Differential transmittance Differential transmittance
EC 9810 [ppm] UV SPM [ppm] HITRAN×100 experimental×100 0±0.001 – 100−0.000128 100.003±0.015 0.48±0.0048 – 99.94±0.0004 99.929±0.007 1.0±0.01 – 99.876±0.0012 99.8677±0.009 3.02±0.03 – 99.625±0.0037 99.663±0.008 10.1±0.1 10.1±0.33 98.763±0.012 98.748±0.016 30.0±0.3 30.3±0.3 96.283±0.036 96.341±0.019 - 101.5±0.4 88.082±0.044 87.645±0.204 - 304.1±1.51 68.373±0.129 65.285±0.219 - 1018±7.6 28.006±0.23 25.491±0.13
TABLE 1 Comparison between HITRAN simulated and measured differential ozone transmittances at 1031.215 cm−1and 1031.025 cm−1
FIGURE 4 Ozone spectra taken at 0.93 ppm m
data. The wavelengths themselves correspond to the mini-mum and the maximini-mum transmittances calculated from the HITRAN database. The measured and calculated (HITRAN) differential transmittances are compared in Table 1. The er-rors in the theoretical differential transmittance take into account the uncertainties in the ozone concentrations. The values of the ozone concentrations (measured by the two methods) and their corresponding measurement errors are also shown in the table. As can be seen from the table there, is good agreement between the theoretical and experimen-tal differential transmittances for ozone concentrations up to 30 ppm. At concentrations higher than 30 ppm, the experi-ment shows higher differential transmittances (higher ozone concentrations). The discrepancies increase with the increase of the concentration (reaching 9% at 1000 ppm) and cannot be explained by ozone losses in the cell (assuming that the loss is proportional to the concentration). Since the discrep-ancies are more pronounced at higher concentrations, where the transmittance amplitude differences and the transmittance change rates are higher, the most plausible explanation is an undershoot/overshoot of the detector. Therefore, to compen-sate for this effect, we use the values from the numerical fit of the experimental differential transmittance instead of the HITRAN values to derive the ozone concentrations in the open-path experiments.
From the experimental results we estimated the lower detection limit (LDL) as 0.3 ppm m, assuming a minimum measurable differential absorption of 0.015% inferred from
the standard deviation of the reference (zero ozone) signal. This LDL value is comparable with the typical LDL value of 2 ppm mof the commercial UV DOAS systems for similar ac-quisition times.
5 Open–path measurements
The open-path experiments were carried out over 440 and 5800 m path-lengths. The measurements were taken at ambient ozone concentrations ranging from 10 to 70 ppb. In all experiments, the transmitter was placed in the labora-tory situated at approximately 20 m above ground level. The retroreflectors were installed on the roofs of two buildings: the first one at a height of 20 m and a distance of 220 m, and the second at a height of 30 m and 2900 m from the labora-tory. Despite the small size of the retroreflector, the strength of the optical signals received from 440 m was high enough to saturate the detector and necessitate the use of a 10-times attenuator.
As in the cell experiment, the ozone concentrations in the open-path measurements were derived from the measured dif-ferential transmittances at 1031.215 cm−1and 1031.025 cm−1 using the calibration values from the cell measurements. Cal-ibration, instead of fitting to a HITRAN profile, was preferred for the open path measurements because it allows the cali-bration of the entire signal processing chain. The scattered plot in Fig. 5 compares the results from the short (440 m) open-path ozone measurements with the data acquired with two UV photometric ozone analyzers (EC 9810 and Dasibi 1008) installed at the transmitter and the retroreflector sites. The discrepancies between the results obtained by the open-path and point measurements do not exceed 10% of the full-scale range. There are several possible reasons for these dis-crepancies. The major reason stems from the fact that point-sampling and space integrated measurements are compared, and even though the readings of the analyzers did not dif-fer by more than 5 ppb, uneven ozone distribution over the optical path is always a possibility. This uneven distribution could have been caused by the influence of nearby buildings
FIGURE 5 Comparison between QCL-derived measurements and ozone monitor-recorded ozone concentrations. The QCL measurements were taken over 440 m path length
FIGURE 6 Atmospheric transmittance measured over 5800 m open-path at three ozone concentrations
and a road situated below and approximately in the middle of the optical path. The enhanced turbulence in the morning hours added to the inhomogeneous ozone distribution over the optical trajectory. The effect is most pronounced at con-centrations between 10 and 30 ppb measured in the morning hours.
The signal from the long distance was approximately 2000 times weaker but sufficient for successful detection in clear weather conditions. Figure 6 shows signals recorded from this distance at ambient ozone concentrations of 8.5, 32 and 58 ppb. The signals were obtained by averaging 10 000 pulses (averaging time 18 sec). Further path-length enhancement or operation in turbid atmospheric conditions (fog, drizzle or smog) could be achieved by employing a larger retroreflector and thus increasing the signal strength.
6 Conclusions and outlook
Quantitative ozone measurements over a long open optical path by a mid-IR quantum-cascade laser based sys-tem have been achieved. The lower detection limit of such measurements, estimated from the lowest detectable differen-tial transmittance measured in cell experiments, is 0.3 ppm m. During the tests, successful ozone detection at ambient ozone concentrations ranging from 10 to 70 ppb was performed for optical path-lengths of up to 5800 m. The signal could be enhanced, and the operational range could be extended by employing a larger retroreflector and/or by further reduc-tion of the beam divergence. Comparisons between short path (440 m pathlength) measurements and simultaneous ozone measurements taken with commercial ozone UV photome-ters installed on both sides of the optical path show very good agreement.
One of the milestones of this work, allowing open-path measurements, was the successful elimination of atmospheric turbulence-caused line-shape distortion. This was achieved by using fast wavelength sweeping. Because of the high sweep-ing rates, the atmosphere can be considered “frozen” and the turbulence-induced line-shape distortion of the spectrum can be neglected. The sweeping exploits the thermal chirp during
a long excitation pulse (intrapulse tuning). Sweeping ranges of 0.6 cm and sweeping times of 140 ns were achieved by this method.
The reported method has several advantages over the con-ventional UV visible DOAS and the active FTIR techniques. One important advantage is the longer optical paths allowed through the use of a coherent source with higher brightness. The greatest advantage over the UV DOAS is the ability of the proposed method to perform in conditions with low visibility (i.e., fog, drizzle or smog) due to greatly reduced aerosol scat-tering losses. Preliminary experimental measurements (not shown here) carried out in drizzle and light fog conditions are promising. Because ozone is a key component of urban smog, measurements in smoggy conditions, when other remote op-tical methods fail or have serious errors, are essential for the evaluation of environmental and human health hazards.
In conclusion, the results from the first tests of our system show the feasibility of using intrapulse-tuned QCLs to meas-ure trace gases over long optical trajectories in open atmo-sphere. Measurements of other atmospheric species in trace concentrations should also be possible using lasers with suit-able wavelengths. Open path measurements with QCL can be particularly valuable when highly reactive gases need to be monitored. The low power consumption, high output power, compact size and non-cryogenic operation of the QCLs, in combination with the new thermoelectrically cooled detec-tors, makes it possible to build compact, field-deployable in-struments for trace-gas monitoring.
ACKNOWLEDGEMENTS This research was supported by the Swiss National Science Foundation in the framework of the Quantum Photonics National Centre of Competence in Research (QP- NCCR). We gratefully acknowledge the Mesoscopic group of the Neuchˆatel University, Switzerland and Alpes Lasers and particularly Prof. J. Faist and Dr. A. M¨uller for their cooperation and for the valuable discussions we had.
REFERENCES
1 S. Perego, Meteor. Atmos. Phys. 70, 43 (1999)
2 P. Thunis, A. Clappier, Mon. Wea. Rev. 128, 3236 (2000)
3 O. Couach, I. Balin, R. Jim´enez, P. Ristori, S. Perego, F. Kirchner, V. Simeonov, B. Calpini, H. van den Berg, Atmos. Chem. Phys. 3, 549 (2003)
4 R. Jim´enez, T. Iannone, H. van den Bergh, B. Calpini, D. Kita, A&WMA 93rd Annual Conf. & Exhib., paper 830 (18–22 June 2000)
5 F. Titel, D. Richter, A. Freid, Mid-Infrared Laser Applications in Spec-troscopy, In: Solid-State Mid-Infrared Laser Sources, I.T. Sorokina, K.L. Vodopyanov (Eds.) (Springer Verlag, Berlin, Heidelberg 2003) p. 445–510
6 A. Arie, K. Fradkin-Kashi, Y. Shreberk, Opt. Lasers Engin. 37, 159 (2002)
7 V. Petrov, C. Rempel, K. Stolberg, W. Schade, Appl. Opt. 37, 4925 (1998)
8 K.P. Petrov, R.F. Curl, F.K. Tittel, Appl. Phys. B 66, 531 (1998) 9 A. Khorsandi, U. Willer, L. Wondraczek, W. Schade, Appl. Opt. 43,
6481 (2004)
10 D. Richter, A. Fried, B. Wert, J. Walega, F. Tittel, Appl. Phys. B 75, 281 (2002)
11 P. Werle, K. Maurer, R. Kormann, R. Mucke, F. D’Amato, T. Lancia, A. Popov, Spectrochim. Acta Part A 58, 2361 (2002)
12 http://www.aerodyne.com/ Tunable diode laser trace gas detectors, and Quantum cascade laser trace gas detectors
13 A. Fried, S. Sewell, B. Henry, B. Wert, T. Gilpin, J. Drummond, Geo-phys. Res.-Atmospheres 102, 6253 (1997)
14 A. Fried, J. Crawford, J. Olson, J. Walega, W. Potter, B. Wert, C. Jor-dan, B. Anderson, R. Shetter, B. Lefer, D. Blake, N. Blake, S. Meinardi, B. Heikes, D. O’Sullivan, J. Snow, H. Fuelberg, C. Kiley, S. Sandholm, D. Tan, G. Sachse, H. Singh, I. Faloona, C. Harward, G. Carmichael, J. Geophys. Res. 108, 8365 (2003)
15 R. Kormann, H. Fischer, G. Gurk, F. Helleis, T. Klupfel, K. Kowalski, R. Konigstedt, U. Parchatka, V. Wagner, Spectrochim. Acta Part A 58, 2489 (2002)
16 R.T. Ku, E.D. Hinkley, J.O. Sample, Appl. Opt. 14, 854 (1975) 17 J. Faist, F. Capasso, D. Sivco, C. Sirtori, A. Hutchinson, A. Cho, Science
264, 553 (1994)
18 J. Faist, Personal communication
19 http://www.vigo.com.pl/index.php?vigo=112
20 T. Beyer, M. Braun, A. Lambrecht, J. Appl. Phys. 93, 3158 (2003) 21 D.D. Nelson, J. Shorter, J. McManus, M. Zahniser, Appl. Phys. B 75,
343 (2002)
22 A.A. Kosterev, F.K. Tittel, IEEE J. Quantum Electron QE-38, 582 (2002)
23 A.A. Kosterev, Y.A. Bakhirkin, F.K. Tittel, Appl. Phys. B, 80, 133 (2005)
24 D. Weidmann, F. Tittel, T. Aellen, M. Beck, D. Hofstetter, J. Faist, S. Blaser, Appl. Phys. B 79, 907 (2004)
25 R. Jim´enez, M. Taslakov, V. Simeonov, B. Calpini, F. Jeanneret, D. Hof-stetter, M. Beck, J. Faist, H. Van den Bergh, Appl. Phys. B 78, 249 (2004)
26 D. Hofstetter, M. Beck, J. Faist, M. Nagele, M. Sigrist, Opt. Lett. 26, 887 (2001)
27 S. Schilt, L. Thevenaz, E. Courtois, P. Robert, Spectrochim. Acta Part A 58, 2533 (2002)
28 A.G. Kjelaas, P.E. Nordal, A. Bjerkestrand, Appl. Opt. 17, 277 (1978) 29 W. Armerding, A. Herbert, M. Spiekermann, J. Walter, F. Comes, Fast
scanning laser DOAS, an ultrasensitive technique for monitoring tro-pospheric trace gases. In: Monitoring of gaseous pollutants by tunable diode lasers (Kluver Academic, Freiburg Germany 1991)
30 E. Normand, M. McCulloc, G. Duxbury, N. Langford, Opt. Lett. 28, 16 (2003)
31 J. Malicet, D. Daumont, J. Charbonnier, C. Parisse, A. Chakir, J. Brion, J. Atm. Chem. 21, 263 (1995)
32 http://cfa-www.harvard.edu/hitran/
33 L.S. Rothman, A. Barbe, D. Benner, L. Brown, C. Camy-Peyret, M. Car-leer, K. Chance, C. Clerbaux, V. Dana, V. Devi, A. Fayt, J. Flaud, R. Gamache, A. Goldman, D. Jacquemart, K. Jucks, W. Lafferty, J. Mandin, S. Massie, V. Nemtchinov, D. Newnham, A. Perrin, C. Rins-land, J. Schroeder, K. Smith, M. Smith, K. Tang, R. Toth, J. Vander Auwera, P. Varanasi, K. Yoshino, J. Quantum Spectrosc. Radiat.Transfer 82, 5 (2003)