HAL Id: hal-02296690
https://hal.archives-ouvertes.fr/hal-02296690
Submitted on 26 Feb 2021HAL is a multi-disciplinary open access
archive for the deposit and dissemination of sci-entific research documents, whether they are pub-lished or not. The documents may come from teaching and research institutions in France or abroad, or from public or private research centers.
L’archive ouverte pluridisciplinaire HAL, est destinée au dépôt et à la diffusion de documents scientifiques de niveau recherche, publiés ou non, émanant des établissements d’enseignement et de recherche français ou étrangers, des laboratoires publics ou privés.
Contribution of dental tissues to sex determination in
modern human populations
Cecilia García-campos, María Martinón-torres, Laura Martín-francés, Marina
Martínez de Pinillos, Mario Modesto-mata, Bernardo Perea-pérez, Clément
Zanolli, Elena Labajo González, José Antonio Sánchez Sánchez, Elena Ruiz
Mediavilla, et al.
To cite this version:
Cecilia García-campos, María Martinón-torres, Laura Martín-francés, Marina Martínez de Pinillos, Mario Modesto-mata, et al.. Contribution of dental tissues to sex determination in modern hu-man populations. American Journal of Physical Anthropology, Wiley, 2018, 166 (2), pp.459-472. �10.1002/ajpa.23447�. �hal-02296690�
Contribution of dental tissues to sex determination in modern human populations
Cecilia García‐Campos, María Martinón‐Torres, Laura Martín‐Francés, Marina Martínez de Pinillos, Mario Modesto‐Mata, Bernardo Perea‐Pérez, Clément Zanolli, Elena Labajo Gonzalez, Jose Antonio Sanchez Sanchez, Elena Ruiz Mediavilla, Claudio Tuniz, Jose María Bermudez de Castro
Funding information: Dirección General de Investigación of the Spanish Ministerio de Economía y Competitividad (MINECO/FEDER), Grant Number: CGL2015‐65387‐C3‐1, 3‐P; Consejería de Cultura y Turismo of the Junta de Castilla y León; The European Social Fund; Fundación Atapuerca; The Leakey Foundation
Abstract
Objectives
Accurate sex estimation is an essential step for the reconstruction of the biological profile of human remains. Earlier studies have shown that elements of the human permanent dentition are sexually dimorphic. The aims of this study are to determine the degree of sexual dimorphism in the dental tissue volumes and surface areas of mandibular canines and to explore its potential for reliable sex
determination. Method
The teeth included in this study (n = 69) were selected from anthropological collections from Spain, South Africa and Sudan. In all cases, the sex of the individuals was known. The teeth were scanned and three‐dimensional (3D) measurements (volumes and surfaces areas) were obtained. Finally, a
dsicriminant function analysis was applied. Results
Our results showed that sexual dimorphism in canine size is due to males having greater amounts of dentine, whereas enamel volume does not contribute significantly to overall tooth size dimorphism. Classification accuracy of the multivariable equations tested on slightly worn teeth ranged from 78 to 90.2% for the crossvalidation, and from 71.43 to 84.62% for the hold‐out sample validation. When all functions were applied together, the sex was correctly assigned 92.30% of the time.
Conclusions
Our results suggest that the 3D variables from mandibular canine dental tissues are useful for sex determination as they present a high degree of dimorphism. The results obtained show the importance
of 3D dental tissue measurements as a methodology in sex determination, which application should be considered as a supplemental method to others.
1 INTRODUCTION
Determination of sex is an important aspect in forensic research, since accurate sex determination is one of the most important steps in the reconstruction of the biological profiles of human
remains. Both archaeology and palaeoanthropology have also shown interest in this issue, not only to reconstruct ancient population demographic profiles, but because the variables
traditionally used to determine sex have also been used to determine hominin taxonomy
(Olejniczak et al., 2008a; Smith et al., 2012). On the other hand, sexual dimorphism studies also provide information about the life history, the evolution and behavior of a specific population and, as a result, of individuals (Alt, Rösing, & Teschler‐Nicola, 1998; Lee Greene, 1991). In recent years, forensic specialists have developed different techniques to discriminate males from females since these allow them to exclude approximately half of the population during the identification processes. The pelvis has been long considered the most reliable skeletal remain for sex determination, on certain occasions with correct sexual diagnosis rates above 95%
(Ferembach et al., 1980; Iscan and Derrick, 1984; Luo, 1995). In addition, craniofacial and mandibular features have also shown high accuracy (Ferembach et al., 1980; Hu, Koh, Han, Shin, & Kim, 2006; Williams and Rogers, 2006). However, the tendency of these bones to break down following deposition may complicate their assessment, particularly in the context of mass
fatalities or catastrophic events, where these bones rarely appear complete. In this context, teeth provided a good alternative. Because of their chemical composition and the protection within the framework of the oral cavity, these anatomical structures are the best‐preserved human remains. Therefore, teeth can be considered useful research elements for such scenarios since there is a greater probability to recover them intact from skeletonized remains, and they take prominence when other skeletal parameters are unavailable.
Several researchers agree that the human permanent dentition is sexually dimorphic (Feeney et al., 2010; Harris, Hicks, & Barcroft, 2001; Hillson, 1996; Saunders, Chan, Kahlon, Kluge, & FitzGerald, 2007; Schwartz and Dean, 2005; Stroud, Buschang, & Goaz, 1994; Zilberman and Smith, 2001). In most contemporary human populations, males have larger teeth than females (Alvesalo, 1971; Garn, Lewis, & Kerewsky, 1964; Harris and Bailit, 1988; Harris et al., 2001; Işcan and Kedici, 2003; Peckmann et al., 2015), exhibiting the canine teeth the highest degree of dimorphism among the different tooth classes (Acharya, Angadi, Prabhu, & Nagnur, 2011; Acharya and Mainali, 2007; Garn, Lewis, & Kerewsky, 1967; Hillson, 1996; Lund and
Mörnstad, 1999; Rao, Rao, Pai, & Kotian, 1989; Schwartz and Dean, 2005). Mandibular canines are particularly interesting in sex determination of unidentified remains, since they are more resistant to periodontal disease and to severe trauma (Roetzscher, 2013; Nelson, 2014), which increases their chances of being recovered in a good state of preservations. For this reason, several researchers have employed mandibular canines to assess sex differences in size from samples of various geographic regions and diverse population groups (Hillson, 1996; Işcan and Kedici, 2003; Moorrees, Kai‐Jen Yen, Moorrees, & Thomsen, 1957; Peckmann et al., 2015). In recent years, multivariate statistics, in general, and discriminant function analysis, in particular, have been explored with this objective in mind. Discriminant functions have successfully determined sex by using a combination of tooth sizes and root lengths (Garn, Van Alstine, & Cole, 1978), by using the ratio between canine width and intercanine distance (Rao et al., 1989), or by obtaining diagonal tooth measurements (Cardoso, 2010; Karaman, 2006; Peckmann et al., 2015; Zorba et al., 2012).
Moreover, other researchers have observed that dental tissue proportions in the permanent dentition also differ significantly between males and females (Feeney et al., 2010; Harris and Hicks, 1998a; Saunders et al., 2007; Schwartz and Dean, 2005; Stroud et al., 1994; Zilberman and Smith, 2001). Various studies support this idea, suggesting that dental tissue development is influenced by sex‐linked genes (Alvesalo, 1997; Alvesalo and Portin, 1980; Alvesalo,
Tammisalo, & Hakola, 1985; Guatelli‐Steinberg, Sciulli, & Betsinger, 2008; Pentinpuro,
Pesonen, Alvesalo, & Lähdesmäki, 2017; Zilberman and Smith, 2001), which, in turn, to a certain extent, determines the amount of enamel and dentine contribution to total crown size. Crown tissue components have commonly been studied by looking at the two‐dimensional physical cross‐sections and X‐ray projection radiographs of molars (Grine, 2005; Macho and
Berner, 1993; Martin, 1983; Schwartz and Dean, 2005; Stroud et al., 1994) whereas data on anterior teeth, and in particular on canines, are limited (Feeney et al., 2010; Saunders et al., 2007; Schwartz and Dean, 2005). Some of these studies have identified a thicker enamel in female crowns was as the signal of sexual dimorphism (Alvesalo, Tammisalo, & Therman, 1987; Moss and Moss‐Salentijn, 1977; Schwartz and Dean, 2005). However, other authors have pointed to variations in the amount of dentine as the main reason behind these differences between the sexes (Harris and Hicks, 1998b; Stroud et al., 1994). The emergence of new techniques and
On one hand, microtomographic techniques are considered more accurate than conventional radiographic techniques since they allow for standardized measurement planes (Grine, Stevens, & Jungers, 2001; Olejniczak and Grine, 2006). The anatomy of canine teeth makes it difficult to define the bucco‐lingual plane traditionally used in this kind of studies, in whose obtaining process small variations in the plane of orientation can result in large changes in tissue
measurements values. This problem especially arises when physical cross‐sections are used, in which it is difficult to locate the dentine horn before the tooth is cut. On the other hand, micro‐CT does not require the partial destruction of the tooth, which makes easier to obtain accurate and wide enough samples for statistical comparisons (Grine, 2005; Macho and Berner, 1993;
Olejniczak and Grine, 2006; Saunders et al., 2007; Schwartz, 2000; Smith, Olejniczak, Martin, & Reid, 2005; Smith, Olejniczak, Reid, Ferrell, & Hublin, 2006; Smith et al., 2008). In summary, the application of micro‐CT to anthropological samples allows us to reconstruct both the external and internal structures of teeth in a nondestructive manner, as well as the virtual separation, and volumes and surfaces measurement, of the different dental tissues with great precision.
In the present study, we have focused on the microtomographic volumetric measurement of dental tissue proportions of mandibular canines, variables which have not been previously assessed in this tooth class, despite their potential relevance in the study of sexual dimorphism. Therefore, the aims of this study are to: (1) determine the degree of sexual dimorphism in the dental tissue volumes and surfaces areas of mandibular canines; and (2) explore its potential for reliable sex determination through the application of discriminant function analysis. In addition, we also assessed the traditional two‐dimensional (2D) variables of dental tissue components of the crown, whose results were contrasted against those obtained from previous ones (Feeney et al., 2010; Saunders et al., 2007; Schwartz and Dean, 2005). Moreover, we assessed the
discrepancies between volumetric results and 2D measurements, which have been already
reported in literature in other tooth classes (Benazzi et al., 2014; Olejniczak et al., 2008b, 2008a).
2 MATERIALS AND METHODS 2.1 Sample
The teeth studied here derive from 69 individuals (33 females and 36 males) of known sex and age (Table 1) of different geographic origin. A part of the sample was selected from the
sample includes 84 skeletons (24 females, 60 males) all individuals are adults aged between 20 and 55 years. The skeletons belong to individuals originating from of different regions of Spain, all born during the first half of the 20th century. In addition, our sample also includes canines from the South African modern human the Pretoria Bone Collection, permanently stored at the University of Pretoria (L'Abbé, Loots, & Meiring, 2005). This collection comprises 139 adult individuals (23 females and 116 males) aged between 22 and 76 years. Finally, mandibular canines extracted at dental clinics in Sudan were also included. Information on the Sudanese collection can be found in Elamin and Liversidge (2013). In the present study only one antimere per individual was included for analysis.
Table 1. Distribution of the sample by sex, origin and degree of wear (Molnar, 1971)
European African Total
Wear Female Male Female Male Female Male
<3 9 13 16 16 25 29
>3 5 5 3 2 8 7
TOTAL – – – – 33 36
A total of 54 mandibular canines (25 females and 29 males) showing a degree of wear smaller than three (Molnar, 1971) were selected, in which the different variables were measured. Category three is characterized by the obliteration of the apex at the incisal border and the
presence of a dentine point instead. Moreover, from this sample two subsamples were created for statistical purposes. On one hand, 41 slightly worn teeth were used to create the discriminant functions, whereas, 13 teeth were used as a hold‐out sample. Additionally, in order to assess the accuracy of the equations on extensively worn teeth, we also included another sub‐sample of 15 teeth showing a higher degree of wear. This last sample included teeth with minimal dentine patch (degree of wear four) and with a more extensive dentine patch (degree of wear five). In no case was lateral enamel loss observed on the occlusal surface.
2.2 Micro‐CT image acquisition
The Spanish and Sudanese specimens were scanned in two facilities. One part of the sample was scanned using a Phoenix v/tome/x s (GE Measurement & Control) microtomographic system housed in the Microscopy Laboratory of the Centro Nacional de Investigación sobre la Evolución Humana (CENIEH) in Burgos (Spain). The rest of the sample was scanned using the CTP‐Mlab microCT located in the Multidisciplinary Laboratory of the International Centre for Theoretical Physics (ICTP) of Trieste (Italy) (Tuniz et al., 2013). All scans were performed with two 0.1‐mm Copper filters, 100–120 kV voltage and 110–140 µA amperage. The output images had a voxels size ranging between 17 and 21 µm. The South African specimens were scanned at the South African Nuclear Energy Corporation (Necsa), Pelindaba, using Nikon XTH 225 ST equipment, with the following parameters: 100 kV voltage and 100 µA amperage. The final volumes were reconstructed with an isotropic voxel size ranging between 40.8 and 50.8 µm. The subsequent image processing of each of the teeth was performed using Amira 6.0.0 software (Visage Imaging, Inc.).
2.3 Three‐dimensional model generation and dental tissue measurements
Dental tissues (enamel, dentine‐pulp complex) were semiautomatically segmented using the watershed segmentation tool and through manual editing. A non‐local means filter was also applied. Small fractures and cracks were virtually filled in.
We followed the criterion put forward by Benazzi et al. (2014) for the tissue components isolation, considering the cervical line as the fundamental morphological feature to isolate the crown from the root. However, in contrast to the protocol proposed by these authors, the
separation of both structures was made by hand as described below. First, each tooth was placed in its correct anatomical position (Figure 1a,c). Then, using the mesio‐distal plane, we drew a straight line between the enamel maximum cervical extensions in the entire images stack (Figure 1b). Finally, we corrected the tissue assignment in the bucco‐lingual plane in order to create a continuous curve line (Figure 1d). In this way, only the dentine contained in the enamel cap (Figure 1a) was considered as coronal dentine (Figure 1b), which was limited on the base by a homogeneous and smooth curve (Figure 1c) and isolated from the root (Figure 1d).
Figure 1. Crown isolation. Canine in its correct anatomical position: lingual view (a), mesial view (c). Line which defines the lower limit of the crown in a mesio‐distal plane (b), and in a bucco‐ lingual plane (d). Isolated volumes: enamel cap (a), and coronal dentine and pulp complex (b), which was limited on the base by a curve with a smooth surface (c) and the root volume (d)
Lastly, 3D tissue measurements were obtained using Amira 6.0.0 software. We examined the crown variables and indices previously described by Kono (2004), Olejniczak et al. (2008b,b), and Skinner, Gunz, Wood, & Hublin, (2008a); Skinner et al. (2008b). The basal surface of the crown (BS), the root volume (Vr) and the total tooth volume (Vt) were also considered. For detailed explanations of the variables used in this study refer to Table 2. We did not reconstruct the different tissues in worn canines due to the lack of a standardized protocol in the 3D
literature.
Table 2. Definition of the three‐dimensional measurements and associated indices used in this study
Measurements Abbreviation Complete definition Dimension
The volume of the enamel cap
Ve The volume of the crown bounded by the outer enamel and the enamel–dentine junction (EDJ surface).
mm3
Coronal dentine and pulp volume
Vcdp The volume of the coronal dentine, including the coronal aspect of the pulp chamber.
mm3
EDJ surface area EDJS The enamel‐dentine junction surface. mm2
Outer enamel surface area
OES The outer surface of the enamel cap. mm2
Basal surface area BS The crown basal surface. mm2
The total crown volume
Vc The total crown volume, including enamel, dentine, and pulp.
Measurements Abbreviation Complete definition Dimension
The total root volume
Vr The volume enclosed by the basal crown surface and the root apex.
mm3
The total tooth volume
Vt The volume of the whole tooth. mm3
The total dentine and pulp volume
Vtdp The volume of the total dentine, including the pulp.
mm3
3D Average enamel Thickness
3DAET This is the average straight‐line distance between the EDJ and the outer enamel surface, calculated as the quotient of the enamel
volume and EDJ surface area (Ve/ EDJS).
mm
3D Relative enamel cap area
3DRET Ratio that express the 3D average enamel thickness as a percentage of the square root of coronal dentine and pulp volume. [(3D
AET/ )x100]
Scale free
Relative coronal dentine and pulp volume
Vcdp/Vc The percent of coronal volume that is dentine and pulp. [(Vcdp/Vc)x100]
Percentage scale
Relative coronal volume
Vc/Vt Ratio between the crown volume and the total tooth volume. [(Vc/Vt)x100] Percentage scale Relative outer enamel complexity
OES/EDJS Ratio between the outer enamel surface and the total enamel‐dentine junction surface. [OES/EDJS]
Scale free
To assess the histological crown area from a bucco‐lingual plane, a virtual cross‐section for each tooth was obtained following the methodology outlined in Benazzi et al. (2014), which introduces modifications to the previous protocol developed by Feeney et al. (2010). The bucco‐lingual plane here passes through two points located on the widest bucco‐lingual bi‐cervical diameter (typically the maximum cervical enamel extensions) and the dentine horn tip. To isolate the crown from the root, the line between the buccal and lingual cervical margins was determined as the lower limit of the crown section (Figure 2b). As some canines presented occlusal wear, crown reconstruction was carried out using open‐source software (GIMP 2.8) and following the protocol proposed by (Saunders et al., 2007) (Figure 2c). Finally, 2D tissue measurements were obtained using ImageJ software (v. 1.49i).
Figure 2. (a) Mesial view of the individual UCM_20 lower canine. (b) The virtual cross‐sections were obtained following the method of Benazzi et al. (2014) and the crown reconstruction (c) was performed by applying the Saunders et al. (2007) methodology
The definitions of the 2D metrics and indices used in this study are presented in Table 3. We measured the variables in the bucco‐lingual plane described by (Martin, 1985), and followed the protocols described by (Feeney et al., 2010).
Table 3. Definition of the two‐dimensional measurements from the crown and associated indices used in this study
Metrics Abbreviation Complete definition Dimension
Enamel cap area c The area of the crown bounded by the outer enamel perimeter and the EDJ.
mm2
Coronal dentine and pulp area
b The area enclosed by the enamel–dentine junction (EDJ) and a straight line drawn between the buccal and lingual cervical margins.
mm2
Area of the entire crown section
a The area of the crown bounded by the outer enamel perimeter and a straight line between the buccal and lingual cervical margins.
mm2
Length of the EDJ e The linear distance of the line separating the enamel cap area from the dentine and pulp area above the cervical margin.
mm
Bicervical diameter
BCD The linear distance between the buccal and lingual cervical margins measured in the cross‐section.
mm
Average enamel thickness
2DAET The area of the enamel cap divided by the length of the EDJ. (c/e)
mm
Relative enamel cap area
2DRET Index that express the average enamel
thickness as a percentage of the square root of
dentine area. [(AET/ ) × 100]
Scale free
Relative coronal dentine and pulp area
b/a The percent of coronal area that is dentine and pulp. [(b/a) × 100]
Percentage scale
2.5 Statistical analysis
Statistical analyses were performed using SPSS software (v. 18.0, SPSS Science). First, standard descriptive statistics were calculated for each variable. The normal distribution was assessed using the Kolmogorov–Smirnov one‐sample test. Levene's Test was then used to confirm the equal variance assumption. An Analysis of Variance (ANOVA) was employed to examine the possible differences between males and females. Additionally, the Analysis of Covariance (ANCOVA) was used. ANCOVA can be compared with ANOVA, but has the added feature that for each group, variance that can be explained by a specified covariate of interest can be
removed. In this particular case we controlled for the effect of size (the area of the entire crown section in the two‐dimensional approach; and whole tooth volume in three‐dimensional one). Means were determined to be significantly different at α = 0.05 level. A discriminant function analysis was performed to generate a set of univariate and multivariate functions from three‐ dimensional data belonging to a subsample of 41 slightly worn teeth (20 females, 21 males). We suspect this technique could be especially useful in the sexing of fragmentary skeletal remains, which is why we attempted to minimize the number of dental variables needed. We created a function for each variable and indices (D1–D4) and for all of them combined (D5). Additionally, we generated multivariant equations using the Lambda Wilks stepwise variable selection using all the variables and indices (D6) as well as only the variables and indices from the crown (D7). The stepwise discriminant function analysis calculates the optimal combination of variables and weights them to reflect their overall contribution to sex determination. Discriminant function scores were calculated using the raw coefficients multiplied by the corresponding dental
dimensions plus the constant. The resulting score was compared with the sectioning point. If the score was greater than the sectioning point, the sex was determined to be male.
Finally, the discriminant functions were tested in the original sample and the leave‐one‐out method was chosen to calculate the cross‐validation error index. The percentage of correct allocation accuracy in determining sex using the equations developed was also calculated for the hold‐out sample: females and males separately, and for the whole of the sample, as well as for slightly worn and extensively worn teeth separately. Only the equations with high percentage correct assignments were selected and included in this study.
To estimate the interobserver error, a subsample of seven teeth were analyzed by two authors (CGC and MMM). Each tooth was measured three times by both researchers, who orientated, segmented and isolated the crown of each tooth, as well as, following the 2D and 3D methods of measurement described above, quantified each variable and index in an independent manner. The degree of error was assessed by calculating the inter‐ and intra‐observer mean differences for each crown component measurement. The average intraobserver error for 2D measurements was 1.71% (0.60–2.81%), whereas the average interobserver error was 1.58% (0.85–2.31%).
Moreover, the average intra‐observer error for 3D measurements was 1.59% (0.69–2.48%), whereas the average inter‐observer error was 2.43% (1.72–3.15%). All values are within the accepted range.
3 RESULTS
3.1 Intrapopulation variability: Three‐dimensional measurements
Descriptive statistics for the variables measured on each mandibular canine are provided in Table 4. Only the values from the lesser worn teeth (wear stage 3 or less) were used in the descriptive analysis and means comparisons (n = 54), excluding the variables total root volume (Vr) and basal surface (BS), which are not affected by wear. In these cases, we used the total sample (n = 69).
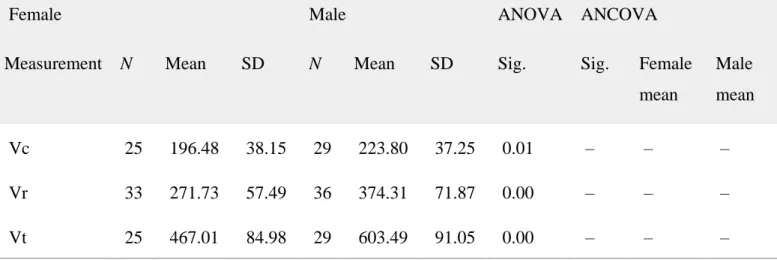
Table 4. Descriptive statistics, analysis of variance (ANOVA), and analysis of covariance (ANCOVA) results of the three‐dimensional variables measured in slightly worn mandibular canines
Female Male ANOVA ANCOVA
Measurement N Mean SD N Mean SD Sig. Sig. Female mean Male mean Vc 25 196.48 38.15 29 223.80 37.25 0.01 – – – Vr 33 271.73 57.49 36 374.31 71.87 0.00 – – – Vt 25 467.01 84.98 29 603.49 91.05 0.00 – – –
Female Male ANOVA ANCOVA
Measurement N Mean SD N Mean SD Sig. Sig. Female mean Male mean Ve 25 93.44 18.89 29 99.24 22.11 0.31 0.00 106.84 87.69 Vcdp 25 103.03 22.43 29 124.56 20.37 0.00 0.49 116.43 113.01 EDJS 25 111.09 12.38 29 130.34 14.15 0.00 0.25 119.54 123.06 OES 25 162.72 19.68 29 180.77 20.88 0.00 0.02 177.20 168.29 BS 33 33.04 4.51 36 41.20 5.64 0.00 0.02 36.61 39.11 Vtdp 25 382.86 63.95 29 516.05 76.03 0.00 0.00 433.46 452.62 Index Vc/Vt 25 42.23 4.21 29 37.13 3.17 0.00 – – – 3DAET 25 0.84 0.12 29 0.76 0.14 0.04 – – – 3DRET 25 17.99 2.38 29 15.30 3.04 0.00 – – – Vcdp/Vc 25 52.36 3.68 29 55.90 4.96 0.00 – – – OES/EDJS 25 1.46 0.07 29 1.39 0.08 0.00 – – – Extensively worn teeth were also used in the case of Vr and BS.
Dimensions in millimeters. Significant p values in bold.
The Kolmogorov‐Smirnov test showed that all dimensions were normally distributed within each sex category. The results of the homogeneity of variance test indicate that the sample is
statistically homogeneous for all dimensions and indices. All tooth dimensions were larger in males and the ANOVA showed that, except for the volume of the enamel cap (Ve), the eight direct variables measured were statistically larger for this sex (Table 4).
In light of these results, we hypothesized that size differences could be masking those possibly present in other variables. Therefore, a covariance analysis (ANCOVA) was applied in order to control for the effects of size (Vt) (Table 4). Although the Ve mean for both groups was
statistically similar (ANOVA) the ANCOVA results revealed that, when we controlled for size, females had significantly larger Ve than males (female mean: 106.84 mm3; male mean: 87.69 mm3). These results were corroborated by the 3DAET and 3DRET results, the values of which were also significantly larger in females. In the same way, the ANCOVA showed that, when controlling for the effects of size (Vt), females have significantly larger outer enamel surface area (OES) than males, but a similar EDJ surface area (EDJS), which agrees with the significantly larger values of the OES/EDJS index for this sex. Our results also showed that males have absolute (Vcdp and Vtdp ANOVA results) and proportionally (Vcdp/Vc ANOVA results) larger dentine‐pulp complex volume than females. However, although ANCOVA results showed that the total dentine and pulp volume (Vtdp) was larger in males, in the crown it was similar in both sexes (Vcdp ANCOVA results).
3.2 Intrapopulation variability: Two‐dimensional measurements
To determine intrapopulation variability in 2D crown tissue components, a subsample of 54 slightly worn canines were used. The results of the statistical analysis are presented in Table 5.
Table 5. Descriptive statistics, analysis of variance (ANOVA), and analysis of covariance (ANCOVA) results of the two‐dimensional variables measured in slightly worn mandibular canines
Female Male ANOVA ANCOVA
Measurement N Mean SD N Mean SD Sig. Sig. Female mean Male mean c 25 14.92 2.70 29 15.21 2.70 0.70 0.01 15.96 14.27 b 25 35.44 4.67 29 41.96 5.83 0.00 0.02 38.09 39.60 a 25 50.36 6.69 29 57.17 7.30 0.00 – – –
Female Male ANOVA ANCOVA
Measurement N Mean SD N Mean SD Sig. Sig. Female mean Male mean e 25 19.93 1.34 29 21.72 1.75 0.00 0.09 20.61 21.12 BCD 25 7.02 0.43 29 7.69 0.54 0.00 0.00 7.20 7.54 Index 2DAET 25 0.75 0.12 29 0.70 0.11 0.14 – – – 2DRET 25 12.61 2.01 29 10.90 1.91 0.00 – – – b/a 25 70.44 3.05 29 73.36 3.55 0.00 – – – Dimensions in millimeters. Significant p values in bold.
The Kolmogorov‐Smirnov test showed that all dimensions were normally distributed within each sex category. The results of homogeneity of variance test indicate that the sample is statistically homogeneous for all dimensions and indices. Once again, ANOVA showed that all crown dimensions (b, a, e, BCD) were significantly larger in males, except in the enamel cap area (c) which was similar in both sexes. Our results indicated not only that the lower canines of males had larger crowns than females (a), but also that they were wider buccolingually (BCD). On the other hand, the comparison of the mean values of the enamel thickness indices revealed that, even though the average enamel thickness (2DAET) do not differ significantly, the relative enamel cap area (2DRET) does (p value = .002), being thicker in females.
As well as the 3D analysis, when we subsequently carried out the ANCOVA test, monitoring for the effect of size (a), significant differences were found in the enamel cap area, being greater in females than in males (ANCOVA estimated means: females 15.964 mm2; males 14.272 mm2). The ANCOVA results also corroborated those obtained from the ANOVA focusing on the coronal dentine and pulp area (b) and bicervical diameter (BCD), which showed that males had significantly greater values for both variables (Table 5). The relative dentine and pulp area (b/a) values are in agreement with this result, revealing a smaller dentine‐pulp complex in females
(ANOVA). In contrast, differences in EDJ length disappeared when the effect of size was controlled for.
3.3 Discriminant functions
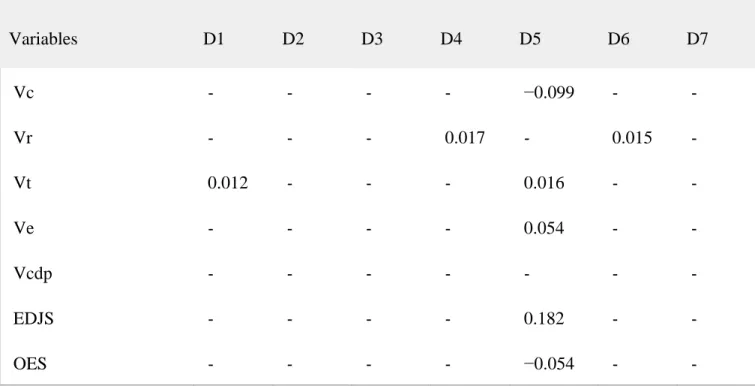
Table 6 presents the unstandardized discriminant function coefficients, constants, sectioning points and the main statistics values obtained from discriminant function analysis. To provide a discriminant function model applicable to the different preservation conditions of dental remains, several techniques were developed. Through different univariate discriminant analyses we
obtained four functions with high percentages of correct determinations. These functions used the following variables: total tooth volume (D1), total dentine and pulp volume (D2), basal surface (D3) and total root volume (D4). Additionally, we also carried out a multivariate analysis using all the variables and associated indices measured (D5). We also created multivariate equations using the Lambda Wilks stepwise variable selection using all the variables and indices (D6) and only with variables and indices from the crown (D7). All functions were statistically significant in the discrimination between groups (F value, p < .01).
Table 6. Discriminant function analysis results for a sub‐sample of slightly worn mandibular canines (n=41). Unstandardized Coefficients Variables D1 D2 D3 D4 D5 D6 D7 Vc ‐ ‐ ‐ ‐ −0.099 ‐ ‐ Vr ‐ ‐ ‐ 0.017 ‐ 0.015 ‐ Vt 0.012 ‐ ‐ ‐ 0.016 ‐ ‐ Ve ‐ ‐ ‐ ‐ 0.054 ‐ ‐ Vcdp ‐ ‐ ‐ ‐ ‐ ‐ ‐ EDJS ‐ ‐ ‐ ‐ 0.182 ‐ ‐ OES ‐ ‐ ‐ ‐ −0.054 ‐ ‐
Unstandardized Coefficients Variables D1 D2 D3 D4 D5 D6 D7 BS ‐ ‐ 0.223 ‐ ‐ ‐ 0.209 Vtdp ‐ 0.014 ‐ ‐ ‐ ‐ ‐ Vc/Vt ‐ ‐ ‐ ‐ 0.054 ‐ ‐ 3DAET ‐ ‐ ‐ ‐ 15.640 ‐ −3.899 3DRET ‐ ‐ ‐ ‐ −0.276 ‐ ‐ 3DRDA ‐ ‐ ‐ ‐ 0.259 ‐ ‐ OES/EDJS ‐ ‐ ‐ ‐ ‐ −8.836 ‐ Constant −6.356 −6.260 −8.511 −5.668 −29.771 7.668 −4.871 Sectioning point (S.P.) 0.000 0.000 0.000 0.000 0.000 0.000 0.000 Eigenvalue 0.711 0.952 0.961 0.987 1.803 1.588 1.263 Can.Corre. 0.644 0.698 0.700 0.703 0.802 0.783 0.747 Wilk´s Lambda 0.585 0.512 0.510 0.506 0.357 0.386 0.442 F value (Sig.) 0.000 0.000 0.000 0.000 0.000 0.000 0.000
Significant P‐values in bold.
Table 7 shows the accuracy of classification of each of the functions. The percentage of correct determinations for univariate functions ranged between 80.50% and 87.80% for the original sample, between 78% and 87.80% for the cross‐validated data, and between 76.92% and 92.32% for the hold‐out sample validation using slightly worn teeth. On the other hand, multivariate equations had a classification accuracy which ranged between 80.20% and 95.10% for the
original sample, between 85.40 and 90.20% for the crossvalidated data, and between 76.92% and 84.62% for the hold‐out sample validation using slightly worn teeth. The function with the
greatest correct sex allocation was D5. We also used the combination of the seven functions (D1– D7) in the hold‐out sample. When at least four of the outcomes indicated either “male” or
“female” the individual was assigned this specific sex. Using this methodology, we obtained 92.30% correct classifications in the slightly worn teeth. Overall, there were no large differences between the percentages of correct assignations from the original sample and those from the crossvalidation results. This indicates that the discriminant functions created classify the individuals accurately.
Table 7. Sex allocation accuracy (%) for each discriminant function generated from data collected in this study, tested on the original sample and using a cross‐validation
Tested on equations sample Tested on hold‐out sample
Original Cross‐validation Slightly worn teeth Widely worn teeth Discriminant
functions
Female Male Total Female Male Total Female Male Total Female Male Total
D1 80.00% 81.00% 80.50% 80.00% 76.20% 78.00% 80.00% 75.00% 76.92% 87.50% 57.14% 73.33% D2 85.00% 81.00% 82.90% 85.00% 81.00% 82.90% 100.00% 75.00% 84.61% 87.50% 71.43% 80.00% D3 90.00% 85.70% 87.80% 90.00% 85.70% 87.80% 100.00% 62.50% 76.92% 87.50% 42.86% 66.67% D4 85.00% 76.20% 80.50% 80.00% 76.20% 78.00% 100.00% 87.50% 92.31% 87.50% 71.43% 80.00% D5 100.00% 90.50% 95.10% 90.00% 81.00% 85.40% 100.00% 75.00% 84.62% 87.50% 71.43% 80.00% D6 95.00% 85.70% 80.20% 95.00% 85.70% 90.20% 100.00% 75.00% 84.61% 87.50% 54.14% 73.33% D7 90.00% 85.70% 87.80% 90.00% 85.70% 87.70% 80.00% 75.00% 76.92% 87.50% 57.14% 73.33% All combined – – – – – – 100.00% 87.50% 92.30% 87.50% 71.43% 80.00%
The functions were also tested on a hold‐out sample of slightly worn teeth and extensively worn teeth separately. D3 (based on basal surface) and D4 (based on root volume) functions were tested on the total hold‐out sample given these variables were not affected by wear.
Overall, in all discriminant functions females were classified more accurately than males. The percentage of correct determinations in the original sample ranges between 76.20% and 90.50% in the case of males, and between 80% and 100% in the case of females; the cross‐validation
ranged between 76.20% and 85.70% in the case of males and between 80% and 95% in the case of females; and the hold‐out sample validation (slightly worn teeth) ranged between 62.50% and 75% in the case of males and between 80% and 100% in the case of the females. The
combination of the results from the seven functions correctly classified 100% of the females, and 87.5% of the males.
The mean difference between the percentages of correct determinations in the hold‐out sample of slightly worn and extensively worn teeth was 9.64%. The allocation accuracy in the extensively worn teeth ranged between 73.33% and 80%, which is not very different to the results for slightly worn teeth. However, in this case the differences between males and females increased,
especially in the D1, D3, D6, and D7 functions, which raised doubt about their precision. Finally, the seven‐function combination had an 80% correct classification rate in the case of extensively worn teeth (87.50% females, 71.43% males).
4 DISCUSSION
4.1 Sexual dimorphism of dental tissue volumes and surface areas of mandibular canines Male mandibular canines have been found to be greater than those of females. Both their crown (a, Vc) and root (Vr, Vc/Vt) were larger and, therefore, the overall size of the tooth (Vt). These results are in agreement with those obtained in the literature on canine crown dimensions (mesiodistal and buccolingual widths) in modern humans (Acharya et al., 2011; Ateş, Karaman, Işcan, & Erdem, 2006; Peckmann et al., 2015; Pereira et al., 2010), as well as, they also support the conclusions reached by Zorba, Vanna, & Moraitis (2014) and Garn et al. (1978), who argued that root dimensions of canines offer a reliable method for determining sex. Although, most of researchers who have studied sexual dimorphism in teeth have pointed out the high dimorphism of canines (Acharya and Mainali, 2007; Acharya et al., 2011; Garn et al., 1967; Hillson, 1996; Lund and Mörnstad, 1999; Rao et al., 1989; Schwartz and Dean, 2005), a number of them have also observed differences in size of male and female premolars and molars (Prabhu and
Acharya, 2009; Viciano, López‐Lázaro, & Alemán, 2013; Zorba, Moraitis, & Manolis, 2011), and, to a lesser extent, in their incisors (Garn et al., 1964; Staka, Asllani‐Hoxha, &
Bimbashi, 2016). The existence of a noticeable sexual dimorphism in some permanent tooth dimensions have caused several authors to be interested in quantifying the level of sexual
dimorphism of deciduous teeth (Moorrees et al., 1957; Harris and Lease, 2005; Viciano et al., 2013), however, without achieving conclusive results.
On the other hand, the overall tooth size dimorphism has been interpreted as a consequence of differences in the amount of enamel and dentine between sexes. Most studies about dental tissue proportions of males and females have commonly been focused on the permanent posterior dentition. Even though some of these studies have found significant differences in the amount of enamel (Alvesalo et al., 1987; Moss and Moss‐Salentijn, 1977), it is becoming increasingly clear that sexual dimorphism of premolars and molars is due to the males' greater dentine dimensions, and that sex differences in enamel do not make a large contribution to overall tooth size
dimorphism (Harris and Hicks, 1998b; Smith et al., 2006; Stroud et al., 1994). Our results also support this hypothesis. From this study it was found that lower canines of males have absolutely (b, Vcdp, Vtdp) and relatively (b/a, Vcdp/Vc) more dentine than those of females, whereas females have been found to have relatively (3DAET, 3DRET, 2DRET), but not absolutely (c, Ve), more enamel than males. In the same way, EDJ length and surface are greater in males, likely because of the greater dentine dimensions.
In the light of these results, it seems clear that size is a factor to keep had in mind. The relative enamel thickness (RET) has been considered as the most appropriate index for interspecies comparison, where the size of each species' teeth must be taken into account (Martin, 1983). However, an increase in relative enamel thickness could correspond to a reduction in the amount of dentine (b, Vcdp), an increase in the average enamel cup thickness (2DAET, 3DAET) or both. This makes this index difficult to interpret in insolation, mainly when groups overlap as in the case of the intra‐species comparison outlined above (Smith et al., 2005). The same was true for the percentage of the coronal dimension represented by dentine and pulp (b/a, Vcdp/Vc).
Therefore, supplementary to the AET and RET (2D, 3D) indices, as well as to the relative coronal dentine and pulp dimensions (b/a, Vcdp/Vc), in this study statistical controls techniques, such as ANCOVA, were applied. Through the ANCOVA test, we have been able to assess the effect of size on the intra‐population variability of not only of the enamel cup (c, Ve), but also that of the other absolute variables considered. The ANCOVA results showed that differences in male and female variable means persisted in most of measurements even when tooth size was controlled. Surprisingly, only when we controlled for the effect of size were we able to appreciate that
females have greater enamel cap size (c, Ve) than males, which concur with the RET results (2D and 3D).
In addition to dental tissue volumes, we have also found it interesting to compare the outer‐ enamel (OES) and the enamel–dentine junction (EDJ) surface areas. The EDJ, which underlies the enamel cap, carries information about the original shape of the tooth crown. Previous studies have indicated that many features of the tooth crown originate at the EDJ prior to enamel
deposition (Skinner et al., 2008a,b). On the other hand, increases in the enamel thickness
(3DAET, 3DRET) could be related to increases in the enamel cap dimensions and/or decreases in the volume of the dentine and the enamel–dentine junction surface (Grine, 2005; Smith et
al., 2006). Our results showed that both surfaces, OES and EDJS, are significantly greater in males, but it was also found that males have larger canines, so these results could be more related to the differences in size than to the complexity of the surfaces. When we equated both groups' canines size (ANCOVA) we found that males and females have similar EDJ surface areas, but females have significantly wider OES, which is also reflected significantly in the OES/EDJS index (female mean: 1.46; male mean: 1.39). Therefore, a significantly greater absolute average (and/or relative) enamel thickness in females seems to be the result of an increase in enamel cap complexity rather than due to a decrease of dentine surface. These results were also reported for molars: Smith et al. (2006) showed that females often have a greater mean molar enamel cap surface area and it frequently contributes to greater enamel thickness. New Geometric
Morphometrics studies of the OES and the EDJ surface areas of canines could shed light on this issue.
4.2 The potential of dental tissue proportions for reliable sex determination
Our results allow for the identification of significant sex differences in the dental tissue volumes and surface areas of mandibular canines. They have also shown that these differences were large enough to determine the sex with a high percentage of accuracy. Overall, the accuracies obtained from the use of multiple variables equations were higher than those obtained using univariate functions. The percentage of correct determinations increased when we used all the functions together (92.30%). Nevertheless, in some forensic and archaeological contexts it may not be possible to measure all of the variables, therefore univariate functions may prove useful in these cases. The function with the greatest correct sex allocation was D5 (original: 95.10%; cross‐
validation: 85.40%; hold‐out sample validation on slightly worn teeth: 84.62%; and hold‐out sample validation on extensively worn teeth: 80.00%) which includes all the variables considered in this study.
According to the results obtained from this study, the accuracy rate of sex determination was higher for females than for males. Other studies based on the discriminant function analysis of the canine crown dimensions have also found that the classification accuracy was higher for females and lower for males (Ateş et al., 2006; Acharya and Mainali, 2007; Işcan and Kedici, 2003). Plavcan (2012) suggested that this might be due to the retention of certain vestigial features. Adult male primates exhibit two sexually mature morphotypes: whereas the dominant males achieve full body size, with the development of strong secondary sexual features, other males retain a subadult body form; nevertheless, females have a unique sexually mature morphotype. This leads to in a higher variability in male sexual features, which may make difficult their sexual allocation, reinforcing Işcan's and Kedici's observation that “The difficulty or the lack of dimorphism comes from male subjects” (2003, p 1).
Finally, the percentage of correct assignment of sex in the extensively worn sample only decreased to 9.64% compared to the slightly worn sample; nevertheless, in this case the correct assignment differences between males and females increased, which made us doubt their precision when the wear increased.
4.3 Traditional 2D variables of dental tissue components and their utility in sexual dimorphism assessment
The few studies in literature which have assessed the dental tissue proportion variation in canine teeth includes 2D analysis based on physical sections (Saunders et al., 2007; Schwartz and Dean, 2005) and 2D analysis of virtual sections obtained from microtomographic 3D models (Feeney et al., 2010). Although these researchers have observed dental tissue patterns similar to those described in this study, it is worth highlighting the low homogeneity in the results obtained by the different research approaches, including the present one. Our 2D analysis results concur with those obtained by Saunders et al. (2007) when analyzing the physical sections of mandibular canines. However, Schwartz and Dean (2005), applying the same technique as Saunders et al. (2007), concluded that female mandibular canines have a significantly greater average and relative enamel thickness than those of males due to their larger enamel caps and smaller dentine
areas. Nevertheless, statistically significant differences were not found in any of the absolute measurements considered. More recently, making use of microtomographic virtual images, Feeney et al. (2010) assessed the dental tissue areas of canine and premolars longitudinal planes. These authors found that males have significantly greater values than females in terms of the dentine area and EDJ length in the maxillary canines, but, like Schwartz and Dean (2005), no significant differences were noted for the mandibular ones.
The discrepancies between the different studies results might have a methodological origin. Despite our results of the 2D and 3D analysis of the crown tissue components have ended up being similar, three‐dimensional measurements have been considered as a more precise way to evaluate tissue proportions since they counteract the effect of dimensional loss suffered by classic 2D estimations (Benazzi et al., 2014; Feeney, 2009; Molnar, Hildebolt, Molnar, Radovcic, & Gravier, 1993; Shellis, Beynon, Reid, & Hiiemae, 1998). Our study reveals that when only 2D variables from the crown are considered (Feeney et al., 2010; Saunders et al., 2007; Schwartz and Dean, 2005) some measurements are overestimated or underestimated (Figure 3). Olejniczak et al. (2008a, 2008b) also noted differences in dental tissue patterns based on 2D and 3D data when they compared molars from different hominins species, likewise Benazzi et al. (2014) observed similar differences when assessed the 2D and 3D measurements in modern human premolars, canines, and incisors. Additionally to the loss of one dimension, we also have to consider that physical cross‐sections techniques, like those applied by Schwartz and Dean (2005) and Saunders et al. (2007), do not allow obtaining a bucco‐lingual plane in an accurate manner, since it is not possible to locate the dentine horn before the tooth is cut. The anatomy of canine teeth makes that small variations in this plane may lead to important change in the measurements, which could explain the discrepancies in literature. Therefore, the above makes us conclude that, as enamel thickness distribution is not homogenously distributed in the crown, the conventional 2D measurements in the bucco‐lingual ideal section planes may not be a reliable estimator of 3D whole‐crown variability, as they do not adequately capture the morphology of the entire tooth. Future research of 3D dental tissue proportions may support the sexual distinctive patterns observed in this study.
Figure 3. Percentage of the crown which is enamel (light grey) and dentine and pulp complex (dark grey) based on the 2D (1) and 3D (2) results obtained in the present study, for females (a) and males (b)
4.4 Broader implications of dental tissue proportions in dental sexual dimorphism
Although it is unclear which genetic mechanisms are at play, and the processes by which sexual hormones influence dental tissue formation, there are numerous studies which support the idea that both factors could be the cause of the dental tissue dimorphism previously described. The extensive literature on the enamel and dentin patterns of the permanent dentition belonging to
individuals with sex chromosome abnormalities, suggests the existence of a genetic influence of sex‐linked genes on both dental hard tissues and overall tooth size (Alvesalo, 2009; Alvesalo and Tammisalo, 1981; Alvesalo, Tammisalo, & Townsend, 1991; Alvesalo et al., 1985, 1987;
Pentinpuro, Lähdesmäki, Niinimaa, Pesonen, & Alvesalo, 2014; Pentinpuro et al., 2017;
Zilberman, Smith, & Alvesalo, 2000).Whereas Y chromosome linked genes seem to increase the mitotic activity within the dental lamina (Alvesalo, 1997), X chromosome appears to be able to influence on the enamel growth (Alvesalo et al., 1991). These studies did not employ a
standardized method to image dental tissues from in patient X‐rays, so their result should be treated with caution. Their findings, however, are supported by those obtained in genetic loci studies of human amelogenin; which appear to be the principal intermediaries of this interaction (Fincham et al., 1991, 1999; Salido, Yen, Koprivnikar, Yu, & Shapiro, 1992).The amelogenin is the main protein component of the organic matrix in enamel, and its genes are on both the X and Y chromosomes (Fincham, Moradian‐Oldak, & Simmer, 1999; Fincham et al., 1991). The quantitative and qualitative differences in their transcriptional products influence the proportions in which hard dental tissues are present (Salido et al., 1992; Schwartz and Dean, 2005), likewise genetic alterations of these genes cause different dental tissues defects (Cho et al., 2014; Hu et al., 2012).
On the other hand, some authors have argued about the actual extent to which sexual hormones have an effect on dental sexual dimorphism (Gingerich, 1974; Guatelli‐Steinberg et al., 2008; Kondo and Townsend, 2006; Kondo, Townsend, & Yamada, 2005; Smith et al., 2006). Guatelli‐ Steinberg et al. (2008), in a study based on post‐natal testosterone levels, suggested that sexual dimorphism in population‐wide patterns is mainly related to the growth‐promoting effect of the Y chromosome, and that sex hormones have only a minor influence during tooth development. However, opposite‐sex twin pairs studies, in which the influence intrauterine levels of
testosterone were also considered, supported that intrauterine male hormone levels influence on different tooth dimensions and contribute to the sexual dimorphism of human teeth (Dempsey, Townsend, & Richards, 1999; Ribeiro, Brook, Hughes, Sampson, & Townsend, 2013; Ribeiro, Sampson, Hughes, Brook, & Townsend, 2012). In terms of dental tissues, Zilberman and Smith (2001) studied the hypothesis that odontoblast activity is influenced by sexual hormones, and it is expressed in differences in dentine thickness that change with age. They concluded that the origin of differences in dental tissues proportions is probably due to the different rates of dentine
deposition taking place during the lives of males and females. The discovery of Growth Hormone (GH) receptors in dental tissue could also provide a further clue as to why these differences exist (Zhang et al., 1997). This hormone is the major regulator of postnatal growth and development (Giustina and Veldhuis, 1998), which has a strong influence on the metabolism of oral tissues (Slootweg, 1993). Particularly, GH is able to induce proliferation of epithelial stem cells, preameloblast differentiation and dentine matrix formation (Young, Zhang, Li, Osborne, & Waters, 1992).This hormone is influenced by oestrogens and others sex steroids (Alonso and Rosenfield, 2002; Meinhardt and Ho, 2006; Saggese, Bertelloni, & Baroncelli, 1997). While at higher oestrogen concentrations growth is inhibited (Alonso and Rosenfield, 2002), the
testosterone induces growth (Clark and Rogol, 1996). It could be the reason why dentine thickness differences are more marked in puberty (Zilberman and Smith, 2001), when both hormones levels are higher, and the degree of dentine formation appears to increase suddenly in females during their fourth decade of life, when oestrogen levels decrease (Woods, Robinson, & Harris, 1990). New research on about how the different combinations of sex hormones and their varying concentrations levels affect odontoblasts activity would be of help to clarify the
mechanism by which they influence sexual dimorphism, as well as to know their role within the complex adaptive system of dental development, in which intervene genetic, epigenetic, and environmental factors.
5 CONCLUSIONS
The present study has found that dental tissue volumes and surface areas can be used in sex determination as they present a high degree of sexual dimorphism. Our results support the
hypothesis that the sexual dimorphism of mandibular canine size is mainly due to males having a greater amount of dentine, whereas sex differences in enamel volume do not make a large
contribution to overall tooth size. Discriminant function analysis gave a high classification accuracy ranging between 78.00% and 90.20% for the cross‐validation, and between 76.92% and 84.62% when tested on a hold‐out sample of slightly worn teeth. When we used the combination of the seven functions (D1–D7), 92.30% of the individuals were correctly assigned. Although these functions have been tested on a sample composed of individuals of different origin, this method needs to be tested on other population groups, as sexual dimorphism in teeth may vary between populations. The results obtained show the importance of dental histology as a
methodology in sex determination in archaeological and forensic contexts, especially when other skeletal elements are fragmented and/or other measurements are unavailable.
ACKNOWLEDGMENTS
This study has been supported by the Dirección General de Investigación of the Spanish
Ministerio de Economía y Competitividad (MINECO/FEDER) grant number: CGL2015–65387‐ C3‐1, 3‐P. to the authors acknowledge The Leakey Foundation for the personal support provided by Gordon Getty and Dub Crook to one of the authors (MM‐T). CG‐C, MM, and MM‐P are funded by a doctoral grant from the Junta de Castilla y León financed in turn by the European Social Funds through the Consejería de Educacion. LM‐F is the recipient of a post‐doctoral research grant at Atapuerca Fundation. Some of the micro‐CT images were obtained in the
Laboratory of Microscopy of the CENIEH‐ICTS (Spain) and in collaboration with CENIEH staff. The remainder of the dental samples were scanned in the Multidisciplinary Laboratory of the International Centre for Theoretical Physics (ICTP) of Trieste in collaboration with Federico Bernardini. The African sample from Sudan was provided by Dr Christopher Dean from the Anatomy Department at University College London. Part of the sample was analyzed in the Anthropology Department at University College London in collaboration with Dr Christopher Soligo. The authors are indebted to A. Oettlé, G. Krüger, and E.N. L'Abbé for kindly authorizing access to the Pretoria Bone Collection (PBC) of the University of Pretoria. They also deeply thank F. de Beer and J. Hoffman for carrying out the X‐ray microCT imaging of the human specimens from the PBC included in this study.
References
Acharya, A. B., Angadi, P. V., Prabhu, S., & Nagnur, S. (2011). Validity of the mandibular canine index (MCI) in sex prediction: Reassessment in an Indian sample. Forensic Science International, 204, 207.e1– 204.
Acharya, A. B., & Mainali, S. (2007). Univariate sex dimorphism in the Nepalese dentition and the use of discriminant functions in gender assessment. Forensic Science International, 173, 47– 56.
Alonso, L. C., & Rosenfield, R. L. (2002). Oestrogens and puberty. Best Practice & Research Clinical Endocrinology & Metabolism, 16, 13– 30.
Alvesalo, L. (1971). The influence of sex‐chromosome genes on tooth size in man: A genetic and quantitative study. American Journal of Orthodontics, 60, 420.
Alvesalo, L. (1997). Sex chromosomes and human growth. A dental approach. Human Genetics, 101, 1– 5.
Alvesalo, L. (2009). Human sex chromosomes in oral and craniofacial growth. Archives of Oral Biology, 54, S18– S24.
Alvesalo, L., & Portin, P. (1980). 47, XXY males: Sex chromosomes and tooth size. American Journal of Human Genetics, 32, 955– 959.
Alvesalo, L., & Tammisalo, E. (1981). Enamel thickness of 45, X females' permanent teeth. American Journal of Human Genetics, 33, 464– 469.
Alvesalo, L., Tammisalo, E., & Hakola, P. (1985). Enamel thickness in 47, XYY males' permanent teeth. Annals of Human Biology, 12, 421– 427.
Alvesalo, L., Tammisalo, E., & Therman, E. (1987). 47, XXX females, sex chromosomes, and tooth crown structure. Human Genetics, 77, 345– 348.
Alvesalo, L., Tammisalo, E., & Townsend, G. (1991). Upper central incisor and canine tooth crown size in 47, XXY males. Journal of Dental Research, 70, 1057– 1060.
Ateş, M., Karaman, F., Işcan, M. Y., & Erdem, T. L. (2006). Sexual differences in Turkish dentition. Legal Medicine (Tokyo, Japan), 8, 288– 292.
Benazzi, S., Panetta, D., Fornai, C., Toussaint, M., Gruppioni, G., & Hublin, J.‐J. (2014). Technical note: Guidelines for the digital computation of 2D and 3D enamel thickness in hominoid teeth. American Journal of Physical Anthropology, 153, 305– 313.
Cho, E. S., Kim, K.‐J., Lee, K.‐E., Lee, E.‐J., Yun, C. Y., Lee, M.‐J., … Kim, J.‐W. (2014). Alteration of conserved alternative splicing in AMELX causes enamel defects. Journal of Dental Research, 93, 980– 987.
Clark, P. A., & Rogol, A. D. (1996). Growth hormones and sex steroid interactions at puberty. Endocrinology and Metabolism Clinics of North America, 25, 665– 681.
Dempsey, P. J., Townsend, G. C., & Richards, L. C. (1999). Increased tooth crown size in females with twin brothers: Evidence for hormonal diffusion between human twins in utero. American Journal of Human Biology: The Official Journal of the Human Biology Council, 11, 577– 586.
Elamin, F., & Liversidge, H. M. (2013). Malnutrition has no effect on the timing of human tooth formation. PLOS One, 8, e72274.
Feeney, R. N. M. (2009). Microtomographic analysis of sexual dimorphism and dental tissue distribution in human molars, PhD thesis. Columbus: The Ohio State University.
Feeney, R. N., Zermeno, J. P., Reid, D. J., Nakashima, S., Sano, H., Bahar, A., … Smith, T. M. (2010). Enamel thickness in Asian human canines and premolars. Anthropological Science, 118, 191– 198.
Ferembach, D., Schwindezky, I., Stoukal, M., Ferembach, D., Schwindezky, I., & Stoukal, M. (1980). Recommendation for age and sex diagnoses of skeletons. Journal of Human Evolution, 9, 517– 549.
Fincham, A. G., Bessem, C. C., Lau, E. C., Pavlova, Z., Shuler, C., Slavkin, H. C., & Snead, M. L. (1991). Human developing enamel proteins exhibit a sex‐linked dimorphism. Calcified Tissue International, 48, 288– 290.
Fincham, A. G., Moradian‐Oldak, J., & Simmer, J. P. (1999). The structural biology of the developing dental enamel matrix. Journal of Structural Biology, 126, 270– 299.
Garn, S. M., Lewis, A. B., & Kerewsky, R. S. (1964). Sex difference in tooth size. Journal of Dental Research, 43, 306.
Garn, S. M., Lewis, A. B., & Kerewsky, R. S. (1967). Shape similarities throughout the dentition. Journal of Dental Research, 46, 1481.
Garn, S. M., Van Alstine, W. L., Jr., & Cole, P. E. (1978). Relationship between root lengths and crown diameters of corresponding teeth. Journal of Dental Research, 57, 636.
Gingerich, P. D. (1974). Size variability of the teeth in living mammals and the diagnosis of closely related sympatric fossil species. Journal of Paleontology, 48, 895– 903.
Giustina, A., & Veldhuis, J. D. (1998). Pathophysiology of the neuroregulation of growth
hormone secretion in experimental animals and the human. Endocrine Reviews, 19, 717– 797. Grine, F. E. (2005). Enamel thickness of deciduous and permanent molars in modern Homo
sapiens. American Journal of Physical Anthropology, 126, 14– 31.
Grine, F. E., Stevens, N. J., & Jungers, W. L. (2001). An evaluation of dental radiograph
Guatelli‐Steinberg, D., Sciulli, P. W., & Betsinger, T. K. (2008). Dental crown size and sex hormone concentrations: Another look at the development of sexual dimorphism. American Journal of Physical Anthropology, 137, 324– 333.
Harris, E. F., & Bailit, H. L. (1988). A principal components analysis of human odontometrics. American Journal of Physical Anthropology, 75, 87– 99.
Harris, E. F., & Hicks, J. D. (1998). A radiographic assessment of enamel thickness in human maxillary incisors. Archives of Oral Biology, 43, 825– 831.
Harris, E. F., Hicks, J. D., & Barcroft, B. D. (2001). Tissue contributions to sex and race: Differences in tooth crown size of deciduous molars. American Journal of Physical Anthropology, 115, 223– 237.
Harris, E. F., & Lease, L. R. (2005). Mesiodistal tooth crown dimensions of the primary
dentition: A worldwide survey. American Journal of Physical Anthropology, 128, 593– 607. Hillson, S. (1996). Dental anthropology. Cambridge: Cambridge University Press.
Hu, J. C.‐C., Chan, H.‐C., Simmer, S. G., Seymen, F., Richardson, A. S., Hu, Y., … Simmer, J. P. (2012). Amelogenesis imperfecta in two families with defined AMELX deletions in ARHGAP6. PloS One, 7, e52052.
Hu, K.‐S., Koh, K.‐S., Han, S.‐H., Shin, K.‐J., & Kim, H.‐J. (2006). Sex determination using nonmetric characteristics of the mandible in Koreans. Journal of Forensic Sciences, 51, 1376– 1382.
Iscan, M. Y., & Derrick, K. (1984). Determination of sex from the sacroiliac joint: A visual assessment technique. FL: Florida Scientist.
Iscan, M. Y., & Kedici, P. S. (2003). Sexual variation in bucco‐lingual dimensions in Turkish dentition. Forensic Sci Int, 137, 160– 164.
Kondo, S., & Townsend, G. C. (2006). Associations between Carabelli trait and cusp areas in human permanent maxillary first molars. American Journal of Physical Anthropology, 129, 196– 203.
Kondo, S., Townsend, G. C., & Yamada, H. (2005). Sexual dimorphism of cusp dimensions in human maxillary molars. American Journal of Physical Anthropology, 128, 870– 877. Kono, R. T. (2004). Molar enamel thickness and distribution patterns in extant great apes and
humans: New insights based on a 3‐dimensional whole crown perspective. Anthropological Science, 112, 121– 146.
L'Abbé, E. N., Loots, M., & Meiring, J. H. (2005). The Pretoria bone collection: A modern South African skeletal sample. HOMO—Journal of Comparative Human Biology, 56, 197– 205. Lee Greene, D. (1991). Advances in dental anthropology. American Journal of Human Biology,
3, 693– 694.
Lund, H., & Mörnstad, H. (1999). Gender determination by odontometrics in a Swedish population. The Journal of Forensic Odonto‐Stomatology, 17, 30– 34.
Luo, Y. C. (1995). Sex determination from the pubis by discriminant function analysis. Forensic Science International, 74, 89– 98.
Macho, G. A., & Berner, M. E. (1993). Enamel thickness of human maxillary molars reconsidered. American Journal of Physical Anthropology, 92, 189– 200.
Martin, L. (1985). Significance of enamel thickness in hominid evolution. Nature, 314, 260– 263. Martin, L. B. (1983). The relationships of the later Miocene Hominoidea.University College
London.
Meinhardt, U. J. & Ho, K. K. Y. (2006). Modulation of growth hormone action by sex steroids. Clinical Endocrinology (Oxf) 65: 413– 422.
Molnar, S. (1971). Human tooth wear, tooth function and cultural variability. American Journal of Physical Anthropology, 34, 175– 189.
Molnar, S., Hildebolt, C., Molnar, I. M., Radovcic, J., & Gravier, M. (1993). Hominid enamel thickness: I. The Krapina Neandertals. American Journal of Physical Anthropology, 92, 131– 138.
Moorrees, E., Kai‐Jen Yen, P., Moorrees, C. F., & Thomsen, S. O. (1957). Mesiodistal crown diameters of the deciduous and permanent teeth in individuals. Journal of Dental Research, 36, 39– 47.
Moss, M. L., & Moss‐Salentijn, L. (1977). Analysis of developmental processes possibly related to human dental sexual dimorphism in permanent and deciduous canines. American Journal of Physical Anthropology, 46, 407– 413.
Olejniczak, A. J., Smith, T. M., Feeney, R. N. M., Macchiarelli, R., Mazurier, A., Bondioli, L., … Hublin, J.‐J. (2008a). Dental tissue proportions and enamel thickness in Neandertal and modern human molars. Journal of Human Evolution, 55, 12– 23.
Olejniczak, A. J., & Grine, F. E. (2006). Assessment of the accuracy of dental enamel thickness measurements using microfocal X‐ray computed tomography. The Anatomical Record. Part A, Discoveries in Molecular, Cellular, and Evolutionary Biology, 288, 263– 275.
Olejniczak, A. J., Tafforeau, P., Feeney, R. N., & Martin, L. B. (2008b). Three‐dimensional primate molar enamel thickness. J Hum Evol, 54, 187– 195.
Peckmann, T. R., Logar, C., Garrido‐Varas, C. E., Meek, S., & Pinto, X. T. (2015). Sex
determination using the mesio‐distal dimension of permanent maxillary incisors and canines in a modern Chilean population. Science & Justice.
Pentinpuro, R., Pesonen, P., Alvesalo, L., & Lähdesmäki, R. (2017). Crown heights in the permanent teeth of 47, XYY males. Acta Odontologica Scandinavica, 75, 379– 385. Pentinpuro, R. H., Lähdesmäki, R. E., Niinimaa, A. O., Pesonen, P. R. O., & Alvesalo, L. J.
(2014). Crown heights in the permanent teeth of 45, X and 45, X/46, XX females. Acta Odontologica Scandinavica, 72, 908– 916.
Pereira, C., Bernardo, M., Pestana D, Santos, J. C., & Mendonça, M. C de. (2010). Contribution of teeth in human forensic identification–discriminant function sexing odontometrical
techniques in Portuguese population. J Forensic Leg Med, 17, 105– 110.
Plavcan, J. M. (2012). Sexual size dimorphism, canine dimorphism, and male‐male competition in primates: Where do humans fit in? Human Nature (Hawthorne, N.Y.), 23, 45– 67.
Prabhu, S., & Acharya, A. B. (2009). Odontometric sex assessment in Indians. Forensic Science International, 192, 129.e1– 125.
Rao, N. G., Rao, N. N., Pai, M. L., & Kotian, M. S. (1989). Mandibular canine index—A clue for establishing sex identity. Forensic Science International, 42, 249– 254.
Ribeiro, D. C., Brook, A. H., Hughes, T. E., Sampson, W. J., & Townsend, G. C. (2013). Intrauterine hormone effects on tooth dimensions. Journal of Dental Research, 92, 425– 431. Ribeiro, D., Sampson, W., Hughes, T., & Brook, A. (2012). Sexual dimorphism in the primary
and permanent dentitions of twins: An approach to clarifying the role of hormonal factors. In: New Directions in Dental Anthropology. Paradigms, methodologies and outcomes. University of Adelaide Press. p 46– 64.
Roetzscher, K. (2013). Forensic and Legal Dentistry. Springer Science & Business Media. Saggese, G., Bertelloni, S., & Baroncelli, G. I. (1997). Sex steroids and the acquisition of bone
Salido, E. C., Yen, P. H., Koprivnikar, K., Yu, L. C., & Shapiro, L. J. (1992). The human enamel protein gene amelogenin is expressed from both the X and the Y chromosomes. American Journal of Human Genetics, 50, 303– 316.
Saunders, S. R., Chan, A. H. W., Kahlon, B., Kluge, H. F., & FitzGerald, C. M. (2007). Sexual dimorphism of the dental tissues in human permanent mandibular canines and third premolars. American Journal of Physical Anthropology, 133, 735– 740.
Schwartz, G. T. (2000). Taxonomic and functional aspects of the patterning of enamel thickness distribution in extant large‐bodied hominoids. Am J Phys Anthropol, 111, 221– 244.
Schwartz, G. T., & Dean, M. C. (2005). Sexual dimorphism in modern human permanent teeth. American Journal of Physical Anthropology, 128, 312– 317.
Shellis, R. P., Beynon, A. D., Reid, D. J., & Hiiemae, K. M. (1998). Variations in molar enamel thickness among primates. Journal of Human Evolution, 35, 507– 522.
Skinner, M. M., Gunz, P., Wood, B. A., & Hublin, J.‐J. (2008a). Enamel‐dentine junction (EDJ) morphology distinguishes the lower molars of Australopithecus africanus and Paranthropus robustus. Journal of Human Evolution, 55, 979– 988.
Skinner, M. M., Wood, B. A., Boesch, C., Olejniczak, A. J., Rosas, A., Smith, T. M., & Hublin, J.‐J. (2008b). Dental trait expression at the enamel‐dentine junction of lower molars in extant and fossil hominoids. Journal of Human Evolution, 54, 173– 186.
Slootweg, M. C. (1993). Growth hormone and bone. Hormone and Metabolic Research, 25, 335– 343.
Smith, T. M., Olejniczak, A. J., Martin, L. B., & Reid, D. J. (2005). Variation in hominoid molar enamel thickness. Journal of Human Evolution, 48, 575– 592.
Smith, T. M., Olejniczak, A. J., Reid, D. J., Ferrell, R. J., & Hublin, J. J. (2006). Modern human molar enamel thickness and enamel‐dentine junction shape. Archives of Oral Biology, 51, 974– 995.
Smith, T. M., Olejniczak, A. J., Reh, S., Reid, D. J., & Hublin, J. ‐J. (2008). Brief
communication: Enamel thickness trends in the dental arcade of humans and chimpanzees. Am J Phys Anthropol, 136, 237– 241.
Smith, T. M., Olejniczak, A. J., Zermeno, J. P., Tafforeau, P., Skinner, M. M., Hoffmann, A., … Hublin, J.‐J. (2012). Variation in enamel thickness within the genus Homo. Journal of Human Evolution, 62, 395– 411.