Publisher’s version / Version de l'éditeur:
Vous avez des questions? Nous pouvons vous aider. Pour communiquer directement avec un auteur, consultez la première page de la revue dans laquelle son article a été publié afin de trouver ses coordonnées. Si vous n’arrivez pas à les repérer, communiquez avec nous à [email protected].
Questions? Contact the NRC Publications Archive team at
[email protected]. If you wish to email the authors directly, please see the first page of the publication for their contact information.
https://publications-cnrc.canada.ca/fra/droits
L’accès à ce site Web et l’utilisation de son contenu sont assujettis aux conditions présentées dans le site LISEZ CES CONDITIONS ATTENTIVEMENT AVANT D’UTILISER CE SITE WEB.
Paper (National Research Council of Canada. Division of Building Research); no.
DBR-P-892, 1980
READ THESE TERMS AND CONDITIONS CAREFULLY BEFORE USING THIS WEBSITE. https://nrc-publications.canada.ca/eng/copyright
NRC Publications Archive Record / Notice des Archives des publications du CNRC :
https://nrc-publications.canada.ca/eng/view/object/?id=f690eef3-6b4b-4581-9b5e-e987b2d0e280
https://publications-cnrc.canada.ca/fra/voir/objet/?id=f690eef3-6b4b-4581-9b5e-e987b2d0e280
NRC Publications Archive
Archives des publications du CNRC
This publication could be one of several versions: author’s original, accepted manuscript or the publisher’s version. / La version de cette publication peut être l’une des suivantes : la version prépublication de l’auteur, la version acceptée du manuscrit ou la version de l’éditeur.
For the publisher’s version, please access the DOI link below./ Pour consulter la version de l’éditeur, utilisez le lien DOI ci-dessous.
https://doi.org/10.4224/40001692
Access and use of this website and the material on it are subject to the Terms and Conditions set forth at
Ventilation of fully-developed compartment fires
-
I(
#
National Research Conseil nationalCouncil Canada
de
recherchesCanada
Ser
1
TH1
N21d
Ino.892
- --
I
VENTILATION OF FULLY-DEVELOPED
COMPARTMENT
FIRES
Reprinted tium
Combustion and Plame VoL 37, No. 1, January 1980 p. 25 39
DBR Paper No. 892
Divbion of Building Remuch
t
t
I
L'auteul- Btudie l a r e l a t i o n e n t r e l a v i t e s s e d ' e n t r e e de l ' a i r dans une c e l l u l e B feu e t Le paramstre "de ventilation" au moyen d'une serie d ' c x p e r i m c e e e c h e l l e r g d u i t e . Au cours de l a perfode de p l e i n dEveloppemenr, lc panache de feu s un rale important B j o u e r dans l e mauvement d e l ' a i r e t den e f f l u e n t s gazeux du f e u . L e pan- ache d e f e u agit c o m e une pompe 3. reaction primitive et p a t accr- o i t r e par un facteur de 2 l a circulation dea gaz p a r r a p p o r t b celle
a t tr i b u a b l e au mecanisme d'6coulement e n deux couches. L
'
a u t e u r o f f r e un modPle p r o v i s o i r e du mBcanisme d e v e n t i l a t i o n , augmentedeCOMBUSTIONAND FLAME 37: 25-39 (1980)
Ventilation of Fully-Developed Compartment Fires
. ,.
T. Z. HARMATHY
Fire Research Section, Division of Building Research, National Research Council of Canada, Ottawa,
c Ontario, K I A OR6, Canada
1
The relation between the rate of entry of air into a f i e cell and the so-called ventilation parameter was studied in a series of reduced-scale experiments. It was found that, during the period of full development, the fire plume plays a significant role in the movement of the air and the effluent fire gases. The fire plume acts as a primitive jet pump and may increase the throughput of gases, in relation to that attributable to the two-layer flow mechanism, by as much as a factor of 2. A tentative model of the plume-augmented ventilation mechanism is offered.
The rate of entry of fresh air into a burning com- partment through a broken window or open door has an important bearing on the characteristics of fire during both the pre- and the post-flashover periods. It has long been usual to calculate the flow rate of air by a simple model suggested by Kawagoe [ I ] and elaborated by Thomas et al. [2]. Kawagoe's model assumes that the burning com- partment is at a uniform temperature and that the entry of fresh air and the departure of hot fire gases are brought about by a static-pressure field induced by the temperature difference between the fire compartment and the outside atmosphere. Demands for higher accuracy, especially in studying preflashover fires, resulted in other, more sophisticated flow models. The best known among them is that propounded by Prahl and Emmons [3]. Their model assumes the presence of two gas layers in the compartment: an air layer at the same temperature as the outside atmosphere and, above ' r that, a hot layer made up of the fire gases. The movement of the two layers, that is the inflow of
P
air and the outflow of fire gases, is theorized to take place under the effect of a static-pressure field set up by the temperature difference between the two layers.Since the Prahl-Emmons model neglects the coupling, brought about by the fire plume, be-
tween the air and fire-gas streams, it is not strictly applicable to advance stages of preflashover fires. The importance of the coupling between the two streams has been discussed by Rockett [4]. His model regards the burning room as a pump and the window or door as a throttle. It also utilizes the two-layer concept, but, instead of attributing the movement of both layers solely to a static-pressure field, assumes that the rate of inflow of air is controlled by the air entraining capability of a trun- cated fire plume acting between the fire base and the hot layer of fire gases. This model seems to yield conclusions compatible with observations. Since the fire plume is modeled according to Fang's concept [5]
,
which is not strictly applicable to fires burning in an enclosure, the validity of the concept is probably restricted to earlier stages of preflashover fires.A ventilation model similar to Rockett's in its
main features was employed in a comprehensive theoretical and experimental study conducted by Tangren et at. [6]
.
In their model Yokoi's plume theory [7] is utilized. Because of the assumptions used, the validity of this model is also limited to the preflashover period.Several years ago the author [8] suggested, after analyzing information available on hundreds of full-scale and reduced-scale compartment burnout
Copyright @ 1980 by The Combustion Institute Published by Elsevier North Holland, Inc.
T. Z. HARMATHY experiments, that for the period of fully-developed
fire the compartment ventilation could be described by the following simple formula1
where @ is the so-called ventilation parameter de- fined as
Prahl and Emmons [3] found, however, that dur- ing the preflashover period of an experimental bedroom fire [9] ,
Ua/@
always remained slightly below 0.1. Since after flashover the fire always takes place under "choked-flow" conditions when the air flow rate is at its maximum, the finding of Prahl and Emmons did not necessarily indicate that the constant used by the author, 0.145, was inconsistent with theoretical considerations. Yet, since the discrepancy between the two values seemed to be larger than expected, the author de- cided to reexamine the validity of his formula on the basis of a series of specially devised experiments. The results of the experimental series are re- ported here. A model for coordinating the results is presented, along with some speculations con- cerning the interpretation of the principal findings.EXPERIMENTAL
In his pioneering experiments, Kawagoe [ I ] deter- mined the rate of movement of air and fire gases in and out of the burning compartment by measuring with an anemometer the velocity distribution in the air and the fire-gas streams in the plane of the window. Techniques of recording velocity profiles have improved substantially in recent years [9] ; however, the information of principal interest, namely, the flow rate of fresh air into the com- partment, has yet to be determined from velocity measurements (which are themselves subject t o substantial temporal variations) taken at discrete locations.
See Nomenclature section at the end of paper.
To circumvent this difficulty, the author looked for ways to introduce air into the experimental fire compartment at measured flow rates. Several possible solutions were considered. The experi- mental setup finally adopted is illustrated in Fig. 1. The experimental fire chamber (1) measuring 820 mm wide, 1060 mm deep, and 820 mm high, was constructed from steel sheet and was lined on
*
the inside with Fiberfrax, 13 mm thick. The size of the chamber opening was changed from series to,
,
series, by four pieces of suitably cut steel sheet. In most runs the opening (2), had its longer dimen- sion horizontally and was located at midheight of-
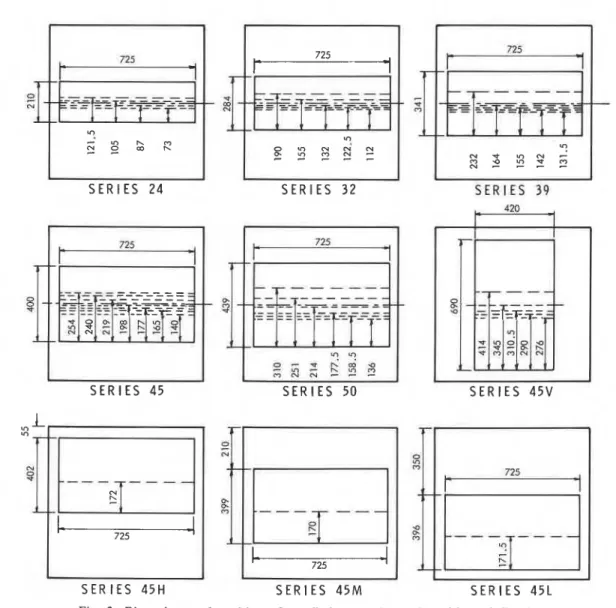
the chamber. In one series it was displaced from the midheight, closer either to the top or bottom. In another series the longer dimension was arranged vertically. The dimensions and location of the opening and the coding of the series are illustrated in Fig. 2. (The series number is an approximate in- dication of the percentage area of the opening, as referred to the frontal area of the fire chamber.) The temperature of the gases was measured by 18 Chromel-Alumel thermocouples, (3) located at three levels, ata,
*, and3
of the chamber height. The thermocouple wires were inserted from two sides and the junctions formed at$
of the chamber width.Propane gas was used. To simulate area fires representative of fully developed fires, the gas was introduced through 120 holes, 2 mm in diameter, drilled into a four-pronged distributor (4) fabri- cated from 25-mm pipe. The fire chamber rested on a jack (5) by which its position could be ad- justed vertically.
The chamber was attached to a large sheet steel ventilation box (6), 1230 mm wide, 2000 mm long and 1010 mm high, which was connected by a dif- fuser (7) and a square duct of 150-mm inside dimensions (8) to the air-supply line. A perforated plate (9) with 3-mm holes that provided about 35% open area was installed across the box at
'
about 390 mm from the diffuser entrance to mini- mize the kinetic energy of the air entering from the duct. A 500-mm wide section of the top next-
to the fire chamber, to be referred to as flap (lo), was made movable about hinges. By raising or lowering this flap, slight adjustments could be made in the area of entry of air from the ventila-28 T. Z. HARMATHY S E R I E S 2 4 - S E R I E S 3 2 S E R I E S 39 I 420 I
-
S E R I E S 4 5I
.
." 5 ' 5 S 3
F) N S E R I E S 5 0 S E R I E S 4 5 V S E R I E S 4 5 H S E R I E S 4 5 M S E R I E S 4 5 LFig. 2. Dimensions and position of ventilation opening and position of flap in experiments.
tion box to the fire chamber. Leakage of air around the edges of the flap was prevented by the applica- tion of adhesive tape. Twenty-eight 7-mm holes (1 I), were drilled in a vertical row through one side of the ventilation box. These holes were covered by a shallow trough (1 2) having a single 7-mm hole
(13), at 390 mm from the top of the ventilation
box.
The experimental procedure was visualized as follows. The fire plume rising from the burning propane in the fire chamber would cause the pres- sure in the adjoining ventilation box to sink below
the atmospheric level. Air would then be introduced into the box through duct 8 at gradually increas- ing, measured rates, until the atmospheric pressure in the box was restored. The pressure level would be monitored by the flame of a candle (14) held close t o hole 13. A slight vacuum in the box would force the flame into the hole. The equaliza- tion of the static pressures inside and outside the box would be revealed by the straightening out of the candle flame.
Since the position of the neutral pressure plane in the opening of the fire chamber was not known,
VENTILATION OF COMPARTMENT FIRES it was planned that, by moving the fire chamber up or down and by making adjustments on the position of the flap (lo), a series of experiments would be conducted for each opening size at various flap positions. It was thought that the gas flow through the chamber, that is, the "pumping efficiency" of the fire, would decline with both
'
too high and too low flap positions, due to in- creased flow resistance effected by the constricted,
-
area left for the outflowing fire gases in the former case and for the inflowing air in the latter. The position of the neutral pressure plane would then-
be judged as that belonging to the highest gas flowthroughout.
The position of the flap in the various experi- mental series is also shown in Fig. 2. In all experi- ments a smoldering piece of fiberboard was placed on the flap. Movement of smoke, generated by the board, toward the fire chamber was expected to reveal possible entrainment of secondary air from the ambient atmosphere.
It was realized that the real-world conditions would not be exactly duplicated in the experi- ments. Although the ratio of the cross-sectional area of the ventilation box to the opening in the fire chamber was large (4: 1-8: I), it was neverthe- less a finite value. Also, in spite of the presence of the perforated plate (9), part of the airflow from the duct to the opening of the fire chamber was expected to take place along a preferred path. Another imperfection in duplicating real-world conditions was expected to be brought on by the presence of the flap, which would tend to suppress the turbulent intermixing between the entering air and the outflowing fire gases. In spite of these shortcomings of the experimental procedure, it was believed that the results would be accurate enough to shed some light on the realistic value of
-
Ua/@ in fully developed fires.-
* The accuracy of the measurements seemed to depend to a great extent on the accuracy of de-b tecting the absence of pressure difference between
.
.
the ventilation box and the outside atmosphere. Decision on the point at which the candle flame straightens out is often a subjective one, in view of the unavoidable fluctuations in the ventilation- box pressure. Yet two observers, who were asked to report on the point of pressure equalization in aseries of runs in which air from the fire chamber was exhausted by a fan at various constant levels of flow rate, made remarkably reproducible and uniform decisions. It was concluded that the air- flow rate at which pressure equalization took place could be determined at an accuracy of 20.002 kg/ sec.
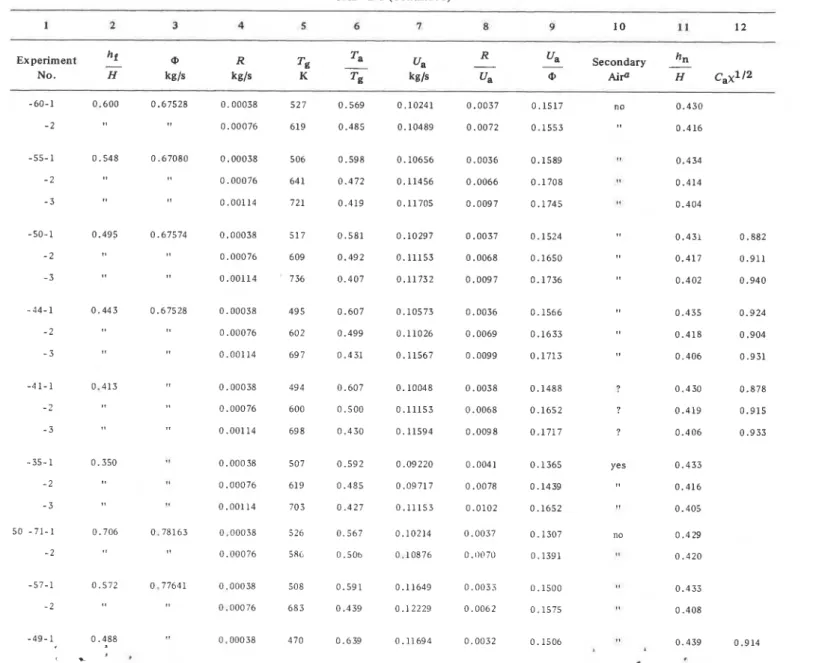
The experimental data are summarized in col- umns 2-10 of Table 1. The experiment numbers consist of three numerals. The first is the series number that, as mentioned, is roughly the per- centage area of the opening, referred to the frontal area of the fire chamber. The second is the approx- imate percentage value of that portion of the opening below the flap. The third is the run num- ber, which is an indication of the flow rate of pro- pane. It had originally been planned that three experiments would be performed, for each com- bination of opening area and flap setting, at three preselected rates of propane supply. Unfortunately, some experiments could not be completed because of the inadequacy of ai; supply.
The flow rates of propane were selected at such levels as to allow the combustion to take place entirely within the confines of the fire chamber. The combustion products were clear; soot forma- tion was generally negligible. The gases appeared to be well mixed in the upper half of the chamber. The experimental data revealed that the momen- tum of the burner jets did not contribute signifi- cantly to the flow rate of air.
In Table 1, T , is the temperature of the com- partment gases, obtained by averaging readings from 12 thermocouples on the second and third levels. (The thermocouples on the first level were often submerged in the flames and recorded sub- stantially higher temperatures.)
The following observations can be made: 1. The position of the flap within the range
0.39
<
( h f / H )<
0.50 has only minor influence on the fluid throughput. This finding suggests that in real-world fires the position of the neutral pressure plane may oscillate wildly without significantly affecting the steady flow of air and fire gases.2. As expected, the ventilation increases slightly as the average temperature of the fire gases in the chamber increases.
TABLE 1
Experimental Data and Derived Information
Experiment
%
@ R T g Ta ua - R h n- Ua - Secondary -
VENTILATION OF COMPARTMENT FIRES m a w m a r -m a a - m a 4 . 3 . 4 . 9 9 1 4 3 3 - 3 3 u , m a *. a. m. q q q ? q ? q q q q q q - ? ? ? 7 0 0 0 0 0 0 0 0 0 0 0 0 0 0 0 0 0 0 0 0 0 0 w m m a m m m m m a a a o m m o m o m - F - m m m m - + ~ o P - m ~- , m a r - m m r - o m m 3 a r - t - , , , . . . d. ,., ., ,., . . .2 . . 2. . 2. 2 . . . 2 . . . 2 0 0 0 O O O O O O 0 0 0 0 0 0 0 0 0 0 0 0 0 m t - 3 m o m a m m , m r r N 3 m m m a r- a m - a m m u m , ~ r - A u m - a m - m 0 0 4 0 0 3 0 0 3 0 0 3 0 0 , 0 0 3 0 0 - 0 0. 0. 0. o q q q q o q q o q q q o q q q q q q 0 0 0 0 0 0 0 0 0 0 0 0 0 0 0 0 0 0 0 0 0 0 o w m o ~ m m mm 3 . 1 - + m a r - r - m m + m a m - - , a m * a m r - m ~w a r n m m. o. m. . . m a T m. . a 7 m. a. m. q q u , q q q m. u. m. m 0 0 0 0 0 0 0 0 0 0 0 0 0 0 0 0 0 0 0 0 0 0 r - " 3 a m w a r n o a m o m o m 0 - 0 m m m w m m o t - r - o w m m a a a o m , N V I - 3 m a m m ~ m m a t -m a t - m a r - m a r - m a r - m m a a m a a m a o m a a m a u m a * m a a m - 1 . 4 m r - 3 m r - r ( m r - + r - m r - - m 0 0 4 O O ~ O O i0 0 , 0 0 - 0 0 3 0 0 3 0 0 0 0 0 0 0 0 0 0 0 0 0 0 0 0 0 0 0 0 0 0 0 0. 0. 0. 9 9 0 9 0 9 q q 9 0 9 0 , 0. . 0 0 q q o 0 0 0 0 0 0 0 0 0 0 0 0 0 0 0 0 0 0 0 0 0 0
TABLE 1 (Continued) 1 2 3 4 5 6 7 8 9 10 11 12 h Experiment
2
@ R No. H k g / s k g / s - 6 0 - 1 0.600 0.67528 0 . 0 0 0 3 85
Secondaryh,
@ Aira H caX1I2 0.1517 no 0.430TABLE 1 (Continued)
2
Experiment
hf
0 R Tg - Ta u a - R-
Ua Secondary h - nW
TABLE 1 (Continued) P
1 2 3 4 5 6 7 8 9 10 1 1 1 2
Experiment
.hf
@ R T g - Ta ua - R2
Secondary5
No. H kg/s kg/s K T g kg/s ua @ A i P H cax1I2
VENTILATION OF COMPARTMENT FIRES 3 5 3. The ventilation depends only slightly on the
vertical position of the opening. It decreases somewhat if the opening is moved close to the bottom of the fire chamber.
4. The ratio Ua/@ is not constant; it is much higher than the value 0.145, suggested by the author for lower values of cP, and slightly lower at highest values of cP.
On conventional fluid-mechanical considera- tions, the last finding comes as a surprise. Because of presumably higher pressure losses for fluid flow through smaller openings, some decrease in the values of Ua/@ would be expected as @ decreases. Clearly, it must be assumed that the fire plume plays, especially at lower values of the ventilation parameter, a more important role in the ventila- tion of the compartment than was thought so far.
THEORETICAL
Although the movement of air and fire gases in and out of a fire chamber can be accounted for by the two-layer model alone, the experimental data suggest that, at least for fully developed fires, the effect of the fire plume, which couples the entering and exiting streams, must also be considered. The author found it convenient to adopt the two-layer model as a basis for speculation and to modify it empirically t o account for the plume effect.
Because only fully developed fires are being considered, it is safe to assume that the flow of air and fire gases always takes place under, or nearly under, choked conditions; in other words, at some distance from the opening the layer of hot fire gases descends below, or very close to, the lower edge of the opening. On the assumption that no coupling occurs between the air and fire-gas streams, the following equations apply2 [ 2 , 3 ] :
In these equations the ratio of the flow coeffi- cients, (Ca/Cg), is usually assumed to be equal to 1. This assumption, though probably accurate enough for practical purposes, cannot be fully justified on theoretical grounds. After examining the flow conditions, one will find that the head- loss coefficient (referred to the velocity head in the opening) is somewhere between 0.5 and 1.5, depending on the ratio of the area of opening to the cross-sectional area of the fire chamber, for a fluid stream entering the chamber and somewhat
.
s larger (1-IS), for a stream leaving the chamber.This means, that (1) Ca (for the air stream) must be moderately larger than Cg (for the stream of
.
.
fire gases) and (2) Ca/Cg is not strictly a constant, but a function of the dimensions of the opening and the chamber, and possible other factors.Whereas the fact that Ca/Cg is usually larger than 1 may deserve consideration, observing its variability is probably rarely warranted. To prove
this, attention is directed to columns 2, 10, and 11 of Table 1. In column 1 1 the values of hn/H (posi- tions of the neutral pressure plane) are listed, as obtained by calculations from Eq. 4 with Ca/Cg taken as constant and equal to 1.1 5. Column 10 indicates that, apart from a few marginal cases, there is an inflow of secondary air above the flap into the fire chamber (as revealed by the move- ment of smoke originating from the smoldering piece of fiberboard) whenever the flap is positioned below the calculated level of the neutral pressure plane, that is, when hf/H (column 2) is less than hn/H (column' 11). Clearly, the position of the neutral pressure plane is predictable with fair accuracy from Eq. 4 with (C,/Cg) 1.15.
The concept to be used in modifying Eq. 3 to account for the plume effect is illustrated in Fig.
2 These equations can be derived either from Kawagoe's model or from the two-layer flow model.
VENTILATION OF COMPARTMENT FIRES 37 from the resulting equations the position of the tion of continuity, the following equation is neutral pressure plane, h,, with the aid of an equa- obtained:
This equation differs from Eq. 3 only by the inclu- sion of
x1I2.
(In accordance with the first assump- tion, the validity of Eq. 4 remains unaffected.) The values of Ua/iP, T a / T g , and R / U a are calculable from experimental data (see Table 1); thus, after some rearrangement, Eq. 6 can be used for the evaluation of the factor Caxl 1 2 . The values of Cax1I2 calculated from the author's experiment [with (Ca/Cg) = 1 .IS] are listed in column 12 of Table 1. Naturally, the results of those experi- ments in which the setting of the flap was signifi- cantly different from the position of the neutral pressure plane (see columns 2 and 11) could not be justifiably included in the calculations.In Fig. 4, Cax1I2 is plotted against the ventila- tion parameter,
a.
It is seen that at low values of the ventilation parameter the factor Cax1I2 may be as high as 1.4. This means that (assuming thatCa, as claimed, is about 0.7)
x
may be as high as 4. In other words, the presence of the fire plume may increase the pressure difference between the fire cell and the outside atmosphere by a factor of 4, or perhaps even more, in relation to what can be attributed to the two-layer model.The value of
x
seems to depend primarily on the ventilation of the fire cell and to be virtually unaffected by the shape of the ventilation open- ing. The position of the opening, whether closer to the top or bottom of the fire cell, has only marginal effect on X . There is a slight tendency, however, toward higher values at higher rates of burning or, perhaps more correctly, at higher tem-.
peratures of the fire gases.The role played by the fire plume in the venti- - .
lation of the fire cell cannot be fully explained without a thorough understanding of the charac-
I .
teristics of the fire plume in an enclosed space. Unfortunately, there is little information on this subject; therefore, the explanation to be offered in the following is largely of a speculative nature.Using the jet-pump analogy, it can be assumed that the depression created in the lower regions of
the fire cell is related to some effective value of the kinetic energy of the fire plume. In general, the average kinetic energy of the plume gases varies with the height above the level of entry of fuel gases. The dependence of the nature of variation on the mechanism of combustion in the plume can be understood from examination of two hypothe- tical cases. In one case, the conditions (air admix- ing, turbulence, heat exchange with the surround- ings, etc.) are adjusted in such a way as to keep the average plume temperature unchanged from level to level. In this case the average velocity of the plume gases would increase roughly in proportion to the square root of the height above the fuel bed 110, 111. In the second case the same conditions (air admission, turbulence, heat exchange with the surroundings, etc.) are adjusted to cause combus- tion to take place in the vicinity of the fuel bed. Under these conditions the velocity of the plume gases would steadily decrease as they rise through the region of air entrainment [12, 131
.
Clearly, dependent to a large extent on the rate of entry of air into the fire cell, the kinetic energy of the rising plume gases may either increase or decrease, or even stay constant, and the total kinetic energy of the plume may be subject to significant variation.Since the kinetic energy of the plume is con- verted into pressure head in the upper' regions of the fire cell, it is quite obvious that conditions associated with the creation of larger below-atmos- pheric pressures in the lower regions will also re- sult in higher above-atomspheric pressure in the upper regions.
Apparently, increases in the flow rate of air (associated with increases in the ventilation para- meters) tend to change the combustion process in the plume in such a way as to reduce the total kinetic energy of the plume and, in turn, the role of the plume as a jet pump. This line of reasoning seems to provide some qualitative explanation for the experimental findings described in the paper.
3 8
T.
Z. HARMATHYk g l s
Fig. 4. Plot of C,x1I2 VS a.
Clearly, it would be presumptuous to present the arguments in a more definite form before the re- sults are complemented with others obtained from full-scale experiments.
CONCLUSIONS
The rate of entry of air into a compartment on fire is part of the basic information required to predict the principal traits of the fire during both the growth period and the period of full in- volvement. It has so far been usual to regard the mass flow rate of air through the ventilation
with the effluent stream of fire gases, the factor of proportionality is sometimes much higher than previously believed. It is a function of the ventila- tion parameter and some other variables of sec- ondary importance. A tentative interpretation of the findings is presented.
The experimental work was conducted by J. W. MacLaurin and R. A. MacDonald. This paper is a contribution from the Division of Building Re- search, National Research Council of Canada and is published with the approval of the director o f the division.
opening as proportional to the so-called ventila-
NOMENCLATURE tion parameter. There has been, however, some un-
certainty about the magnitude of the factor of A area (m2)
proportionality. From a series of experiments C flow coefficient, dimensionless related to the period of full-fire development, it g acceleration due to gravity (m/sec2)
has been concluded that, due to the role the fire h vertical position above edge of ventilation plume plays in coupling the entering airstream opening (m)
VENTILATION OF COMPARTMENT FIRES 39
H height of ventilation opening (m) 3. Prahl, J., and Emmons, H. W., Combust. Flame 25:
p pressure (Pa) 369 (1975).
Ap pressure difference (Pa) 4 . Rockett, J. A., Combust. Sci. Technol. 12:165
(1976).
R rate of burning (kglsec) 5. Fang, J. B., Analysis of the Behaviour of a Freely
T temperature (K) Burning Fire in a Quiescent Atmosphere, U.S. Na-
U
mass flow rate (kglsec) tional Bureau of Standards, Washington, D.C.,z vertical coordinate (m) NBSIR 73-115, 1973.
An
pressure difference, corrected for the pre- 6. Tansren, E. N., Sargent, W. S.3 and Zukoski, E. E.9Hydraulic and Numerical Modeling of Room Fires,
sence of fire plume (Pa) California Institute of Technology, Pasadena, Calif.,
p density (kg/m3) June 1978.
@ ventilation parameter (kg/sec) 7. Yokoi, S., Study on the Prevention of Fire Spread
x
factor expressing the effect of fire plume Caused by Hot Upward Current, Building ResearchInstitute, Japan, report No. 34, 1960.
8. Harmathy, T. Z., Fire Technol. 8:196, 326 (1972).
Subscripts 9 . Croce, P. A,, and Emmons, H. W., The Large Scale
Bedroom Fire Test, July 11, 1973, Home Fire Pro-
a of air, for airstream, of outside atmosphere ject Report, No. 2101 1.4, Factory Mutual Research
f of flap Corporation, Norwood, Mass.
of fire gases, for the stream of fire gases 10. Thomas, P. H., The Size of Flames from Natural Fires, Ninth Symposium (International) on Combus-
n of neutral pressure plane tion, The Combustion Institute, Pittsburgh, 1963, p.
w of window 844.
11. Sunavala, P. D., J. Znst. Fuel 40:492 (1967). 12. Morton, B. R., Taylor, G., and Turner, J. S., Proc.
REFERENCES
Roy. Soc. A234:l (1956).13. Emmons, H. W., Computer Fire Code (II), Harvard 1. Kawagoe, K., Fire Behaviour in Rooms, Building University, Division of Engineering, Applied Physics, Research Institute, Japan, report No. 27, 1958. Boston, Home Fire Project Technical report No. 20, 2. Thomas, P. H., Heselden, A. J. M., and Law, M., 1977, p. 85.
Fully-developed Compartment Fires-Two Kinds of Behaviour, JFRO, Fire Research technical paper
No. 18, 1967. Received 15 December 19 78; revised 28 May 19 79
-
*
1
T h i s publication i s being d i s t r i b u t e d by the Division of Building R e s e a r c h of the National R e s e a r c h Council of Canada. I t should not be r e p r o d u c e d in whole o r i n p a r t without p e r m i s s i o n of t h e o r i g i n a l p u b l i s h e r . T h e Di- v i s i o n would b e glad to b e of a s s i s t a n c e i n obtaining s u c h p e r m i s e i o n .
P u b l i c a t i o n s of the Division m a y be obtained by m a i l - ing the a p p r o p r i a t e r e m i t t a n c e (a Bank, E x p r e e s , o r P o s t Office Money O r d e r , o r a cheque, m a d e payable t o t h e R e c e i v e r G e n e r a l of Canada, c r e d i t NRC) t o t h e National R e s e a r c h Council of Canada, Ottawa. KIA 0 R 6 . S t a m p s a r e not a c c e p t a b l e .
A l i s t of a l l publications of the Division is available and m a y b e obtained f r o m the P u b l i c a t i o n s Section, Division of Building R e s e a r c h , National R e s e a r c h Council of Canada. Ottawa. KIA OR6.