Computational and Experimental Study of Instrumented
Indentation
by
Nuwong Chollacoop
B.S., Materials Science and Engineering, Brown University (1999)
Submitted to the Department of Materials Science and Engineering in partial fulfillment of the requirements for the degree of Doctor of Philosophy in Materials Science and Engineering
at the
MASSACHUSETTS INSTITUTE OF TECHNOLOGY February 2004
c
° Massachusetts Institute of Technology 2004. All rights reserved.
Author . . . . Department of Materials Science and Engineering
December 16, 2003
Certified by . . . . Subra Suresh Ford Professor of Engineering Thesis Supervisor
Accepted by . . . . Harry L. Tuller Professor of Ceramics and Electronic Materials Chair, Departmental Committee on Graduate Students
Computational and Experimental Study of Instrumented Indentation by
Nuwong Chollacoop
Submitted to the Department of Materials Science and Engineering on December 23, 2003, in partial fulfillment of the
requirements for the degree of
Doctor of Philosophy in Materials Science and Engineering
Abstract
The effect of characteristic length scales, through dimensional and microstructural miniatur-izations, on mechanical properties is systematically investigated by recourse to instrumented micro- and/or nanoindentation. This technique is capable of extracting mechanical prop-erties accurately down to nanometers, via rigorous interpretation of indentation response. Such interpretation requires fundamental understandings of contact mechanics and under-lying deformation mechanisms. Analytical, computational and experimental approaches are utilized to elucidate specifically how empirical constitutive relation can be estimated from the complex multiaxial stress state induced by indentation. Analytical formulations form a framework for parametric finite element analysis. The algorithms are established to predict indentation response from a constitutive relation (hereafter referred to as “forward algo-rithms”) and to extract mechanical properties from indentation curve (hereafter referred to as “reverse algorithms”). Experimental verifications and comprehensive sensitivity analysis are conducted. Similar approaches are undertaken to extend the forward/reverse algorithms to indentations using two ore more tip geometries.
Microstructural miniaturization leads to novel class of materials with a grain size smaller than 100 nm, hereafter referred to as “nanocrystalline” material. Its mechani-cal properties are observed to deviate greatly from the microcrystalline counterparts. In this thesis, experimental, analytical and computational approaches are utilized to elucidate the rate and size dependent mechanical properties observed in nanocrystalline materials. Indentations, as well as micro-tensile tests, are employed to attain various controllable deformation rates. A simple analytical model, hereafter referred to as Grain-Boundary-Affected-Zone (GBAZ) model, is proposed to rationalize possible rate-sensitivity mecha-nism. Systematic finite element analysis integrating GBAZ model is conducted with cali-bration against the experiments. The same GBAZ model, further utilized in the paramet-ric finite element study, is capable of predicting the inverse Hall-Petch-type phenomenon (weakening with decreasing grain size) at the range consistent with the literature.
Thesis Supervisor: Subra Suresh Title: Ford Professor of Engineering
Acknowledgments
“Only those who recognize help and support from others would succeed again.”
my beloved parents Every journey has to come to an end. And this is surely one of the most challenging and memorable journeys I have ever embarked on. It would not be completed without a consid-erable amount of help and support from everyone around me. I feel overwhelmingly grateful toward them, and this is the smallest thing I could perhaps do to show my appreciation.
First and foremost, I would like to thank my advisor, Professor Subra Suresh, for seeing the possibility in me and giving me the opportunity. His academic guidance, inspiration and consolation are well beyond my words. His endless patience and encouragement have kept me progressing throughout the up and down cycles till my success today.
Furthermore, I would like to thank Professor Merton Corson Flemings and Professor Lorna J. Gibson for dedicating their valuable times to serve on my thesis committee. Their suggestions and supports are greatly appreciated.
My former academic advisor during my undergraduate study at Brown University, Pro-fessor K. Sharvan Kumar, is the first person to expose me to this wonderfully amazing field of study and help me throughout my undergraduate study, both academically and personally. I would not be getting into MIT at the first place without him.
Next person who is solely responsible for sharpening my computer simulation skill is Dr. Ming Dao. His never-ending effort to teach me ABAQUS has never been less exciting. Long hour discussion, definitely not in the morning, has always been intellectually stimulating and challenging. He is simply the great person to work with, and it has been my pleasure to get to know and work closely with him all along my graduate study.
All members of Suresh Group (previously Laboratory for EXperimental and COmpu-tation Micromechanics or LEXCOM) during my stay at MIT certainly make me welcomed and ever want to come to work everyday. Lab manager George LaBonte is the most knowl-edgeable person I have ever known when it comes down to anything hand-on. Try asking him anything and he will find the answer for you. Also, thanks for his home-grown tomatoes and occasionally home-made desserts from Doranna.
work. He is probably the first person who can remember my long last name before my first name. His incredibly friendly personality has eased my initial transition to MIT. Our conversation prior to my meeting with Subra has been entertaining.
Professor Andrew Gouldstone is one of the most considerate, energetic and self-motivated persons I have ever known. He is not only my academic mentor but also my first and best lifting partner (except when he forces me to do squat). He has always been helping me out during my academic and personal hardships. He is the first non-Thai person that I think of when I need consultation.
Professor Krystyn J. Van Vliet has tremendously helped me with her experimental, presentation and writing skills. Her persistent academic enthusiasm and excitement have positively influenced my motivation. Also, it has been enjoyable exchanging Microsoft Excel tricks with her.
Dr. Tae-Soon Park and Dr. Yoonjoon Choi have proven my hypothesis that all Koreans work hard. Due to their typically late night staying, I often bother them with some academic questions and personal conversations. We have also shared the love for food and beer.
Timothy Hanlon is one of the most self-disciplined graduate students I have ever known. We have become so close after he has moved into the cubicle next to mine. His help in recent years is greatly appreciated, especially for making sure that I wake up in time for a morning meeting.
Professor Antonios E. Giannakopoulos, Professor T. A. Venkatesh, Dr. Yong-Nam Kwon, Dr. Benedikt Moser, Dr. Ruth Schwaiger and Professor Upadrasta Ramamurty have variously helped me in different parts of my thesis. Their intellectual contributions are greatly appreciated.
I would like to also thank Laurent Chambon, Dr. 1st Lt. Brett P. Conner, John Philip
Mills, Simon C. Bellemare, Bruce Y. Wu and In-Suk Choi for their warm friendship in the basement office.
Within DMSE, Kathleen R. Farrell, Gloria Landahl, Angelita Mireles, Stephen J. Mal-ley, Coleman Greene, Gerald Hughes, Jenna Picceri and Yinlin Xie have helped me through-out my study at MIT. Many thanks to my first year study group, Douglas Dale Cannon, Burke C. Hunsaker, Ashley P Predith and Marc Richard, who have helped me getting through all first-year courses and general written examination.
Thanks to all DMSE Thai folks−Dr. Pimpa Limthongkul, Dr. Ariya Akthakul, Dr. Yot Boontongkong, Jessada Wannasin, Panitarn Wanakamol, Ratchatee Techapiesancharoenkij, Wanida Pongsaksawad, Samerkhae Jongtammanurak and Yuttanant Boonyongmaneerat-−and other members of TSMIT (Thai Student at MIT), whose names cannot be listed here due to an insufficient space, for their moral supports throughout my graduate study.
I would like to extend my appreciation toward my Thai Scholars’ 1994 friends, especially Peerapong Phimonwichayakit, Charatpong Chotigavanich, Songpon Deechongkit, Athicha Muthitacharoen, Namon Yuthavong, Mali Chivakul, Kittipitch Kuptavanich and Pitiporn Phanaphat, for making me feel warm and welcome during my first year in the United States. In addition, I would like to thank Royal Thai Government and my contract co-signers−Uncle Niwat Wachirawarakarn, Aunt Suree Khutaweekul and Arjan Komkum Deewongsa−for giving me an opportunity to study abroad.
There is no other support more meaningful than that from the family. With my deepest gratitude, I would like to thank my parents for everything they have ever done for me. Their beliefs in me have strongly encouraged me to strive for my seemingly impossible goals. They have shown me by their excellent examples of how to make everyday the best day to come, and over time have taught me how to be a better person. Their love, care and support are unconditionally abundant. They are always there throughout my miserable and exultant times. I am blessed and fortunate to have them as my parents. Mom and dad, I dedicate this thesis for you.
Next are my elder sister (P’Kung) and elder brother (P’Kai), who have always looked after me and not once hesitated to help me in any possible way. Had it not been P’Kung who spent hours after hours tutoring me during my early ages, I would not achieve this far. Her sacrifice and favor for two younger brothers have never stopped since I could remember. As for P’Kai, his astoundingly intrinsic talent and perseverance have effectively motivated me to try harder where I fail and make it happen. He is the perfect example for the phases, “Everything can be learned” or “Proper prioritization leads to success”. Also, thanks to my great aunt (E’Po+) for making sure that I never go hungry with her presence.
Further thanks to Arjan Komkum Deewongsa, who is like a mother to me, for her enduring love and help since my high school year. I would never be awarded Royal Thai scholarship without her.
Last but certainly not least, I would like to specially thank my future wife, Jaturada Aksharanugraha (Bo), for allowing me to enter her life, accepting me for who I am and believing in me. Her love, understanding and sacrifice for me are beyond my words. She is every reason I open my eyes in the morning and close my eyes at night. And I am looking forward to sharing the future with her for many years to come. Also, thanks to her parents for raising such a wonderful daughter and embracing me into the family.
Contents
1 Introduction 21
2 Computational Modeling of the Forward and Reverse Problems in
Instru-mented Sharp Indentation 25
2.1 Introduction . . . 26
2.2 Theoretical and Computational Considerations . . . 28
2.2.1 Problem Formulation and Associated Nomenclature . . . 28
2.2.2 Dimensional Analysis and Universal Functions . . . 31
2.2.3 Computational Model . . . 34
2.2.4 Comparison of Experimental and Computational Results . . . 37
2.2.5 Large Deformation vs. Small Deformation . . . 39
2.3 Computational Results . . . 41
2.3.1 Representative Strain and Universal Dimensionless Functions . . . . 41
2.3.2 Forward Analysis Algorithms . . . 48
2.3.3 Reverse Analysis Algorithms . . . 50
2.4 Discussion of Uniqueness, Sensitivity and Representative Strains . . . 58
2.4.1 Uniqueness in Forward and Reverse Analyses . . . 58
2.4.2 Sensitivity to Forward Analysis, Reverse Analysis and Apex Angle . 60 2.4.3 Representative Strains . . . 64
2.5 Conclusions . . . 67
3 Depth-Sensing Instrumented Indentation with Dual Sharp Indenters 71 3.1 Introduction . . . 72
3.2 Framework for Analysis . . . 73
3.2.1 Problem Formulation and Nomenclature . . . 73
3.2.2 Dimensional Analysis and Universal Functions . . . 74
3.2.3 Computational Model . . . 75
3.2.4 Comparison of Experimental and Computational Results . . . 76
3.3 Computational Results . . . 76
3.3.1 Representative Strain and Dimensionless Function Π1 as a Function of Indenter Geometry . . . 78
3.3.2 Forward Analysis Algorithms . . . 80
3.3.3 Reverse Analysis Algorithms . . . 82
3.4 Uniqueness of the Dual-Indentation Forward and Reverse Analysis . . . 88
3.4.1 Uniqueness of the Forward Analysis . . . 88
3.4.2 Uniqueness of the Reverse Analysis . . . 88
3.5.1 Sensitivity of the Forward Analysis . . . 89
3.5.2 Sensitivity of the Reverse Analysis . . . 90
3.6 Extension to Multiple-Indentation Analysis . . . 92
3.7 Conclusions . . . 92
4 Experimental Assessment of the Representative Stress Estimates from the Instrumented Sharp Indentation 97 4.1 Introduction . . . 98
4.2 Theoretical Background . . . 99
4.3 Experiments . . . 101
4.4 Results and Discussions . . . 104
4.5 Conclusions . . . 106
5 Computational Modeling of Nanocrystalline Materials 111 5.1 Introduction . . . 112
5.2 Experimental details . . . 114
5.2.1 Materials and specimen preparation . . . 114
5.2.2 Indentation test methods . . . 115
5.2.3 Tensile test methods . . . 117
5.3 Results . . . 117
5.3.1 Constant strain-rate indentation experiments . . . 118
5.3.2 Constant load-rate indentation experiments . . . 118
5.4 Discussion . . . 120
5.4.1 Experimental Trends . . . 120
5.4.2 Computational Model . . . 124
5.5 Inverse Hall-Petch-Type Phenomenon . . . 133
5.6 Conclusions . . . 140
6 Concluding Remarks and Suggestions for Future Work 143 A Dimensionless Functions 147 A.1 Single Indentation Algorithms . . . 147
A.2 Dual Indentation Algorithms . . . 148
B Microsoftr Excel Program for Automatic Forward/Reverse Analysis 151 B.1 Requirement . . . 152
B.2 Forward Algorithms . . . 155
List of Figures
2-1 Schematic illustration of a typical P −h response of an elasto-plastic material
to instrumented sharp indentation. . . 29
2-2 The power law elasto-plastic stress-strain behavior used in the current study. 30
2-3 Computational modeling of instrumented sharp indentation. (a) Schematic drawing of the conical indenter, (b) mesh design for axisymmetric finite el-ement calculations, (c) overall mesh design for the Berkovich indentation calculations, and (d) detailed illustration of the area that directly contacts
the indenter tip in (c). . . 35
2-4 Experimental uniaxial compression stress-strain curves of both 6061-T651
aluminum and 7075-T651 aluminum specimens, respectively. . . 38
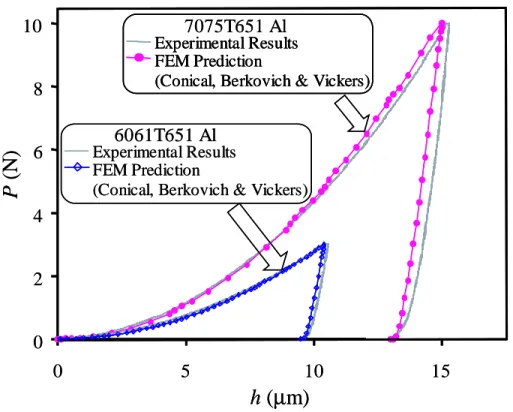
2-5 Experimental versus computational indentation responses of both the
7075-T651 aluminum and 6061-7075-T651 aluminum specimens, respectively. . . 38
2-6 Contour plot of the equivalent plastic strain (PEEQ) within the 7075-T651 aluminum near the tip of the conical indenter, indicating that the majority of the volume directly beneath the indenter experienced strains exceeding 15%. 39 2-7 Comparison between the large deformation solution, small deformation
solu-tion and the previous formulasolu-tion (Eq. (2.23)) using four model materials. For all four cases studied, large deformation theory always predicts a stiffer
2-8 Dimensionless function Π1 constructed using three different values of εr(i.e.,
εp = 0.01, 0.033 and 0.29) and the corresponding σr, respectively. For εr <
0.033, Π1 increased with increasing n; for εr > 0.033, Π1 decreased with
increasing n. A representative plastic strain εr = 0.033 can be identified as
a strain level which allows for the construction of Π1 to be independent of
strain hardening exponent n. . . . 43
2-9 For a given value of E∗, all power law plastic, true stress-true strain responses
that exhibit the same true stress at 3.3% true plastic strain give the same indentation loading curvature C. A collection of such plastic stress-strain
curves are schematically illustrated in the figure. . . 44
2-10 Dimensionless functions (a) Π2
³ E∗ σr, n ´ and (b) Π3 ¡σ r E∗, n ¢ . . . 45
2-11 Dimensionless functions (a) Π4
³ hr hm ´ and (b) Π5 ³ hr hm ´ . . . 46
2-12 Forward Analysis Algorithms . . . 49
2-13 Reverse Analysis Algorithms . . . 52
2-14 Dimensionless functions (a) Π7¡σy
E, n ¢ and (b) Π0 7 ³ hr hm, n ´ . . . 55 2-15 Dimensionless function Π8 ³ hr hm, n ´ . . . 56
2-16 Schematic illustration of indentation at maximum load showing contact height
hcfor a pile-up case. . . 56
2-17 Sensitivity charts for reverse analysis showing the average variations in (a)
E∗, (b) σ
0.033, (c) σyand (d) pavedue to ±4% perturbation in C (solid line),
dP dh ¯ ¯
hm (dotted line) and
Wp
Wt (dash-dotted line), with the error bar indicating
99% confidence interval. . . 62
2-18 Sensitivity of (a) loading curvature C and (b) plastic work ratio Wp
Wt to
varia-tions in apex angle for four model materials. A two-degree variation in apex angle resulted in 15-20% variations in loading curvature C and up to 6%
variations in plastic work ratio Wp
2-19 Dimensionless function Π9. A best fit function within a ±5.96% error was
achieved with a representative plastic strain εr= 0.082 and its corresponding
stress σ0.082 . . . 67
3-1 Schematic drawing of the customized 60o cone and 60o cone equivalent
3-sided pyramid with the appropriate angles such that the projected area at a
given depth is the same. . . 75
3-2 Experimental (Berkovich and 60o cone tips) versus computational
indenta-tion responses of both (a) 6061-T651 and (b) 7075-T651 aluminum specimens. 77 3-3 (a) A relationship between representative strain and indenter apex angle. (b)
A generalized dimensionless function Π1θ for θ = 50o, 60o, 70.3o and 80o. . 79
3-4 Dual Indentation Forward Analysis Algorithms. . . 81
3-5 Dual Indentation Reverse Analysis Algorithms. . . 85
3-6 An example of the uniqueness problem solved by the second indenter. . . . 89
3-7 Sensitivity charts for reverse analysis showing the average variations in (a)
σ0.057 and (b) σy due to ±4% perturbation in Ca (solid line), dPdh
¯ ¯
hm
(dot-ted line), Wp
Wt (dash-dotted line) and Cb (long-dash line), with the error bar
indicating 99% confidence interval. . . 91
3-8 Multiple Indentation Reverse Analysis Algorithms. . . 93
4-1 Experimental uniaxial tension true stress-true strain responses of (a) copper and (b) aluminum samples with the best power law fit and the pre-strain value projected down on strain axis. . . 103 4-2 Experimental indentation responses (each illustrated by the average with the
error bar of 99% confidence interval from 6 tests) under both Berkovich and
60ocone equivalent three-sided pyramid tips for (a) copper and (b) aluminum
4-3 The prediction of (a) reduced Young’s modulus (the experimental values from
uniaxial tensile test span over ±1 standard deviation), (b) σ0.033 and (c)
σ0.057of copper and aluminum specimens from the single and dual indenters
reverse algorithms [22, 39, 59] (each illustrated by the average with the error bar indicating the standard deviation, along with the experimental values from uniaxial tensile test). . . 107 4-4 Experimental uniaxial tension true stress-true strain responses of (a) copper
and (b) aluminum samples with the best power law fit and reverse algorithms
prediction of σ0.033and σ0.057. Each prediction illustrated by the average with
the error bar indicating the standard deviation. . . 108
5-1 Load-displacement (P −h) curves of the (a) ufc Ni (320 nm grain size) and (b) nc Ni (40 nm grain size). The average curve including error bars (95% confi-dence interval) of 10 and 5 curves, respectively, at three different indentation strain rates is shown. . . 119 5-2 Hardness versus indentation depth for nc and ufc Ni. The hardness was
determined continuously during indentation for three different indentation strain rates. The average of 10 and 5 indents for ufc and nc Ni, respectively, are shown. . . 120 5-3 Load-displacement (P −h) curves of the (a) ufc Ni (320 nm grain size) and (b)
nc Ni (40 nm grain size). The average curves of 10 and 5 curves, respectively, at four different load rates are shown. . . 121 5-4 Hardness versus load rate for nc and ufc Ni at h = 2800 nm. The hardness
was determined at the indentation depth at maximum load for four different load rates (3.84, 12.0, 40.53, and 186.12 mN/s). The average of 10 indents for ufc and nc Ni are shown. . . 122
5-5 Stress versus strain (a) for nc, ufc, and mc Ni at a strain rate ˙ε = 3×10⁻¹s−1
5-6 Schematic illustration of the computational model. (a) Linear hardening con-stitutive behavior for both the grain interior and the GBAZ with the initial
yield stress σy and a strain-hardening rate θ. Material failure/damage
un-der tension is assumed to initiate from εp = εf, and the material strength
drops linearly to a residual strength of σr(∼0) within an additional strain
of ∆εf. (b) Two-dimensional grains of hexagonal shape separated by the
GBAZ preserving crystallinity to the atomically sharp grain boundary. Peri-odic boundary conditions were applied and a unit cell model was used in all computations. . . 127 5-7 Computational stressstrain curves at three different strain rates for (a) ufc
Ni and (b) nc Ni. . . 129 5-8 Computational P − h curves for nc Ni obtained at (a) three different
inden-tation strain rates and (b) four different load rates. . . 130 5-9 Comparison of experimental and computational results for tensile tests of nc
and ufc Ni. The 1% offset yield stress and the strain at TS are shown versus strain rate. . . 131 5-10 Literature data for microstructured Nickel superimposed with Hall-Petch
re-lation. . . 134 5-11 Normalized 1% offset flow stress versus grain size for various assumptions
and strain rates. . . 136 5-12 Contour plot of equivalent plastic strain assuming theoretical strength for
grain interior with GBAZ fractions of (a) 2% and (b) 25%, both at a strain
rate of 4.2×10⁻⁴ s−1. . . 136
5-13 Contour plot of equivalent plastic strain assuming Hall-Petch yield strength for grain interior with GBAZ fractions of (a) 5%, (b) 25% and (c) 50%, all
shown at a strain rate of 4.2×10⁻⁴ s−1. Note the gray region denotes PEEQ
5-14 Comparison of strength predicted by rule of mixture and GBAZ unit cell model. . . 139
B-1 Schematic overview of Microsoft Excel Macro program coded for Forward/Reverse algorithms: a) front introductory page, (b) forward analysis, (c)-(h) reverse analysis and (i) last reference page . . . 153 B-2 Zoom in of Fig. B-1(a) showing the worksheet “Cover” of the Macro program 154 B-3 Zoom in of Fig. B-1(b) showing the worksheet “Forward Analysis” of the
Macro program . . . 154 B-4 Zoom in of Fig. B-1(c1) showing the worksheet “GenericData” of the Macro
program . . . 159 B-5 Zoom in of Fig. B-1(c2) showing the worksheet “NanoTestData” of the Macro
program . . . 160 B-6 Zoom in of Fig. B-1(d) showing the worksheet “ColumnData” of the Macro
program . . . 161 B-7 Zoom in of Fig. B-1(e) showing the worksheet “RawDataManipulation” of
the Macro program . . . 162 B-8 Zoom in of Fig. B-1(f) showing the worksheet “P-h Curve” of the Macro
program . . . 163 B-9 Zoom in of Fig. B-1(g) showing the worksheet “Reverse Analysis” of the
Macro program . . . 163 B-10 Zoom in of Fig. B-1(h) showing the worksheet “RevMultiple” of the Macro
program . . . 164 B-11 Zoom in of Fig. B-1(i) showing the worksheet “Credits” of the Macro program165
List of Tables
2.1 Four cases studied to compare large vs small deformation theory. . . 41
2.2 Elasto-plastic parameters used in the present study (ν is fixed at 0.3) For each of the 19 cases below, strain-hardening exponent n is varied from 0, 0.1, 0.3 to 0.5, resulting a total of 76 different cases . . . 42
2.3 The values of c∗ used in the current study. . . 48
2.4 Mechanical property values used in forward analysis. . . 50
2.5 Forward analysis results on (a) Al 6061-T651 and (b) Al 7075-T651 (max. load = 3 N). . . 51
2.6 Reverse analysis on (a) Al 6061-T651 and (b) Al 7075-T651 (max. load = 3 N; assume ν = 0.3). . . . 53
2.7 Uniqueness of reverse analysis . . . 59
2.8 Sensitivity to reverse analysis . . . 61
2.9 Apex angle sensitivity of A, B, C, and D (four cases) . . . 63
3.1 Forward analysis on Al 6061-T651 indentation experiments using (a) Berkovich (max. load = 3 N) (b) 60o cone (max. load = 1.8 N) and (c) 60o cone equiv-alent 3-sided pyramid (max. load = 1.8 N). . . 83
3.2 Forward analysis on Al 7075-T651 indentation experiments using (a) Berkovich
(max. load = 3 N) and (b) 60o cone equivalent 3-sided pyramid (max. load
= 3 N). . . 84
3.3 Dual Indentation Reverse analysis on (a) Al 6061-T651 and (b) Al 7075-T651
(assume ν = 0.3). . . . 87
3.4 Normalized Standard Deviations in Properties Estimation using Dual
Inden-tation Reverse Algorithm . . . 90
4.1 Averaged mechanical property determined from experimental tensile test. . 102 4.2 Maximum true stress and true strain from the tensile test of each strained
specimen prior to indentation. . . 104
5.1 Estimation of the volume percentage of the GBAZ. . . 125 5.2 Materials parameters used in the model. Refer to Eq. (5.4) and Fig. 5-6 . . 126 5.3 FEM parameter study for size effect. . . 135
Chapter 1
Introduction
Current trends in the microelectronic, tribological coating and biomedical industries are driving characteristic dimensions and microstructures of engineered materials and systems down to the microscopic and nanoscopic size scales. The mechanical properties of such materials have been observed to deviate greatly from those of their conventional counter-parts, ostensibly due to confined dimensions (e.g. in coating) and confined microstructures (e.g in ultra-fine crystalline and nanocrystalline materials with grain sizes of 100-1000 nm and less than 100 nm, respectively). To design the devices at this length scales against mechanical failure during fabrication and operation, their mechanical properties need to be accurately determined in a systematic manner, both prior to and during their services. Among many other mechanical testing techniques, depth-sensing instrumented indentation provides a convenient method to precisely assess the mechanical behavior of such materials, by recourse to careful interpretation of a force-depth (P − h) response.
Over the past few decades, indentation has rapidly gained its reputation for ver-satile property extraction due to its flexible specimen requirement, non-destructive testing and ability to probe localized properties. In particular, indentation has frequently proved to be the only means available to extract mechanical properties from sophisticated, con-strained material systems (e.g. multilayered metallization in ultra large scale integration (ULSI) devices); novice material systems which are difficult, if not impossible, to produce in bulk quantities (e.g. nanocrystalline materials); or embedded feature in microstructure
(e.g. connecting ligaments in foam). Despite the extensive range of applications, precise interpretation of the indentation curves is necessary for this technique to become a viable method of mechanical property determination. Interpretation of such curves involves an understanding of contact mechanics and fundamental mechanisms which define the defor-mation behavior of the materials involved.
To this end, analytical, computational and experimental approaches are utilized to elucidate the contact mechanics complexity during indentation, specifically how empirical constitutive relation can be estimated from the intricate multiaxial stress state induced by indentation. An analytical expression for Young’s modulus is further developed from solu-tions of an elastic half space being indented by a rigid, axially symmetric punch [1]. On the other hand, analytical expressions for plastic information rely on a self-similar solution of an elasto-plastic material under spherical indentation [2] and sharp (i.e. Vickers and Berkovich) indentation [3, 4]. Using dimensional analysis, closed-form analytical functions can be iden-tified correlating empirical constitutive description to indentation response. Coefficients of these dimensionless functions are accurately determined by recourse to systematic finite element analysis of indentation computational modeling. Further rearrangements of these functions reveal
• forward algorithms that predict an indentation response from an empirical constitutive relation, and
• reverse algorithms that predict an empirical constitutive relations from an indentation response.
In addition, experimental indentations of materials, whose mechanical properties are known a priori, are conducted to verify the forward/reverse algorithms. Similar approaches are pursued to extend the algorithms to dual indenters or more.
In addition to dimensional miniaturization, indentation is often employed to analyze the effect of microstructural miniaturization (e.g. in ultra-fine crystalline and nanocrys-talline materials). These novice material systems have been recognized for their appealing mechanical properties [5–21], such as increased yield strength/hardness/fracture strength,
superior resistance to wear/corrosion/crack initiation, and pronounced rate sensitivity (in-creased strength with increasing strain rate), among many others. Despite recent progress within the context of nanocrystalline materials, fundamental understandings of mechanisms underlying the mechanical properties are not clear, if not conflicting (e.g. experimental data on the strain-rate sensitivity of nanocrystalline metals by [7, 8]). Hence, quantitative con-clusion cannot be drawn from the vast amount of literature data. Cautious analysis of the literature data reveals that inconsistency may arise from the different testing techniques chosen to attain various strain rates. To minimize the artifacts, rate-sensitive data should be collected from the same experimental setup.
To this end, experimental, analytical and computational approaches are utilized to elucidate the effect of rate sensitivity on the mechanical properties of nanocrystalline mate-rials. In addition to the micro-tensile test, indentation has yet again proved ambidextrous due to its ability to vary controllable load/strain rate within the same experimental setup. A simple analytical model (called Grain-Boundary-Affected-Zone model, see Chapter 5), which is predicated upon the premise that grain boundary is atomically sharp and atoms nearby grain boundary are more likely to move, is proposed. Systematic finite element anal-ysis integrating GBAZ model is conducted with calibration against the experiments. The properly configured GBAZ model is then rationalized for the possible mechanism governing rate-sensitivity in nanocrystalline materials. The same GBAZ model is further illustrated with the capability to predict the observed size effect, namely inverse Hall-Petch-type phe-nomenon (see Section 5.5), at the critical grain size range consistent with experimental and atomistic calculation results reported in the literature..
The main objective of this thesis is to use computational tool (within the context of finite element analysis), based on analytical formulations and guided by the relevant experiments, to quantify the effect of size scales on the mechanical properties. The compu-tational modeling is focused on instrumented indentations with single or dual indenter(s), and deformation mechanism in nanocrystalline materials. The thesis is organized in the following manner:
§ Chapter 2 presents a systematic parameter study of indentation simulation within the context of finite element analysis and theoretical framework. Using dimensional
analysis, the forward and reverse algorithms are proposed with experimental verifica-tions, and the comprehensive sensitivity analysis is conducted. Significant issues, e.g. representative strain and uniqueness of the prediction, are discussed in details. § Chapter 3 extends the proposed algorithms in Chapter 2 to indentation using two or
more indenters, by recourse to similar approach. Improvement over single indentation algorithms is discussed with regard to uniqueness and sensitivity. Possible extension to multiple indenters algorithms is explored.
§ Chapter 4 presents the experimental assessment of the representative stresses esti-mated from the instrumented sharp indentation using previously proposed algorithms in Chapters 2 and 3. The representative stress concept may be utilized to construct the entire stress-strain curve, provided that multiple indentations are conducted on the target material with different levels of known plastic pre-strain.
§ Chapter 5 proposes the possible mechanism for rate-sensitivity observed in nanocrys-talline materials, by recourse to systematic finite element analysis of newly devel-oped Grain Boundary Affected Zone (GBAZ) model, whose parameters are calibrated against the experiments. The same GBAZ model is shown with consistency to size effect observed (namely inverse Hall-Petch-type phenomenon) in the literature. § Chapter 6 presents a summary of conclusions and discusses directions of the future
Chapter 2
Computational Modeling of the
Forward and Reverse Problems in
Instrumented Sharp Indentation
In this chapter∗, a comprehensive computational study was undertaken to identify the
extent to which elasto-plastic properties of ductile materials could be determined from in-strumented sharp indentation and to quantify the sensitivity of such extracted properties to variations in the measured indentation data. Large deformation finite element computations were carried out for 76 different combinations of elasto-plastic properties that encompass the wide range of parameters commonly found in pure and alloyed engineering metals;
Young’s modulus, E, was varied from 10 to 210 GPa, yield strength, σy, from 30 to 3000
MPa, and strain hardening exponent, n, from 0 to 0.5, and the Poisson’s ratio, ν, was fixed at 0.3. Using dimensional analysis, a new set of dimensionless functions was constructed to characterize instrumented sharp indentation. From these functions and elasto-plastic finite element computations, analytical expressions were derived to relate indentation data to elasto-plastic properties. Forward and reverse analysis algorithms were thus established; the forward algorithms allow for the calculation of a unique indentation response for a given set of elasto-plastic properties, whereas the reverse algorithms enable the extraction ∗This article is published in Acta. Mater., Vol. 49 (2001), p. 3899, with co-authors: M. Dao, K. J. Van Vliet, T. A. Venkatesh and S. Suresh. [22]
of elasto-plastic properties from a given set of indentation data. A representative plastic
strain εrwas identified as a strain level which allows for the construction of a dimensionless
description of indentation loading response, independent of strain hardening exponent n. The proposed reverse analysis provides a unique solution of the reduced Young’s modulus
E∗, a representative stress σ
r, and the hardness pave. These values are somewhat sensitive
to the experimental scatter and/or error commonly seen in instrumented indentation. With
this information, values of σy and n can be determined for the majority of cases considered
here provided that the assumption of power law hardening adequately represents the full uniaxial stress-strain response. These plastic properties, however, are very strongly influ-enced by even small variations in the parameters extracted from instrumented indentation experiments. Comprehensive sensitivity analyses were carried out for both forward and reverse algorithms, and the computational results were compared with experimental data for two materials.
2.1
Introduction
The mechanical characterization of materials has long been represented by their hardness values [23, 24]. Recent technological advances have led to the general availability of depth-sensing instrumented micro- and nanoindentation experiments (e.g., [23–36]). Nanoinden-ters provide accurate measurements of the continuous variation of indentation load P down to micro-Newtons, as a function of the indentation depth h down to nanometers. Ex-perimental investigations of indentation have been conducted on many material systems to extract hardness and other mechanical properties and/or residual stresses (e.g., [25– 27, 31, 35–39, 43, 44], among many others).
Concurrently, comprehensive theoretical and computational studies have emerged to elucidate the contact mechanics and deformation mechanisms in order to systematically extract material properties from P versus h curves obtained from instrumented indentation (e.g., [3, 25, 27, 33, 34, 38–42]. For example, the hardness and Young’s modulus can be ob-tained from the maximum load and the initial unloading slope using the methods suggested by Oliver and Pharr [27] or Doerner and Nix [25]. The elastic and plastic properties may be computed through a procedure proposed by Giannakopoulos and Suresh [41], and the
residual stresses may be extracted by the method of Suresh and Giannakopoulos [43, 44]. Thin film systems have also been studied using finite element computations [45–47].
Using the concept of self-similarity, simple but general results of elasto-plastic in-dentation response have been obtained. To this end, Hill et al. [2] developed a self-similar solution for the plastic indentation of a power law plastic material under spherical
indenta-tion, where Meyer’s law† was given a rigorous theoretical basis. Later, for an elasto-plastic
material, self-similar approximations of sharp (i.e., Berkovich and Vickers) indentation were computationally obtained by Giannakopoulos et al. [3] and Larsson et al. [4]. More recently, scaling functions were applied to study bulk [33, 34, 40] and coated material systems [47].
Kick’s Law (i.e., P = Ch2 during loading, where loading curvature C is a material constant)
was found to be a natural outcome of the dimensional analysis of sharp indentation (e.g., [33]).
Despite these advances, several fundamental issues remain that require further ex-amination:
1. A set of analytical functions, which takes into account the pile-up/sink-in effects and the large deformation characteristics of the indentation, needs to be established in order to avoid detailed FEM computations after each indentation test. These functions can be used to accurately predict the indentation response from a given set of elasto-plastic properties (forward algorithms), and to extract the elasto-plastic properties from a given set of indentation data (reverse algorithms). Giannakopoulos, Larsson and Vestergaard [3] and later Giannakopoulos and Suresh [41] proposed a comprehensive analytical framework to extract elasto-plastic properties from a single set of P − h data. Their results, as will be shown later in this study, were formulated using mainly small deformation FEM results (although they performed a number of large deformation computations). Cheng and Cheng [33, 34, 40], using an included
apex angle of the indenter of 68o, proposed a set of universal dimensionless functions
based on large deformation FEM computations, but did not establish a full set of closed-form analytical functions.
†Meyer’s law for spherical indentation states that P = Kam
Dm−2 , where m is a hardening factor, D is the
2. Under what conditions and/or assumptions can a single set of elasto-plastic proper-ties be extracted from a single P − h curve with reasonable accuracy? Cheng and Cheng [40] and Venkatesh et al. [42] discussed this issue. However, without an ac-curate analytical framework based on large deformation theory, this issue can not be addressed.
3. What are the similarities and differences between the large and small deformation-based analytical formulations? Chaudhri [48] estimated that equivalent strains of 25% to 36% were present in the indented specimen near the tip of the Vickers indenter. These experimentally observed large strains justify the need for large deformation based theories in modeling instrumented sharp indentation tests.
In this paper, these issues will be addressed within the context of sharp indentation and continuum analysis.
2.2
Theoretical and Computational Considerations
2.2.1 Problem Formulation and Associated Nomenclature
Figure 2-1 shows the typical P −h response of an elasto-plastic material to sharp indentation. During loading, the response generally follows the relation described by Kick’s Law,
P = Ch2 (2.1)
where C is the loading curvature. The average contact pressure, pave = APmm (Am is the
true projected contact area measured at the maximum load Pm), can be identified with the
hardness of the indented material. The maximum indentation depth hm occurs at Pm, and
the initial unloading slope is defined as dPu
dh ¯ ¯
hm, where Pu is the unloading force. The Wt
term is the total work done by load P during loading, We is the released (elastic) work
during unloading, and the stored (plastic) work Wp = Wt− We. The residual indentation
P
(L
o
ad
)
h (Depth)
h
rh
mP
mW
pW
edh
dP
uh
mW
t= W
p+ W
eP = C h
2P
(L
o
ad
)
h (Depth)
h
rh
mP
mW
pW
edh
dP
uh
mdh
dP
uh
mW
t= W
p+ W
eP = C h
2Figure 2-1: Schematic illustration of a typical P − h response of an elasto-plastic material to instrumented sharp indentation.
As discussed by Giannakopoulos and Suresh [41], C, dPu
dh ¯ ¯
hm and
hr
hm are three
inde-pendent quantities that can be directly obtained from a single P − h curve. The question remains whether these parameters are sufficient to uniquely determine the indented mate-rial’s elasto-plastic properties.
Plastic behavior of many pure and alloyed engineering metals can be closely ap-proximated by a power law description, as shown schematically in Fig. 2-2. A simple elasto-plastic, true stress-true strain behavior is assumed to be
σ = Eε for σ 6 σy Rεn for σ > σ y (2.2)
where E is the Young’s modulus, R a strength coefficient, n the strain hardening exponent,
σy the initial yield stress and εy the corresponding yield strain, such that
σ
= R
ε
n
σ
yε
σ
p
ε
y E E 1σ
rε
rFigure 2-2: The power law elasto-plastic stress-strain behavior used in the current study.
Here the yield stress σy is defined at zero offset strain. The total effective strain, ε, consists
of two parts, εy and εp:
ε = εy+ εp (2.4)
where εp is the nonlinear part of the total effective strain accumulated beyond εy. With
Eqs. (2.3) and (2.4), when σ > σy, Eq. (2.2) becomes
σ = σy µ 1 + E σyεp ¶n (2.5)
To complete the material constitutive description, Poisson’s ratio is designated as ν, and the
incremental theory of plasticity with von Mises effective stress (J2 flow theory) is assumed.
With the above assumptions and definitions, a material’s elasto-plastic behavior is
fully determined by the parameters E, n, σy and n. Alternatively, with the constitutive
law defined in Eq. (2.2), the power law strain hardening assumption reduces the mathe-matical description of plastic properties to two independent parameters. This pair could
be described as a representative stress σr (defined at εp = εr, where εr is a representative
strain) and the strain-hardening exponent n, or as σy and σr.
2.2.2 Dimensional Analysis and Universal Functions
Cheng and Cheng [33, 34] and Tunvisut et al. [47] have used dimensional analysis to propose a number of dimensionless universal functions, with the aid of computational data points calculated via the Finite Element Method (FEM). Here, a number of new dimensionless functions are described in the following paragraphs.
As discussed in Section 2.2.1, one can use a material parameter set (E, ν, σy and
n), (E, ν, σr and n) or (E, n, σy and σr) to describe the constitutive behavior. Therefore, the specific functional forms of the universal dimensionless functions are not unique (but different definitions are interdependent if power law strain hardening is assumed). For instrumented sharp indentation, a particular material constitutive description (e.g., power-law strain hardening) yields its own distinct set of dimensionless functions. One may choose
to use any plastic strain to be the representative strain εr, where the corresponding σr is
used to describe the dimensionless functions. However, the representative strain which best normalizes a particular dimensionless function with respect to strain hardening will be a distinct value.
The following section presents a set of universal dimensionless functions and their closed-form relationship between indentation data and elasto-plastic properties (within the context of the present computational results). This set of functions leads to new algorithms for accurately predicting the P − h response from known elasto-plastic properties (forward algorithms) and new algorithms for systematically extracting the indented material’s elasto-plastic properties from a single set of P − h data (reverse algorithms).
For a sharp indenter (conical, Berkovich or Vickers, with fixed indenter shape and tip angle) indenting normally into a power law elasto-plastic solid, the load P can be written as
where Eiis Young’s modulus of the indenter, and νiis its Poisson’s ratio. This functionality is often simplified (e.g., [49]) by combining elasticity effects of an elastic indenter and an elasto-plastic solid as P = P (h, E∗, σy, n), (2.7) where E∗ = · 1 − ν2 E + 1 − νi2 Ei ¸−1 (2.8) Alternatively, Eq. (2.7) can be written as
P = P (h, E∗, σr, n), (2.9)
or
P = P (h, E∗, σy, σr), (2.10)
Applying the Π theorem in dimensional analysis, Eq. (2.9) becomes
P = σrh2Π1 µ E∗ σr, n ¶ (2.11) and thus C = P h2 = σrΠ1 µ E∗ σr, n ¶ (2.12)
where Π1 is a dimensionless function. Similarly, applying the Π theorem to Eq. (2.10),
loading curvature C may alternatively be expressed as
C = P h2 = σyΠ A 1 µ E∗ σy ,σr σy ¶ (2.13)
or C = P h2 = σrΠB1 µ E∗ σr, σy σr ¶ (2.14)
where ΠA1 and ΠB1 are dimensionless functions. The dimensionless functions given in Eqs.
(2.11) to (2.14) are different from those proposed in [33, 34], where the normalization was
taken with respect to E∗ instead of σr or σy.
During nanoindentation experiments, especially when the indentation depth is about 100 to 1000 nm, size-scale-dependent indentation effects have been postulated (e.g., [30, 50, 51]). These possible size-scale-dependent effects on hardness have been modeled using higher order theories (e.g., [50, 51]). If the indentation is sufficiently deep (typically deeper than 1 µm), then the scale dependent effects become small and may be ignored. In the current study, any scale dependent effects are assumed to be insignificant. It is clear from
Eqs. (2.11) to (2.14) that P = Ch2 is the natural outcome of the dimensional analysis for
a sharp indenter, and that it is independent of the specific constitutive behavior; loading curvature C is a material constant which is independent of indentation depth. It is also
noted that, depending on the choices of (εr, σr), there are an infinite number of ways to
define the dimensionless function Π1. However, with the assumption of power-law strain
hardening, it can be shown that one definition of Π1is easily converted to another definition.
If the unloading force is represented as Pu, the unloading slope is given by
dPu
dh =
dPu
dh (h, hm, E, ν, Ei, νi, σr, n) (2.15)
or, assuming that elasticity effects are characterized by E∗, the unloading slope is given by
dPu dh = dPu dh(h, hm, E ∗, σ r, n) (2.16)
dPu dh = E ∗hΠ0 2( hm h , σr E∗, n) (2.17)
Evaluating Eq. (2.17) at h = hm gives
dPu dh ¯ ¯ ¯ ¯ hm = E∗hmΠ02(1, σr E∗, n) = E ∗h mΠ2( E∗ σr , n) (2.18)
Similarly, Pu itself can be expressed as
Pu= Pu(h, hm, E∗, σr, n) = E∗h2Πu(hhm,Eσr∗, n) (2.19)
When Pu = 0, the specimen is fully unloaded and, thus, h = hr. Therefore, upon complete
unloading, 0 = Πu(hm hr , σr E∗, n) (2.20) Rearranging Eq. (2.20), hr hm = Π3( σr E∗, n) (2.21)
Thus, the three universal dimensionless functions, Π1, Π2 and Π3, can be used to relate the
indentation response to mechanical properties.
2.2.3 Computational Model
Axisymmetric two-dimensional and full three-dimensional finite element models were con-structed to simulate the indentation response of elasto-plastic solids. Figure 2-3(a)
schemat-ically shows the conical indenter, where θ is the included half angle of the indenter, hm is
the maximum indentation depth, and am is the contact radius measured at hm. The true
projected contact area Am, with pile-up or sink-in effects taken into account, for a conical
(b)
(a)
(c)
(d)
h
mθ
a
mConical
Indenter
Rigid Indenter
material
h
mθ
a
mConical
Indenter
Rigid Indenter
material
Figure 2-3: Computational modeling of instrumented sharp indentation. (a) Schematic drawing of the conical indenter, (b) mesh design for axisymmetric finite element calcula-tions, (c) overall mesh design for the Berkovich indentation calculacalcula-tions, and (d) detailed illustration of the area that directly contacts the indenter tip in (c).
Am= πa2m (2.22)
Figure 2-3(b) shows the mesh design for axisymmetric calculations. The semi-infinite sub-strate of the indented solid was modeled using 8100 four-noded, bilinear axisymmetric quadrilateral elements, where a fine mesh near the contact region and a gradually coarser mesh further from the contact region were designed to ensure numerical accuracy. At the maximum load, the minimum number of contact elements in the contact zone was no less than 16 in each FEM computation. The mesh was well-tested for convergence and was determined to be insensitive to far-field boundary conditions.
Three-dimensional finite element models incorporating the inherent six-fold or eight-fold symmetry of a Berkovich or a Vickers indenter, respectively, were also constructed. A total of 11,150 and 10,401 eight-noded, isoparametric elements was used for Berkovich and Vickers indentation, respectively. Figure 2-3(c) shows the overall mesh design for the Berkovich indentation, while Fig. 2-3(d) details the area that directly contacts the indenter tip. Computations were performed using the general purpose finite element pack-age ABAQUS [52]. The dimensional mesh design was verified against the three-dimensional results obtained from the mesh used previously by Larsson et al. [4]. Unless specified otherwise, large deformation theory was assumed throughout the analysis.
For a conical indenter, the projected contact area is A = πh2tan2θ; for a Berkovich
indenter, A = 24.56h2; for a Vickers indenter, A = 24.50h2. In this study, the
three-dimensional indentation induced via Berkovich or Vickers geometries was approximated with axisymmetric two-dimensional models by choosing the apex angle θ such that the pro-jected area/depth of the two-dimensional cone was the same as that for the Berkovich or Vickers indenter. For both Berkovich and Vickers indenters, the corresponding apex angle θ of the equivalent cone was chosen as 70.3o. Axisymmetric two-dimensional computational results will be referenced in the remainder of the paper unless otherwise specified. In all finite element computations, the indenter was modeled as a rigid body, and the contact was modeled as frictionless. Detailed pile-up and sink-in effects were more accurately ac-counted for by the large deformation FEM computations, as compared to small deformation computations.
2.2.4 Comparison of Experimental and Computational Results
Two aluminum alloys were obtained for experimental investigation: 6061-T651 and 7075-T651 aluminum, both in the form of 2.54 cm diameter, extruded round bar stock. Two compression specimens (0.5 cm diameter, 0.75 cm height) were machined from each bar such that the compression axis was parallel to the extrusion direction. Simple uniaxial com-pression tests were conducted on a servo-hydraulic universal testing machine at a crosshead speed of 0.2 mm/min. Crosshead displacement was obtained from a calibrated LVDT (linear voltage-displacement transducer). As each specimen was compressed to 45% engineering
strain, the specimen ends were lubricated with TeflonTM lubricant to prevent barreling.
In-termittent unloading was conducted to allow for repeated measurement of Young’s modulus and relubrication of the specimen ends. Recorded load-displacement data were converted to true stress-true strain data. Although the true stress-true strain responses were well approximated by power law fits, these experimental stress-strain data which were used as direct input for FEM simulations, rather than the mathematical approximations (see Fig. 2-4). For 7075-T651 aluminum, the measured Young’s modulus was E = 70.1 GPa (ν = 0.33); and for 6061-T651 aluminum, E = 66.8 GPa (ν = 0.33).
Indentation specimens were machined from the same round bar stock as discs of the bar diameter (3 mm thickness). Each specimen was polished to 0.06 mm surface finish with colloidal silica. These specimens were then indented on a commercial nanoindenter (Micro-Materials, Wrexham, UK) with a Berkovich diamond indenter at a loading/unloading rate of approximately 0.2 N/min. For each of three maximum loads (3, 10, and 20 N), five tests were conducted on two consecutive days, for a total of ten tests per load in each specimen. Figure 2-5 shows the typical indentation responses of both the 7075-T651 aluminum and 6061-T651 aluminum specimens, respectively. The corresponding finite element computa-tions using conical, Berkovich and Vickers indenters are also plotted in Fig. 2-5. Figure 2-6 shows the equivalent plastic strain (PEEQ) within the 7075-T651 aluminum near the tip of the conical indenter, indicating that the majority of the volume directly beneath the indenter experienced strains exceeding 15%. Assuming only the σ − ε constitutive response obtained from experimental uniaxial compression, the computational P − h curves agree well with the experimental curves, as shown in Fig. 2-5. The computational P −h responses
0
100
200
300
400
500
600
700
800
0
0.05
0.1
0.15
0.2
0.25
0.3
0.35
True Strain
T
ru
e
S
tr
es
s
(M
P
a)
7075T651 Al
6061T651 Al
0
100
200
300
400
500
600
700
800
0
0.05
0.1
0.15
0.2
0.25
0.3
0.35
True Strain
T
ru
e
S
tr
es
s
(M
P
a)
7075T651 Al
6061T651 Al
Figure 2-4: Experimental uniaxial compression stress-strain curves of both 6061-T651 alu-minum and 7075-T651 alualu-minum specimens, respectively.
0
2
4
6
8
10
0
5
10
15
h (
µ
m)
P
(N
)
Experimental Results FEM Prediction(Conical, Berkovich & Vickers)
6061T651 Al
7075T651 Al
Experimental Results FEM Prediction
(Conical, Berkovich & Vickers)
0
2
4
6
8
10
0
5
10
15
h (
µ
m)
P
(N
)
Experimental Results FEM Prediction(Conical, Berkovich & Vickers)
6061T651 Al
7075T651 Al
Experimental Results FEM Prediction
(Conical, Berkovich & Vickers) Experimental Results
FEM Prediction
(Conical, Berkovich & Vickers)
Figure 2-5: Experimental versus computational indentation responses of both the 7075-T651 aluminum and 6061-T651 aluminum specimens, respectively.
PEEQ
PEEQ
Figure 2-6: Contour plot of the equivalent plastic strain (PEEQ) within the 7075-T651 aluminum near the tip of the conical indenter, indicating that the majority of the volume directly beneath the indenter experienced strains exceeding 15%.
of the conical, Berkovich and Vickers indentations were found to be virtually identical.
2.2.5 Large Deformation vs. Small Deformation
Giannakopoulos et al. [3], Larsson et al. [4], Giannakopoulos and Suresh [41], and Venkatesh et al. [42] have proposed a systematic methodology to extract elasto-plastic properties from a single P − h curve. The loading curvature C was given as
C = M1σ0.29 · 1 + σy σ0.29 ¸ · M2+ ln µ E∗ σy ¶¸ (2.23)
where M1 and M2 are computationally derived constants which depend on indenter
geom-etry. The representative stress σ0.29 is defined as a true stress at true plastic strain of 29%.
It is interesting to note that, after rewriting σ0.29
³ 1 + σy σ0.29 ´ as σy ³ 1 +σ0.29 σy ´ , Eq. (2.23) is consistent with Eq. (2.13).
Figure 2-7 shows the comparison between the large deformation solution, small deformation solution and the predictions from Eq. (2.23), using the four model materials
15
20
25
30
35
40
45
50
3
3.5
4
4.5
5
5.5
6
6.5
C
/
(
σ
y+
σ
0.2 9)
ln (E
*/
σ
y)
A-Zn Alloy B-Refractory Alloy C-Al Alloy D-Steel
large deformation
small deformation
previous formulation: eq. (20)
15
20
25
30
35
40
45
50
3
3.5
4
4.5
5
5.5
6
6.5
C
/
(
σ
y+
σ
0.2 9)
ln (E
*/
σ
y)
A-Zn Alloy B-Refractory Alloy C-Al Alloy D-Steel
large deformation
small deformation
previous formulation: eq. (20)
large deformation small deformation previous formulation: large deformation small deformation previous formulation:Eq. (2.23)
Figure 2-7: Comparison between the large deformation solution, small deformation solution and the previous formulation (Eq. (2.23)) using four model materials. For all four cases studied, large deformation theory always predicts a stiffer loading response.
listed in Venkatesh et al. [42] (see Table 2.1). From Fig. 2-7, it is evident that Eq. (2.23) agrees well with the small deformation results and that, for all four cases studied, large deformation theory always predicts a stiffer loading response.
In addition, 76 different cases covering material parameters of most engineering metals were studied computationally. Detailed examination showed that large deformation solutions are not readily described by Eq. (2.23), but rather are better approximated within ±10% (for the conical indenter with θ = 70.3o) by a new universal function given by
C = N1σ0.29 · 1 + σy σ0.29 ¸ · N2+ ln µ E∗ σ0.29 ¶¸ (2.24)
where N1 = 9.4509 and N2 = -1.2433 are computationally derived constants specific to the
indenter geometry. This expression is consistent with the dimensionless function shown in Eq. (2.14).
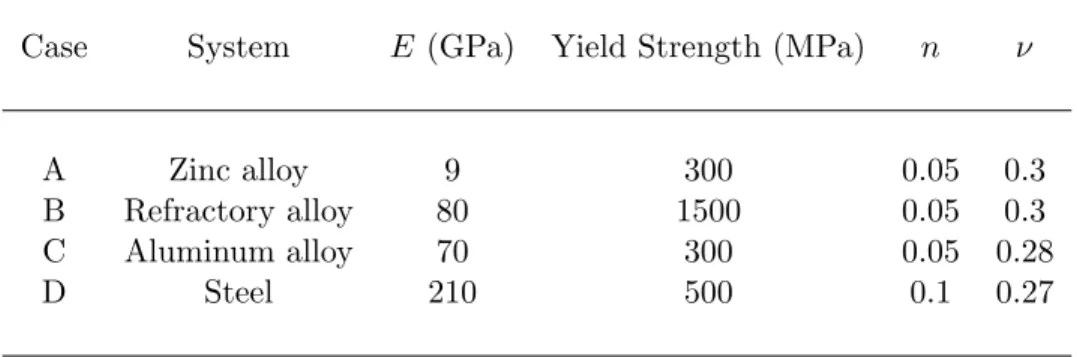
Table 2.1: Four cases studied to compare large vs small deformation theory.
Case System E (GPa) Yield Strength (MPa) n ν
A Zinc alloy 9 300 0.05 0.3
B Refractory alloy 80 1500 0.05 0.3
C Aluminum alloy 70 300 0.05 0.28
D Steel 210 500 0.1 0.27
2.3
Computational Results
A comprehensive parametric study of 76 additional cases was conducted (see Table 2.2 for a complete list of parameters). These cases represented the range of parameters of mechanical behavior found in common engineering metals: that is, Young’s modulus E ranged from 10
to 210 GPa, yield strength σy from 30 to 3000 MPa, strain hardening exponent n from 0
to 0.5, and Poisson’s ratio ν was fixed at 0.3. The axisymmetric finite element model was used to obtain computational results unless otherwise specified.
2.3.1 Representative Strain and Universal Dimensionless Functions
The first dimensionless function of interest is Π1 in Eq. (2.12). From Eq. (2.12),
Π1 µ E∗ σr, n ¶ = C σr (2.25)
The specific functional form of Π1 depends on the choice of εr and σr. Figure 2-8 shows
the computationally obtained results using three different values of εr (i.e., εp = 0.01, 0.033
and 0.29) and the corresponding σr. The results in Fig. 2-8 indicate that for εr < 0.033,
Π1 increased with increasing n; for εr > 0.033, Π1 decreased with increasing n. Minimizing
the relative errors using a least squares algorithm, it is confirmed that when εr = 0.033, a
polynomial function Π1 ³ E∗ σ0.033, n ´ = C σ0.033
‡fits all 76 data points within a ±2.85% error (see
Table 2.2: Elasto-plastic parameters used in the present study (ν is fixed at 0.3) For each of the 19 cases below, strain-hardening exponent n is varied from 0, 0.1, 0.3 to 0.5, resulting a total of 76 different cases
Case E [GPa] σy [MPa] σy/E
19 combinations of E and σy 10 30 0.003 10 100 0.01 10 300 0.03 50 200 0.004 50 600 0.012 50 1000 0.02 50 2000 0.04 90 500 0.005556 90 1500 0.01667 90 3000 0.03333 130 1000 0.007692 130 2000 0.015385 130 3000 0.023077 170 300 0.001765 170 1500 0.008824 170 3000 0.017647 210 300 0.001429 210 1800 0.008571 210 3000 0.014286
0 20 40 60 80 100 120 140 0 100 200 300 400 500 600 700 800
E* /
σ r
Π
1=
C
/
σ
r εr=0.033 n = 0, 0.1, 0.3, 0.5E* /
σ r
Π
1=
C
/
σ
rε
r
=0.033
n = 0, 0.1, 0.3, 0.5
(b)
0 20 40 60 80 100 120 140 0 200 400 600 800E* /
σ
rΠ
1=
C
/
σ
r (c)Π
1=
C
/
σ
rε
r
=0.29
n = 0
0.1
0.3
0.5
(c)
0 20 40 60 80 100 120 140 0 200 400 600 800E* /
σ
rΠ
1=
C
/
σ
r n = 0 εr=0.01E* /
σ
rΠ
1=
C
/
σ
rn = 0
0.1
0.3
0.5
ε
r
=0.01
(a)
Figure 2-8: Dimensionless function Π1 constructed using three different values of εr (i.e., εp
= 0.01, 0.033 and 0.29) and the corresponding σr, respectively. For εr< 0.033, Π1increased
with increasing n; for εr> 0.033, Π1 decreased with increasing n. A representative plastic
strain εr = 0.033 can be identified as a strain level which allows for the construction of Π1
σ
ε
pσ
0.0330.033
σ
ε
pσ
0.0330.033
Figure 2-9: For a given value of E∗, all power law plastic, true stress-true strain responses
that exhibit the same true stress at 3.3% true plastic strain give the same indentation loading curvature C. A collection of such plastic stress-strain curves are schematically illustrated in the figure.
Fig. 2-8(b)). A representative strain of εr = 0.033 was thus identified. The corresponding
dimensionless function Π1 normalized with respect to σ0.033 was found to be independent
of the strain hardening exponent n. This result indicates that, for a given value of E∗, all
power law plastic, true stress-true strain responses that exhibit the same true stress at 3.3% true plastic strain give the same indentation loading curvature C (see Fig. 2-9). It is noted that this result was obtained within the specified range of material parameters using the material constitutive behavior defined by Eq. (2.2).
Figure 2-10 show the dimensionless functions Π2 and Π3. Within a ±2.5% and a
±0.77% error, Π2 ³ E∗ σr, n ´ = E∗1hm dPdhu ¯ ¯ hm ‡ and Π 3 ¡σ r E∗, n ¢ = hr hm
‡ fit all 76 sets of
com-puted data shown in Figs. 2-10(a) and 2-10(b), respectively. Several other (approximate) dimensionless functions were also computationally derived. Figure 2-11(a) shows the
dimen-sionless function Π4 ³ hr hm ´ = pave
E∗ ‡ within ±13.85% of the computationally obtained values
for the 76 cases studied. It is noted that the verified range for Π4 is 0.5 < hhmr < 0.98.
Fig-ure 2-11(b) shows dimensionless function Π5
³ hr hm ´ = Wp Wt
‡within ±2.38% of the numerically