Comparing Business and Household Sector
Innovation in Consumer Products: Findings from
a Representative Study in the United Kingdom
The MIT Faculty has made this article openly available.
Please share
how this access benefits you. Your story matters.
Citation
von Hippel, E., J. P. J. de Jong, and S. Flowers. “Comparing
Business and Household Sector Innovation in Consumer Products:
Findings from a Representative Study in the United Kingdom.”
Management Science 58.9 (2012): 1669–1681.
As Published
http://dx.doi.org/ 10.1287/mnsc.1110.1508
Publisher
Institute for Operations Research and the Management Sciences
(INFORMS)
Version
Author's final manuscript
Citable link
http://hdl.handle.net/1721.1/76350
Terms of Use
Creative Commons Attribution-Noncommercial-Share Alike 3.0
Detailed Terms
http://creativecommons.org/licenses/by-nc-sa/3.0/
Comparing Business and Household Sector Innovation in Consumer Products: Findings from a Representative Study in the UK
Eric von Hippel1,*, Jeroen P.J. de Jong2,3, Stephen Flowers4 Original version, September, 2010
Revised November, 2011
Abstract
In a first survey of its type, we measure development and modification of consumer products by product users in a representative sample of 1,173 UK consumers aged 18 and over. We estimate this previously unmeasured type of innovation to be quite large: 6.1% of UK consumers – nearly 2.9 million individuals - have engaged in
consumer product innovation during the prior three years. In aggregate, consumers’ annual product development expenditures are more than 1.4 times larger than the annual consumer product R&D expenditures of all firms in the UK combined.
Consumers engage in many small projects which seem complementary to the innovation efforts of incumbent producers. Consumer innovators very seldom protect their innovations via intellectual property, and 17% diffuse to others. These results imply that official statistics partly miss relevant innovation activity, and that existing companies should reconfigure their product development systems to find and build upon prototypes developed by consumers.
1 MIT Sloan School of Management, Cambridge MA, USA. 2 RSM Erasmus University, Rotterdam, The Netherlands.
3 EIM Business and Policy Research, Zoetermeer, The Netherlands.
4 Centre for Research in Innovation Management, University of Brighton, United Kingdom. * Corresponding author. E-mail: evhippel@mit.edu. Phone: +1 617-253-7155
Comparing Business and Household Sector Innovation in Consumer Products: Findings from a Representative Study in the UK
1. Introduction
At least since Schumpeter (1934), product innovation has been seen by economists and policymakers as a producer activity, with consumers simply selecting among offerings provide on the market. It is therefore understandable that a national survey of product innovation by consumers has never been done before: who would look where long-held theory predicts nothing will be found? The result is that consumer innovation that may exist has been “dark matter” - unmeasured, and so impossible to include in economic analyses, and seldom appreciated by firms as a potentially valuable source of innovation. In this study, we take a first step to fill this major measurement gap.
Our study finds consumer innovation to be quite significant in both scale and scope. Via a survey of a representative sample of 1,173 consumers in the UK, we estimate that 6.1% of UK residents 18 years of age or older have created or modified consumer products they use during the prior 3 years. This represents nearly 2.9 million people. In aggregate, we find, UK consumer product users spend 97,800 person-years and an estimated £3.2 billion annually on their development efforts – more than 1.4 times the consumer product R&D expenditures of all firms in the UK combined. We also find that consumer product innovation spans a wide range of fields, from toys, to tools, to sporting equipment, and to personal solutions for medical problems. We further discover that consumer-developed innovations appear to be complements rather than substitutes for producer innovations, and that consumer innovators very seldom protect their innovations via intellectual property, and that 17% diffuse to others.
Individual consumers who develop or modify consumer products are ‘household sector innovators’, where the household sector is defined as comprising individuals in all resident households and also includes their unincorporated businesses (Ferran 2000)1. The existence of substantial amounts of presently unmeasured innovation within the household sector means, among other things that, at the country level, productivity studies would yield inflated effect sizes for the impact of producer innovation to the extent that – as we will argue is the case – consumer innovation is an invisible
1 Our measurement of product innovation activities by individual consumers is a conservative estimate of household sector innovation, in that it does not include innovations by their unincorporated enterprises.
complement to and contributor to producer innovation. It also implies that existing companies are less likely to appreciate consumers as a source of innovations which they can adopt, improve and commercialize.
2. Innovation by consumers
In this section we first review literature related to three aspects of product innovation by users of consumer products: the frequency of and expenditures associated with consumer innovation; the demographics of consumer innovators; and the diffusion of consumer-developed innovations.
2.1 Innovations by consumers in the household sector
The concept of product and process improvements being developed by private individuals (rather than by presumably better qualified engineers in a manufacturing firm) is still an unusual idea in the economic literature. The notion of household
production received attention in the 1960s and later (Becker and Ghez 1975). Although
the phenomenon is still only poorly measured, Berk (1987) estimates household
production of products and services, such as food and child care, to be almost one third of total production - a very significant matter. It seems a natural next step to measure
household sector innovation, but only recently have a few development economists begun to consider this. Thus Wu (2003), and Wu and Pretty (2004), argue for the importance of household sector innovation, and document that farmers in poor, rural areas of China use informal networks to collaborate, and to develop new farming techniques.
In the management literature, there is a much richer tradition of research related to household sector innovation under the term “user innovation.” User innovators are defined as innovators who expect to benefit from their innovation via use rather than from production and sale (von Hippel 1988, 2005). User innovators can be firms or individual consumers. When they are consumers working independent of their jobs to solve their own consumer needs they also fall within the category of household sector innovators (Ferran 2000). Consumers have been shown to be active innovators in services as well as products (Oliveira and von Hippel, 2009).
Studies of consumers as product innovators have to date largely focused upon samples of consumers who spent significant time on a specific sport or game. These studies uniformly find that a large proportion of consumers innovate. Thus, 20% to 30%
of participants in several extreme sports reported creating or modifying their equipment (Franke and Shah 2003 in four extreme sports; Lüthje et al. 2005 in mountain biking; Tietz et al. 2005 in kitesurfing). A study of Moth class sailboats found 64% of
participants innovated with respect to their boats and equipment (Raasch et al. 2008). In a Lego model building community where innovative designs were prized, 25% of participants reported creating novel models (Antorini 2007).
Studies of specialized sporting communities find that users spending a great deal of time on community activities. Two explore how much of that time, and how much money, is spent on developing innovations, and both find these expenditures to be substantial. Raasch et al. (2008) found that highly skilled Moth sailors, those
participating in international championships, each spent 435 Euro per annum (approx. 600 USD) on equipment innovations for their boats [private communication from first author of that study]. Hienerth et al. (2011), in a study of innovation and innovation efficiency in whitewater kayaking communities, found that innovating lead users, participants at the leading edge of the sport in terms of skill levels and intensity of involvement, each spent an average of $707 and 27 days per year on creating and improving kayaking equipment. Non-lead users spent considerably less, $165 and 9 days, on that activity.
2.2 Demographics of consumer innovators
Few studies of consumer innovation include demographic information, and what is available addresses only a few characteristics. In aggregate these data tend to show that consumer product innovators are fairly young, are male, and have technical knowledge relevant to their field of activity. For example, in the case of mountain biking, innovators tended to have a better knowledge of how bikes work and how to repair them than did non-innovators (Lüthje et al. 2005).
However, these demographics may say more about the types of innovation subject matter studied than about attributes inherently associated with innovating. Thus, in the case of extreme sports it is quite reasonable that both innovating and
non-innovating practitioners would tend to be young. In contrast, individuals who innovate in the sport of fly fishing might have a very different age distribution. Similarly, the typical gender of innovators may also be subject-specific. Thus, Buechley and Hill (2010) found that simply providing electronic components designed for easy integration into clothing
(for example, to enable home dress designers to easily integrate flashing LED lights into dresses) greatly increased the number of electronic Arduino-based microcontroller projects carried out by women.
2.3: Diffusion of consumer-developed innovations
Several studies have shown that it is quite rare for consumers to attempt to protect or restrict access to innovations they have developed (Shah 2000, Prügl and Schreier 2006; Raasch et al. 2008). This behavior may in part reflect the high cost of obtaining intellectual property rights protection, since patents typically cost thousands of dollars to apply for and take years to obtain. It may also reflect the reality that it can be very difficult to hide the details of an innovation when you use it publicly in, for example, sporting competitions.
Private benefits attainable from free revealing can also induce consumers to offer access to innovations they have developed at private cost. Potential benefits range from reputational gains to benefits from network effects (Baldwin and Clark 2006, Lerner and Tirole 2002, von Hippel and von Krogh 2003). It has been found that willingness to freely reveal an innovation decreases if the agents compete with one another, for
example, if they are individuals competing in a sport (Franke and Shah 2003; Baldwin et al. 2006). A game-theoretical model supporting these conclusions is provided by Harhoff et al. (2003). Baldwin and Henkel (2011) and Balka et al. (2011) explore benefits from partial and selective openness strategies.
Studies of the sources of innovation have explored proportions of commercially produced products that are based upon user-developed innovations. In consumer goods fields studied to date, it has been found that successful products commercialized by producers are often based upon user-developed innovations. (Shah 2000, Hienerth 2006, Shah and Tripsas, 2007).
3. Research sample and methods
The purpose of this study was to determine the actual extent of consumer innovation in the U.K.. We seek to document how much time and money consumers spend, and explore the diffusion of their innovations. All these matters bear upon the economic, policymaking, and managerial significance of the phenomenon.
3.1 Sample and weighing
Our empirical study was supported by the independent UK research and policy entity NESTA (National Endowment for Science, Technology and the Arts) and carried out in the United Kingdom. We developed a survey instrument which was implemented by BMG, a marketing research company in the United Kingdom specialized in consumer research. All surveys were done by professional interviewers using computer assisted telephone interviewing (CATI). A major benefit of using ‘live’ interviewers rather than written questionnaires was that details of reported innovations were recorded. This enabled us to identify falsely reported examples: as will be described later, we imposed a tight definition of consumer innovation in order to insure conservative estimates.
The survey only covered UK citizens aged 18 and over. Although many
consumers under the age of 18 surely innovate with respect to the products they use, UK requirements regarding permissions for interviews with minorsmade their inclusion in this study impractical. Therefore our sample did not include individuals under 18 years of age, implying that all volume-related estimates presented later are conservative.
As indicated earlier on, in addition to determining how many consumers aged 18 and over were innovators, we wanted to learn what how much time and money was expended on innovation activities. A potential problem was that our resources for surveying were limited. Via a preliminary pilot survey, we had learned that the total number of consumer-innovators in the population would likely be less than 10% (see Flowers et al., 2010). We therefore need to oversample population groups with a
particularly high innovation propensity to obtain good estimates of their time and money expenditures. As the pilot had also indicated what kind of consumers were more likely to engage in innovation (namely those with higher levels of education, the technically-educated, and males), we used this preliminary information to create a stratified sampling plan.
Our sample was drawn for the SampleHome database, a database containing contact data on 20 million UK consumers. Its administrator (Sample Answers ltd.) continuously invests in updating the entries of the database from various sources,
including the phone book. To insure that difficult-to-contact groups (e.g., minority groups like immigrants) are properly represented in the database, proactive inquiries are done via random digit dialing phone surveys.
To draw our sample a number of background variables were used, including gender, highest education attainment and age. Drawing on the aforementioned pilot, we oversampled males and consumers with a higher education (over-representing those with qualifications beyond high school). As younger people are more likely to be
well-educated, this strategy implied that younger people were oversampled as well – see Table 1 for details. For technically educated people (engineering or natural sciences) no
advance information was available in the database, but as males are more likely to be technically educated, this group was likely to have been oversampled as well.
Table 1. Characteristics of UK consumer population, sample and respondents
Population Sample Respondents
(N=47 400 000) (n=7 629) (n=1 173) Gender Female 50% 27% 31% Male 50% 73% 69% Age classes 18-24 years 12% 16% 9% 25-34 years 16% 23% 18% 35-44 years 19% 18% 19% 45-54 years 17% 15% 20% 55-64 years 15% 16% 20% 65+ years 21% 12% 14% Education attainment Less educated 33% 15% 15% High school 35% 25% 28% Further qualifications 13% 30% 26% Degree 19% 30% 31% Education type Technical/engineering 25% n.a. 31% Other 75% n.a. 69% Employment Employed/self-employed 58% n.a. 74% Retired 20% n.a. 17%
Student/not working 22% n.a. 9%
Note: Survey targeted UK consumers aged 18 and over. Population statistics obtained from the UK Office of National Statistics for year 2008.
Over a period of three months, 7629 individuals were contacted by telephone. For various reasons, 51% of the sample could not be contacted (e.g., answering machines, no reply, unobtainable). An additional 34% preferred not to participate once contacted. Responses were obtained from 1173 consumers - 31% of those actually contacted. The overall response rate was 15%. Table 1 gives a more detailed description of the respondents (right-hand column), sampling frame (middle column) and corresponding
population statistics for UK citizens aged 18 and older (left-hand column). Education type and employment status were not available in the sampling frame, but still recorded in the survey as it was relevant for weighting our data (discussed later).
From Table 1 it becomes evident that two sources of bias were present. First and foremost, due to the disproportionate sampling of males and the highly-educated, the distribution of respondents clearly did not match with their corresponding population numbers. Second, particular groups of consumers were more likely to participate in the survey than others. We ran a Probit regression model with response as the dependent variable, and entered dummy variables for males and various age and educational attainment categories as the independent variables. Details of this model are shown in
Annex A. Although this model has limited explanatory power (pseudo R2 = 2.3%), the
marginal effect parameters show that younger people especially were less likely to participate. In addition, there was some selection bias for males and consumers with further qualifications (education attainment), who were also less likely to take the survey.
To obtain representative estimates for the whole population, we corrected for sampling and selection bias by computing weights for all respondents. We contacted the UK’s Office of National Statistics for a table which broke down the population of UK citizens aged 18 and over, across various combinations of the background variables reported here. A similar table was obtained from our data, and weights were specified to be the ratio of the corresponding table entries. For details we refer to Annex B of this paper. Analyses presented in our findings section are based on weighted data.
3.2 Survey questions
The survey started with offering specific cues and screening questions to
determine whether respondents were innovating consumers. If they were, then the second part of the survey followed up on respondents’ most recent innovation to ask about their time and money expenditures, innovation collaboration and the diffusion of their innovations. The full telephone script is available from the first author on request.
We first recorded any consumer innovations developed within the past three years. Following practice previously used in studies of process innovations by industrial process users, we asked about innovations in software products and physical products separately (de Jong and von Hippel 2009). Within each of these two categories, we also asked separately about instances in which consumers might have created a product from
scratch, and instances in which they might have modified a product in the category. For each innovation type (software modification and creation, and hardware modification and creation), respondents first indicated whether they had developed any such innovation during the past three years. When the answer was positive, open-ended questions followed to obtain a detailed description of what respondents had done. These questions were used to rigorously screen the reported innovations for false positives (see hereafter).
In the second part of the survey we collected data related to innovators’ most recent innovation via a series of closed-end questions. In cases where consumers said they had created multiple innovations, respondents were asked to focus only their most recent one, for which we assumed accuracy of recall would be best. We included
questions on the innovation process (including a dichotomous question if respondents had collaborated with other people to develop the innovation, a metric question on their time investment which we recoded into person-days, and another metric question regarding their direct financial expenditures). We also asked about the diffusion of consumer innovations (including questions on if he/she had protected its intellectual property, if the innovation was shared with any other people of firms, and if other individuals of firms had adopted the innovation).
3.3 Screening of reported innovations
Out of 1173 respondents, 365 respondents initially reported that they had created and/or modified at least one software or hardware product (=31%). However, our
questions to identify innovating consumers had been broad, as we did not want to miss any relevant innovations. The consequence was however that respondents provided us with many examples which could not be considered innovative.
In order to exclude ‘false positives’ we applied a rigorous screening procedure. As preliminary screens, we checked respondents’ answers to two questions: whether the respondent knew of an equivalent product available on the market that he/she could have bought, rather than creating a ‘homebuilt’ by him/herself; and whether the innovation had been developed as part of the respondent’s job. A positive answer to either question eliminated the claimed innovation from further consideration. (We were not interested in replications of existing products, but rather aimed for creations/modifications which were at least new to the consumer him/herself. We also wanted to include only innovations that individuals had developed as consumers rather than as business sector employees.) We
found that the ‘innovations’ reported by 199 respondents did not pass these initial screening criteria. (Specifically, 155 failed on the homebuilt criterion, 36 did not satisfy the job criterion, and 8 failed on both).
Next, the open-ended descriptions of all remaining claimed innovations were examined and discussed by two members of the research team. Cases regarded as false positives due to lack of novel, user-developed content such as: “I installed a
[manufacturer-developed] software upgrade on my personal computer,” were removed at this stage. This second screen found that another 62 respondents were ‘false positives’.
After the completion of our screening process, we had a sample of 104 validated innovators and innovations - 8.9% of the full sample of 1173 respondents. After weighing the data the share of innovating consumers was estimated to be 6.1% (see section 4). We analyze our follow-up questions on time and money expenditures, and the diffusion of innovations, for these 104 validated innovation cases.
3.4 Response bias test
Finally, we conducted an independent test for response bias. Our concern was that, once our interviewer told potential respondents that the subject of the survey was innovation, people who had innovated would be more likely to agree to answer our survey than those who had not innovated. We set up an empirical check of response bias by conducting a small validation study in the Netherlands. (We would have liked to conduct the study in the UK, but funding restrictions required that we do it in the Netherlands.) This study was done via telephone surveying, utilizing interview methods identical to those used in the UK. It was implemented in March, 2011. The sampling frame consisted of three groups, including 800 Dutch citizens aged 18 and over
(randomly drawn from the public phone book database), 400 highly educated engineers (drawn from the same phone book database, in which engineers can be recognized by their academic title), and 400 consumer patent applicants (a random sample of those consumers who applied for a patent in the Netherlands during the past five years). Note that patent applicants usually see their application granted, as the Dutch patent system only investigates technological newness in case of infringement i.e. when involved parties go to court.
The questionnaire was a subset of the questions that we had asked in the UK. More specifically, we asked respondents for software and hardware modifications and
creations, followed up with open-ended questions, and screened out examples which respondents could have bought, merely copied, or had developed in their job – all questions identical with the UK survey. After applying the same screening criteria utilized in our main study, we found that patent applicants were much more likely to be innovating consumers (as we had anticipated). Their share of innovating consumers was 30.2%, while for engineers it was 13.5%, and for the broad sample 7.0% (p(χ2)<0.001). These latter percentages are in line with our UK findings (see section 4).
As in the UK survey methodology, all people in the sample were approached five times before being marked as a non-respondent. The overall response rate was 32% (n=509). We did not find strong differences in the response rates of the three subsamples i.e. 35% (patent applicants), 32% (engineers), and 31% (broad sample). These differences were not significant (p(χ2)=0.33). However, we did find that the subsamples were not reached for different reasons. Amongst patent applicants, only 26% explicitly refused to take the survey, while 39% could not be contacted i.e. did not pick up the phone, etc. For engineers these percentages were 35% (explicit refusals) and 33% (not attainable), respectively. Finally, in the broad sample the percentages were that 39% (refusals) while 30% was not attainable. These findings suggest that the most innovative respondents (i.e. patent applicants) are less likely to refuse, but they are also more likely to be unattainable – possibly because they are more proactive persons having a job or other responsibilities. In net, we conclude that, with the questions and telephone survey methodology we used, response bias is unlikely to have had a significant impact upon our findings.
4. Findings
In this section we report upon the amount and types of innovations developed by consumers to satisfy their personal needs. We then proceed to assess consumers’
innovation investments compared to producers’ investments in (corresponding) consumer goods, the demographic characteristics of innovating consumers, and the diffusion of their innovations.
4.1 Amount and types of consumer innovation in the UK
We first determined the share of UK consumers who, in the past three years, created and/or modified at least one software or hardware application to satisfy their
personal needs. After applying the response screening measures described in the previous section, and after weighing the data, we found 6.1% of the UK consumer population aged 18 and older to be innovating consumers. These individuals were all innovating in their personal time for their personal purposes, rather than as part of their jobs. Moreover, their innovations were (in their perspective) novel rather than homebuilt versions of incumbent consumer products. Given that the current population of consumers aged 18 and older in the UK is approximately 47.4 million (UK Office of National Statistics) we arrive at a weighted estimate that nearly 2.9 million adult individuals in the UK engaged in some form of innovation in the past three years. Moreover, the 95% confidence interval estimate of the share of innovating consumers ranged from 4.7% to 7.5%. Even at the lower end more than 2.2 million UK adult consumers are innovators. The phenomenon of innovation by consumers is clearly not trivial.
Table 2. Examples of reported consumer innovations
Category Example Percentage
Craft and
shop tools I created a jig to make arrows. The jig holds the arrow in place and turns at the same time, so I can paint according to my own markings. Jigs available on the market do not rotate.
23% Sports and
hobby I am a keen cricketer … I modified the cricket bat so it improves the play and contact with the ball. 20% Dwelling-
related
Due to the weather, I wanted my washing machine to spin only. I modified it by changing the way the timer worked to give a spin-only option. I bridged one of the circuits and inserted a switch.
16%
Gardening-related I made a device for trimming the tops of trees. It’s a fishing rod with a large metal hook at the end. This enables me to reach the top of the trees, bend them down, and cut them.
11%
Child-related I colored the two halves of a clock dial with different colors, so a child can easily see which side is past the hour and which before the hour. I used it to teach my kids to tell the time.
10%
Vehicle-related I developed an alternative type of starter motor to get my automobile engine to start in the event of a faulty battery. 8% Pet-related My dog was having trouble eating. I used a flat piece of laminated
wood and put an edge around it like a tray to stop her bowl from moving around the kitchen. It is a successful innovation.
3% Medical As I have a spinal problem, I built a nearly diagonal slope for my
keyboard. It is very handy for people who cannot look down when they are typing.
2% Other I reprogrammed a GPS to make it more user friendly and efficient. It is
different from what is out there because it is tailored to me. 7%
100%
The great majority of the reported innovations involved physical products. Only 14% were concerned with software. Ninety percent of the innovating respondents
reported developing or modifying their innovations entirely on their own. The average consumer-innovator in our sample reported making eight innovations (creations and/or modifications) during the last three years. Innovation by consumers in our sample covered a very wide range of products and activity types. Some of the innovations developed were very simple, some less so. Table 2 offers examples.
The innovation categories showing high levels of innovation map well upon major categories of leisure time activities reported by UK consumers. Thus, sports, do-it-yourself, use of the Internet, and arts and crafts are all among the top 10 leisure activities in the UK (ONS, 2008a). Studies of time invested in leisure and family activities show that sports, gardening, household chores, caring for children, and using computers are all receive significant time from UK consumers (Lader et al. 2006).
4.2 Innovation expenditures by consumers and producers
In this section we assess the economic importance of consumer innovation by estimating the total innovation-related investments (including time and out-of-pocket costs) made by UK consumers per year (Table 3). To provide a context for evaluating the significance of these investments, we also estimate the annual R&D expenditures made by UK producers related to consumer goods.
Table 3. Estimated annual investments by innovating consumers
Mean 95% confidence interval Low High
a. No. of UK consumers aged 18 and over (millions) 47.4 47.4 47.4 b. Share of innovating consumers aged 18 and over 6.1% 4.7% 7.5% Annual investment per innovating consumer
c. Total expenditure (£) 1098 578 1619
d. Time investment (person-days) 7.1 3.8 10.4 Annual investment for all innovating consumers
e. Total expenditure (£ bln) [a*b*c] 3.2 1.3 5.8 f. Time investment (thousands of person-years) [a*b*d] 97.8 40.3 176.1 Notes. N=1,173. Total expenditures include time and out-of-pocket investments. For time investment, a person-day was considered to be worth the average gross salary of £114 per day (ONS, 2009a).
Our survey data of 104 validated innovation cases showed that on average, each respondent spent 4.8 person-days and £101 on their most recent consumer innovation. Most consumers spent considerably less, while a smaller group spent much more. Respondents also reported how many innovations they had developed (i.e. creations and/or modifications). On average they reported creating 8.0 innovations in total during
the preceding three years.
We used these data to determine the total investment per innovating consumer per year. We first assumed that every consumer-innovator would receive the average UK gross salary, which was most recently £114 per day (ONS, 2009a). For each respondent we then computed how much he/she had spent on his/her most recent innovation by multiplying their (self-reported) time investment (person-days) with £114 and adding their (also self-reported) direct expenditures. Note that we here adhere to normal
procedure in economics - taking opportunity cost as the “true cost” of resource inputs and supposing that market prices provide an accurate measure of opportunity cost. This is done, for instance, in analyses of people’s trade-off of hours of paid work versus hours of unpaid leisure. In our case, the opportunity cost equals hours spent on innovation times the going market price for consumer innovators’ labor.
Next, to obtain the total investment per innovating consumer, we multiplied their spending on their most recent innovation with their self-reported number of innovations, then divided by three (years) to obtain an annual estimate. The average annual investment per consumer-innovator was accordingly estimated to be £1098. When evaluated for 2.9 million consumers (as found in section 4.1), the total annual investment for all innovating consumers in the UK (aged 18 and older) was £3.2 billion.
A number of remarks should be made regarding this estimate. First, note that we were assuming that if a respondent’s most recent innovation met our screening criteria, then all his or her reported innovations were valid ones and should be included in our estimate. We are also assuming that all innovations by those reporting an invalid ‘most recent’ innovation were not valid – these were all excluded. An alternative estimation would be based on the assumption that the distribution of valid innovations versus false positives is completely random. The alternative would result in a higher estimate of the total expenditures by innovating consumers, so our estimation method is conservative in this regard. (Innovating consumers who did not pass the screening reported, on average, 5.2 innovations in the past three years versus 8.0 for valid cases. This lower number of innovations would however be more than offset by the fact that more than 71% (=261/365) of the self-reported innovators had not passed our innovation validity screening.)
Second, as we have only 104 validated cases as a basis for estimation, the estimated consumer innovation expenditure is “noisy.” We present the implications of
this via the 95% confidence interval estimates shown in Table 3. The potential variance is indeed quite substantial - ranging from annual expenditure levels of from £1.3 to £5.8 billion. At the same time, it is important to note that even at the low end of this confidence interval, consumer innovation expenditures are quite large.
Third, note that by valuing a consumer-innovator’s person-day at the average daily gross salary for professional workers, we are being conservative with respect to salary levels. As we will see later, the average innovating consumer is better-educated than the average UK citizen, and so would be likely to receive a higher-than-average salary.
To put our consumer innovation estimates in perspective, we also estimated the annual R&D expenditures by UK firms on consumer products. To do this, we first determined that total private R&D spending by all domestic commercial UK firms in 2007 was £11.3 billion (ONS, 2009b). For each sector of industrial activity listed, we then determined the proportion of each sector’s output devoted to serving final household demand – information obtained from UK input-output tables (ONS, 2008b) – to indicate the share of R&D that was dedicated to consumer products. The total figure for 2007 resulting from this exercise was £2.2 billion. This implies that total consumer product development expenditures by innovating consumers in the UK (£3.2 billion) are approximately 1.4 to 1.5 times greater than those of UK producers.
We also compared consumer and producer investments in terms of time expenditures only. To estimate innovating consumers’ time investment, we started with how much time (person-days) every innovator had reported spending on his/her most recent innovation, then multiplied this amount by the number of innovations they reported making during the preceding 3 years, then divided by three (years) to obtain an annual estimate. The resulting average annual time investment per consumer-innovator was 7.1 person-days. Assuming that a person-year includes 210 person-days, when evaluated for nearly 2.9 million consumers the total annual time investment for all innovating consumers in the UK (aged 18 and older) would then be 97,800 person-years. In contrast, we roughly estimate – by multiplying total UK R&D personnel counts by the fraction of UK output serving household demand - that about 22 300 full-time staff work on consumer product development.
The implications of the contrast in sheer numbers and related expenditures of innovating consumers versus professional innovation workers are still to be explored. On
the one hand, it may be that the product development skill level of professional innovation workers devoting full time to that job is on average much higher than the average skill level among consumer-developers. On the other hand, the diversity of knowledge and abilities among the consumer population is likely to be greater. Such diversity has been shown to have a significant positive impact on problem-solving effectiveness (Jeppesen and Lakhani, 2010).
Innovation expenditures by UK consumers have a higher proportion of labor than do expenditures by UK producers. Recall that we learned from the survey that the
average labor investment in an innovation by consumers is 4.8 days. This represents a value of £547 when evaluated at the average daily gross salary of £114. In contrast, consumers report an average money expenditure of £101. Thus, 84% of the innovation investment by consumers consists of labor. In contrast, labor costs were 47% of total R&D spending by UK producers in 2006 (ONS, 2008b).
4.3 Demographics of consumer-innovators
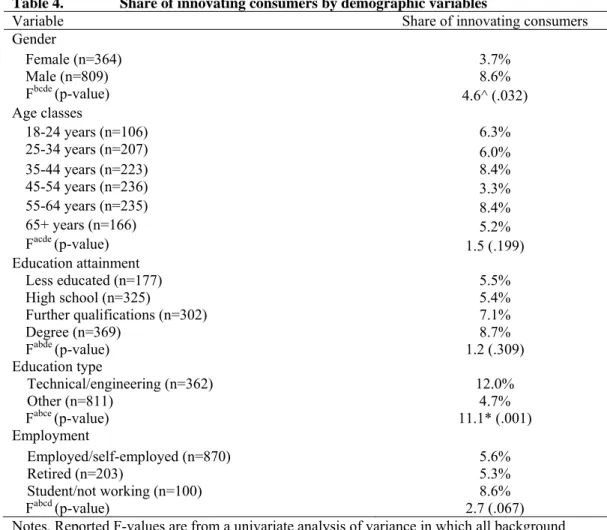
We explored the relationship between innovation and respondents’ demographic variables. We found some differences, but only a few were significant (Table 4). Some of the descriptive statistics in Table 4 seemed compelling, but in a significance of difference test in which we controlled for the other demographic variables, only gender and
education type were statistically significant. After controlling for differences in age, education attainment, education type and employment status, males appeared to be more likely consumer innovators (8.6% versus 3.7% for females, p < 0.05). Likewise,
consumers with a technical education (engineering or sciences) are much more likely to engage in innovation (12.0% versus 4.7%, p < 0.01).
To further explore demographic characteristics related to consumer innovators, we estimated a range of Probit regression models with being a consumer innovator as the dependent variable. We estimated a full model in which all groups of Table 4 were entered as dummy variables (reference groups were females, 18-24 year olds, less educated, non-technically educated, and working/self-employed people), a more parsimonious model, and a Probit model which more thoroughly controlled for sample selection bias. Details of these models are presented in annex C.
Table 4. Share of innovating consumers by demographic variables
Variable Share of innovating consumers
Gender Female (n=364) 3.7% Male (n=809) 8.6% Fbcde (p-value) 4.6^ (.032) Age classes 18-24 years (n=106) 6.3% 25-34 years (n=207) 6.0% 35-44 years (n=223) 8.4% 45-54 years (n=236) 3.3% 55-64 years (n=235) 8.4% 65+ years (n=166) 5.2% Facde (p-value) 1.5 (.199) Education attainment Less educated (n=177) 5.5% High school (n=325) 5.4% Further qualifications (n=302) 7.1% Degree (n=369) 8.7% Fabde (p-value) 1.2 (.309) Education type Technical/engineering (n=362) 12.0% Other (n=811) 4.7% Fabce (p-value) 11.1* (.001) Employment Employed/self-employed (n=870) 5.6% Retired (n=203) 5.3% Student/not working (n=100) 8.6% Fabcd (p-value) 2.7 (.067)
Notes. Reported F-values are from a univariate analysis of variance in which all background variables were entered as covariates. More specifically, a,b,c,d and e indicate that the F-test on significant differences is controlled for differences in gender, age classes, education attainment, education type and employment status. * and ^ indicate statistical significance at 1% and 5% levels, respectively.
Overall, echoing Table 4, we found that males and technically educated are more likely to engage in innovation. The other variables were not significant. We conclude that demographic variables are helpful to explain consumer innovation engagement to some extent, but given the modest percentage of variance explained, other variables (such as diverse personal needs, or idiosyncratic circumstances) may be found to be more important.
4.4 Diffusion of consumer innovations
To explore the extent in which consumer innovators diffuse their innovations, we asked our respondents questions related to innovation protection and sharing. Within the group of 104 respondents with validated innovation cases, we found that 33% reported sharing
the details of their innovations with other consumers and/or with producer firms. Those who received assistance from others during development were significantly more likely to report sharing (p < .05).
With respect to innovation protection, we found that only 2% of the validated consumer innovators in our sample formally protected their innovations via intellectual property rights. This pattern could signal one or a mix of views by consumer-innovators: (1) a willingness to share openly; (2) a view that obtaining intellectual property rights protection was not worth the cost or unlikely to be effective; (3) a view that others would not be interested in adopting their innovation in any case, and so the issue of protection was moot.
Seventeen percent of the innovations developed by users were, to their
knowledge, actually adopted by others. Note that our data do not tell us how widely these innovations diffused on average, nor whether they diffused peer-to-peer only – perhaps just to an innovator’s neighbor - or also were picked up by consumer goods production companies. However it does seem clear, based upon this evidence as well as the evidence discussed in the literature review, that many consumer-developed innovations do diffuse to at least some degree.
5. Discussion
In this first study of consumer innovation in a representative national sample, we have found it to be a phenomenon of major scope and scale. This finding fundamentally contrasts with the argument for household innovation in development economics - which is largely based on the view that, in the absence of a well-developed manufacturing sector, consumers need to develop innovative capacities. Via this study, we show that consumers innovate broadly even if manufacturing is well-developed.
The existence of substantial amounts of presently unmeasured household innovation also means that official innovation statistics are incomplete. Productivity studies that do not include this ‘dark matter’ are likely to yield inflated effect sizes for the impact of traditional R&D and innovation to the extent that consumer innovation is an invisible complement to and contributor to producer innovation. We hereafter first consider why consumer and producer innovation are likely to be complements, then conclude by briefly noting some important implications for innovation policymaking and management.
5.1 Consumer and producer innovation as complements
When 2.9 million UK consumers implement (8 innovations in three years) 2.7 consumer product innovation projects per year, that makes a total of 7.8 million typically small projects per year. As each of them annually spends 4.8 days on a project, and invests £101 for out-of-pocket costs, it becomes clear that individual user innovators and producer innovators must be doing very different types of things: producer innovators are unlikely to spend only 4.8 days and £101 on projects deemed worthy of producer firm investment.
The differences in what user and producer innovators do is a function of their differing innovation incentives. Individual users experiencing needs for a novel consumer product have an incentive to buy or create what they need. Each user expects to benefit from personal use only, and so each individual’s willingness to pay is generally not dependent upon whether others need the same thing. Producers, in contrast, prefer to invest when many consumers want the same product - they can then spread their
development and production and marketing investments over many purchasers. The net result is that users with needs not shared by – or not known to be shared by - many others will generally have to innovate for themselves. Producers will simply not find it
profitable to design and produce what only one or a few consumers are known to want (von Hippel 2005).
Individual consumers who do decide to innovate for themselves can often create a serviceable version of the product they need at a very low cost – as the data on user per-project expenditures in our study graphically demonstrates. They often accomplish this by modifying and combining items that they have around the house or purchase at low cost to create a new or modified product to serve a new purpose. For example, recall from Table 2 the examples of consumers developing their own devices for trimming tree tops and teaching kids to tell the time. If a producer were to design and make similar items, its development costs would be much higher. Thus, a producer is unlikely to find it profitable to simply tape a large metal hook onto the end of a fishing rod and bring it to market as a new tree-trimming aid. Instead it will invest considerable amounts to design a commercially attractive version of the new tool, using product design engineering to attain robustness, reliability, and safety, and industrial design to improve ergonomic qualities and visual appeal.
The net result of the different economics of innovation characterizing individual users and consumer product production firms is that consumer products with novel functionality and uncertain marketplace demand tend to be initially developed by
consumers by and for themselves. Next, other consumers find some among these designs also serve their needs – and may replicate and improve those designs. As a side effect, this replication activity by users creates an initial market signal regarding potential attractiveness of the prototype as the basis for a commercial product desired by many. Small firms, generally founded by users who understand the need and solution well and therefore are sensitive to this initially small and uncertain signal, spring up to serve initial demand. If and as demand grows, larger incumbent firms may be attracted to produce the new product as well (Baldwin et al. 2006). In sum, then, user and producer activities related to the design of new products can be seen to some extent - and probably to a significant extent - to be complements rather than substitutes. As was mentioned earlier, this implies that productivity studies that do not include consumer innovation are likely to yield inflated effect sizes for the impact of traditional producer R&D and innovation.
5.2 Implications for policymaking and management
We found that millions of U.K. consumers create and modify consumer products to better serve their needs. In addition, work in one field to date shows lead user
consumers to be significantly more efficient than business firms in creating innovations of general importance (Hienerth et al. 2011). We have also seen that consumer-innovators seldom protect their innovations from imitators, and that a significant fraction – 17% - diffuse to at least some extent. Finally, via research cited in our literature survey, we also know that consumer-developed products are often the prototypes for commercially successful products.
With respect to innovation policymaking, it is likely that innovations generated and freely diffused by consumers are likely to reduce deadweight loss, and so increase social welfare, relative to the traditionally-assumed situation where consumer needs are served by producer-developed designs, protected by intellectual property rights and priced above marginal cost. For this reason we suggest that policymakers should begin to routinely measure consumer innovation in their countries via existing or new social surveys. This information can then be used as the basis for policymaking to support and enhance levels of consumer innovation within nations and populations. For example,
based upon the demographic findings of this study, it appears that increased investments in technical education would be beneficial. Other promising policy directions would include actions to reduce the costs of communication among consumer innovators, and policies to encourage increased diffusion of innovations by user-innovators (Baldwin and von Hippel 2011). In addition, incorporation of data on consumer innovation in official statistics will increase awareness of this source of new product concepts among
incumbent commercial companies.
With respect to implications for management of innovation, consider that a consumer innovation culture creates and use-tests and diffuses many prototype consumer products. Consumer good producers that systematically search for consumer-developed innovations can learn to more effectively mine this stock of new product concepts and prototypes as a free input to their own product development efforts. Tested methods exist to find and benefit from ‘lead user’ innovators (Lilien et al. 2002, Franke et al. 2006). Companies may also adopt other innovation management practices, such as offering innovation toolkits to consumers (Thomke and von Hippel 2002) or innovation contests to attract consumer activity that might not otherwise occur (Jeppesen and Lakhani 2010). Firms that base new commercial products on consumer-developed designs can still profit from firm-developed product enhancements that they may elect to protect via intellectual property (Lilien et al. 2002). Further elaboration on managerial implications of consumer innovation can be found in von Hippel et al. (2011).
We conclude by suggesting that the quantitative exploration of the “dark matter” of consumer innovation that we have begun here offers challenges and opportunities to researchers, to policymakers, and to firms -- indeed, to all of us who have a stake in innovation. We suggest that further explorations will be valuable.
References
Antorini, Y.M. (2007). Brand community innovation - An intrinsic case study of the adult fans of LEGO community. Copenhagen.
Baldwin, C.Y. & K.B. Clark (2006). The Architecture of Participation: Does Code Architecture Mitigate Free Riding in the Open Source Development Model? Management
Science 52(7), 1116-1127.
Baldwin, C.Y., C. Hienerth & E. von Hippel (2006). How user innovations become commercial products: a theoretical investigation and case study. Research Policy 35 (9), 1291-1313.
Baldwin, C.Y. and Henkel, J. (2011). “Modularity for value appropriation – How to draw the boundaries of Intellectual Property.” Harvard Business School Working Paper 11-054. http://www.hbs.edu/research/pdf/11-11-054.pdf
Balka, K., Raasch, C., Herstatt, C. (2011), Understanding the demand for openness: A conceptual model and empirical study of semi-open innovation, Journal of Product
Innovation Management, forthcoming.
Berk. R.A. (1987). Household production. In: The New Palgrave: A Dictionary of
Economics, New York, Stockton, v. 2, pp. 673–677.
Becker, G.S. & G. Ghez (1975). The Allocation of Time and Goods Over the Life Cycle. New York, Columbia University Press.
Buechley, L. & B.M. Hill (2010). LilyPad in the Wild: How Hardware’s Long Tail is Supporting New Engineering and Design Communities. In: Proceedings of Designing
Interactive Systems (DIS), pp 380-389.
de Jong, J.P.J. & E. von Hippel (2009). Transfers of user process innovations to process equipment producers: A study of Dutch high-tech firms. Research Policy 38(7), 1181-1191.
Ferran, L. (2000). The concept of the household sector in the 1993 SNA and further elaborations. In: Household Accounting: Experience in Concepts and Compilation,
Volume 1, Handbook of National Accounting. United Nations publication ISBN
92-1-161430-9, Chapter 1.
Flowers, S., E. von Hippel, J.P.J. de Jong & T. Sinozic (2010). Measuring user
innovation in the UK: The importance of product creation by users. Research report,
(April) NESTA, London, UK ISBN 978-1-84875-081-4.
Franke, N. & S. Shah (2003). How Communities Support Innovative Activities: An Exploration of Assistance and Sharing Among End-Users. Research Policy 32(1), 157-178.
Franke, N., E. von Hippel & M. Schreier (2006). Finding Commercially Attractive User Innovations: A Test of Lead-User Theory. Journal of Product Innovation Management 23(4), 301-315.
Harhoff, D., J. Henkel & E. von Hippel (2003). Profiting from voluntary information spillovers: How users benefit from freely revealing their innovations. Research Policy 32(10), 1753-1769.
Hienerth, C. (2006). The commercialization of user innovations: the development of the rodeo kayaking industry. R&D Management 36(3), 273-294.
Hienerth, C., M.B. Jensen & E. von Hippel (2011). Innovation as consumption: Analysis of consumers’ innovation efficiency. MIT Sloan School of Management Working Paper. Jeppesen, L.B. & K.R. Lakhani (2010). Marginality and Problem-Solving Effectiveness in Broadcast Search. Organization Science 21(5), 1016-1033.
Lader, D., Short, S., Gershuny, J. (2006) The Time Use Survey, 2005: A report on the research using the ONS Omnibus Survey, Office for National Statistics, London. Lerner, J. & J. Tirole (2002). Some Simple Economics of Open Source. Journal of
Industrial Economics 50(2), 197-234.
Lilien, G. L., P. D. Morrison, K. Searls, M. Sonnack, and E. von Hippel (2002). Performance Assessment of the Lead User Idea-Generation Process for New Product Development. Management Science 48(8), 1042–1059.
Lüthje, C., C. Herstatt & E. von Hippel (2005). User-innovators and "local" information: The case of mountain biking. Research Policy 34(6), 951-965.
Oliveira, P. & E. von Hippel (2011). Users as Service Innovators: The Case of Banking Services. Research Policy 40(6), 806-818.
ONS (2008a) Lifestyles: watching TV is top activity for men and women, Office for National Statistics, http://www.statistics.gov.uk/cci/nugget.asp?id=1659 , downloaded September 8, 2010.
ONS (2008b), United Kingdom National Accounts: The Blue Book, 2008 edition, Office for National Statistics.
ONS (2009a), Annual Survey of Hours and Earnings, Statistical Bulletin, Office for National Statistics, 12 November 2009.
ONS (2009b), UK Business Enterprise Research and Development 2007, Office for National Statistics, 30 January 2009.
Prügl, R. & M. Schreier (2006). Learning from leading-edge customers at The Sims: Opening up the innovation process using toolkits. R&D Management 36(3), 237-251. Raasch, C., C. Herstatt & P. Lock (2008). The dynamics of user innovation: drivers and impediments of innovation activities. International Journal of Innovation Management 12(3), 377-398.
Riggs, W., & E. von Hippel (1994). Incentives to Innovate and the Sources of Innovation: The Case of Scientific Instruments. Research Policy 23(4), 459–469.
Schumpeter, Joseph A. 1934. The Theory of Economic Development. Harvard University Press, Cambridge, MA.
Shah, S. (2000). Sources and Patterns of Innovation in a Consumer Products Field:
Innovations in Sporting Equipment. MIT Sloan School of Management Working paper #
4105.
Shah, Sonali K. and Mary Tripsas (2007) “The Accidental Entrepreneur: The Emergent and Collective Process of User Entrepreneurship” Strategic Entrepreneurship Journal 1: pp 123-140.
Thomke, S.H., & E. von Hippel (2002). Customers as Innovators: A New Way to Create Value. Harvard Business Review 80(4), 74–81.
Tietz, R., P. Morrison. C. Lüthje & C. Herstatt (2005). The process of user-innovation: a case study in a consumer goods setting. International Journal of Product Development 2(4), 321-338.
von Hippel, Eric, Susumu Ogawa, and Jeroen P. J. de Jong (2011) “The Age of the Consumer-Innovator” Sloan Management Review (Fall) vol. 53 Nr 1 pp. 27-35 von Hippel, E. (2005). Democratizing Innovation. Cambridge, MA: MIT Press.
von Hippel, E. (1988). The Sources of Innovation. New York: Oxford University Press. von Hippel, E. & G. von Krogh (2003). Open Source Software and the
“Private-Collective” Innovation Model: Issues for Organization Science. Organization Science 14(2),208-223.
Wu, B. & J. Pretty (2004). Social connectedness in marginal rural China: The case of innovation circles in Zhidan, north Shaanxi. Agriculture and Human Values 21, 81-92. Wu, B. (2003). Household innovative capacity in marginal areas of China: An empirical study in North Shaanxi. Journal of Agricultural Education and Extension 9(4), 137-150.
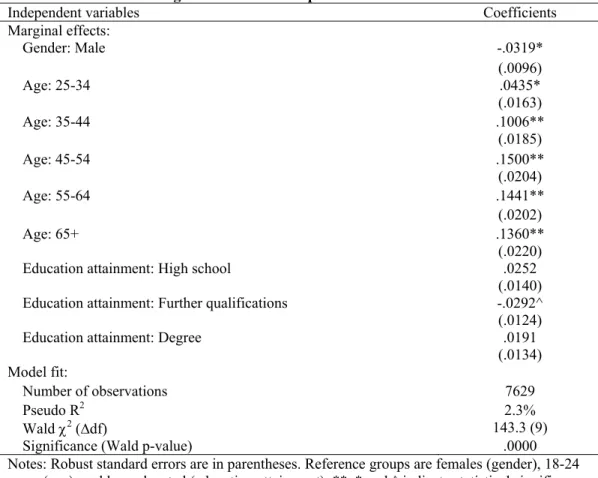
Annex A: Probit model of response
To assess selection bias, i.e. if particular groups of consumers had been more likely to participate in the survey, we ran a Probit regression model with response (coded 0 or 1) as the dependent variable, and dummies for gender (males), various age classes, and various educational attainment classes as independent variables. Results are shown in Table A1.
Table A1. Probit regression model of response
Independent variables Coefficients
Marginal effects: Gender: Male -.0319* (.0096) Age: 25-34 .0435* (.0163) Age: 35-44 .1006** (.0185) Age: 45-54 .1500** (.0204) Age: 55-64 .1441** (.0202) Age: 65+ .1360** (.0220) Education attainment: High school .0252
(.0140) Education attainment: Further qualifications -.0292^
(.0124)
Education attainment: Degree .0191
(.0134) Model fit:
Number of observations 7629
Pseudo R2 2.3%
Wald χ2 (∆df) 143.3 (9)
Significance (Wald p-value) .0000
Notes: Robust standard errors are in parentheses. Reference groups are females (gender), 18-24 years (age), and less educated (education attainment). **, * and ^ indicate statistical significance at 0.1%, 1% and 5% levels, respectively.
The presented marginal effect parameters show that the probability of response was deviant for younger people – especially those aged 35 years and over had been more likely to take the survey. For example, 35-44 year olds were an estimated 10.06% more likely to participate compared to 18-24 year olds (all else held constant). Similar differences are found for the other age classes. Besides, there was some selectivity in responses for males and consumers with further qualifications (education attainment) beyond high school. The overall explanatory power of the model, however, was limited (R2 = 2.3%).
Annex B: Weighing scheme
A weighing scheme was applied in order to obtain representative estimates for the whole population aged 18 and over. First, the UK Office of National Statistics kindly provided us with a breakdown of 47.4 mln UK citizens aged 18 and over (Table B1). The table gives the maximum level of detail possible. Some of the categories of our background variables had to be merged. For example, for citizens with low education it was not possible to obtain how many were technically educated. Likewise, retired people were merged with students and others without jobs (e.g., housekeepers).
Table B1. UK consumers aged 18+ across gender and age classes (rows), and
employment status, education attainment and education type (N=47.4 mln)
employed/self-employed retired/ student/ not working
high, technical high, non-technical low high, technical high, non-technical low male 18-34 1.3% 2.9% 8.1% 0.2% 0.5% 3.9% 35-54 1.8% 4.7% 11.0% 0.1% 0.4% 2.6% 55+ 0.5% 1.6% 4.7% 0.3% 1.0% 4.2% female 18-34 0.9% 3.7% 6.2% 0.2% 0.8% 4.8% 35-54 1.5% 4.9% 9.6% 0.2% 0.8% 4.2% 55+ 0.3% 1.3% 3.6% 0.4% 1.1% 6.1%
Source: UK Office of National Statistics, Labor market survey 2008.
Note: High education includes consumers with further qualifications or a degree. Low education includes consumers with a high school diploma or who are less educated.
Next, Table B2 shows the same distribution for our sample of 1173 respondents.
Table B2. Respondents across gender and age classes (rows), and
employment status, education attainment and education type (n=1173)
employed/self-employed retired/ student/ not working
high, technical high, non-technical low high, technical high, non-technical low male 18-34 3.4% 4.3% 9.2% 0.5% 0.8% 1.4% 35-54 6.9% 7.8% 9.5% 0.8% 0.6% 0.8% 55+ 3.1% 4.5% 3.3% 4.1% 4.0% 3.9% female 18-34 0.6% 2.5% 2.6% 0.2% 0.4% 0.7% 35-54 0.9% 4.9% 5.6% 0.1% 0.3% 0.9% 55+ 0.3% 2.3% 2.2% 0.2% 3.6% 2.6%
Note: High education includes consumers with further qualifications or a degree. Low education includes consumers with a high school diploma or who are less educated.
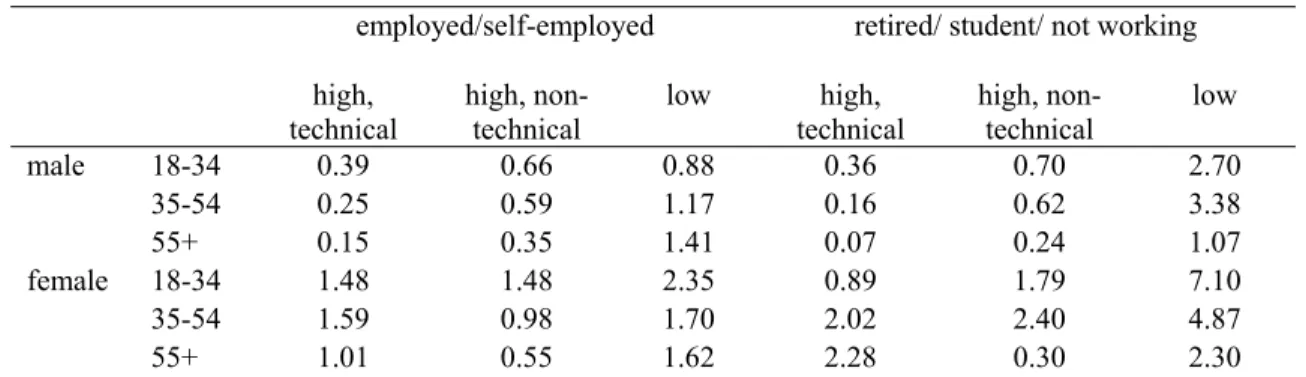
To correct for sampling bias (disproportionate stratification i.e. oversampling of males and highly-educated) and selection bias (less response of younger people, males and consumers with further qualifications) the weights were computed as the quotient of the corresponding percentages in Table B1 and Table B2. For example, males aged 18-34 with a job/business and a high and technical education received a weight of 1.3/3.4 = 0.39. All weights are shown in Table B3.
Table B3. Applied weights at various combinations of gender and age classes (rows), and employment status, education attainment and education type
employed/self-employed retired/ student/ not working
high,
technical high, non-technical low high, technical high, non-technical low male 18-34 0.39 0.66 0.88 0.36 0.70 2.70 35-54 0.25 0.59 1.17 0.16 0.62 3.38 55+ 0.15 0.35 1.41 0.07 0.24 1.07 female 18-34 1.48 1.48 2.35 0.89 1.79 7.10 35-54 1.59 0.98 1.70 2.02 2.40 4.87 55+ 1.01 0.55 1.62 2.28 0.30 2.30 Note: High education includes consumers with further qualifications or a degree. Low education includes consumers with a high school diploma or who are less educated.
The largest weight (7.10) was applied to females aged 18-34 with a low education who are not working. The smallest weight (0.07) was for males aged 55+ with a high and technical education, who are not working.
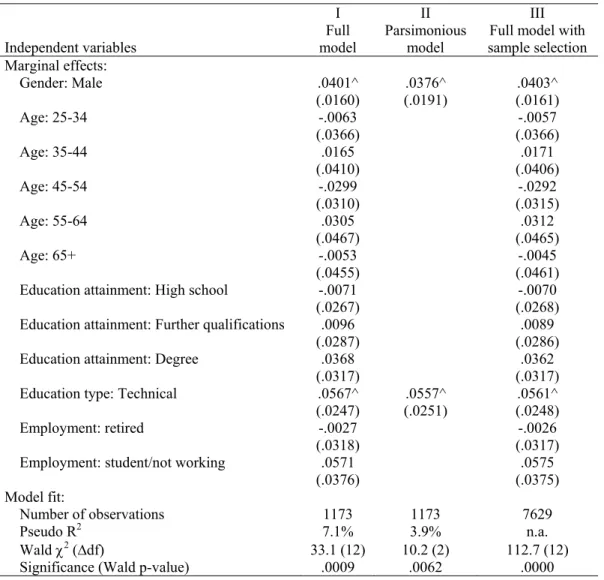
Annex C: Probit regression models of being a consumer innovator
To further explore the relationship between demographic variables and the odds of being a consumer innovator, we estimated a range of binary outcome regression models. In these models, being a consumer innovator (yes or no) is the dependent variable, while we included dummies for the various demographic variables as independent variables. Reference groups were females (gender), 18-24 year olds (age classes), less educated (education attainment), other i.e. non-technical (education type) and working/self-employed (employment status). In advance, we checked for multicollinearity problems. The correlation matrix showed that absolute values of the correlations between the independent variables were generally modest (r < 0.30). One exception was, rather obvious, that retired people were much more likely to be aged 65+. Here, the correlation coefficient was 0.70, but at such values multicollinearity is not considered problematic. All respondents have been weighed to represent population of UK citizens aged 18 and over (see section 3.1). Results are summarized in Table C1.
Table C1. Probit regression models of being a consumer innovator
I II III
Independent variables model Full Parsimonious model sample selection Full model with Marginal effects: Gender: Male .0401^ .0376^ .0403^ (.0160) (.0191) (.0161) Age: 25-34 -.0063 -.0057 (.0366) (.0366) Age: 35-44 .0165 .0171 (.0410) (.0406) Age: 45-54 -.0299 -.0292 (.0310) (.0315) Age: 55-64 .0305 .0312 (.0467) (.0465) Age: 65+ -.0053 -.0045 (.0455) (.0461)
Education attainment: High school -.0071 -.0070
(.0267) (.0268)
Education attainment: Further qualifications .0096 .0089
(.0287) (.0286)
Education attainment: Degree .0368 .0362
(.0317) (.0317)
Education type: Technical .0567^ .0557^ .0561^
(.0247) (.0251) (.0248)
Employment: retired -.0027 -.0026
(.0318) (.0317)
Employment: student/not working .0571 .0575
(.0376) (.0375)
Model fit:
Number of observations 1173 1173 7629
Pseudo R2 7.1% 3.9% n.a.
Wald χ2 (∆df) 33.1 (12) 10.2 (2) 112.7 (12) Significance (Wald p-value) .0009 .0062 .0000
Notes. Robust standard errors in parentheses. Reference groups are females (gender), 18-24 years (age), less educated (education attainment), other (education type) and working/self-employed (employment). Model III estimates are based on the Heckprob procedure with 6456 censored and 1173 uncensored observations. **, * and ^ indicate statististical significance at 0.1%, 1% and 5% levels, respectively.
Model I was a Probit regression model in which we entered all dummy variables into the equation. This model’s fit was significant and helped to explain consumer innovation engagement (Δχ2 = 33.1 with Δdf = 12, p < .001). The marginal effect estimates showed that males are more likely to be consumer innovators, i.e. compared to females their share of innovators is estimated to be 4.0% higher (dy/dx = .0401, p < .05). Likewise,
consumers with a technical education are estimated to be more likely to engage in innovation as compared to consumers without such education – when all other variables are held constant, their share of innovators is estimated to be 5.7% higher (dy/dx = .0567, p < .01). However, the overall strength of association of this model was modest (pseudo R2 = 7.1%).
Model II is a parsimonious model in which only the significant dummy variables are included. Both keep their significance, but the overall model fit is again modest (pseudo R2 = 3.9%).
Model III is an alternative full model which more thoroughly corrects for potential selection bias. Recall from section 3.1 that especially younger consumers, and also males and people with further (educational) qualifications, had been less likely to take the survey. Although our weighing scheme already corrects for such bias, to more thoroughly check the robustness of our findings we estimated a Probit regression model with a (Heckman) selection equation (drawing on the Heckprob procedure in Stata). The model was identified, as basically all age dummies were related with response, but not with the probability of being a consumer innovator. Coefficients of the selection equation are not presented here (available on request), as they closely resembled with the
parameter estimates presented in annex A. The correlation coefficient ρ between the error terms of the selection and regression equation was -.73 and not significant (Wald test χ2 = .67 (df=1), p = .41). This implies that selection bias did not substantially influence the parameter estimates in the regression model – and indeed, we found that the marginal effects and their significance in model III were nearly identical with those in model I.