HAL Id: hal-00836409
https://hal.archives-ouvertes.fr/hal-00836409
Submitted on 20 Jun 2013
HAL is a multi-disciplinary open access
archive for the deposit and dissemination of
sci-entific research documents, whether they are
pub-lished or not. The documents may come from
teaching and research institutions in France or
abroad, or from public or private research centers.
L’archive ouverte pluridisciplinaire HAL, est
destinée au dépôt et à la diffusion de documents
scientifiques de niveau recherche, publiés ou non,
émanant des établissements d’enseignement et de
recherche français ou étrangers, des laboratoires
publics ou privés.
Document Authentication Using Graphical Codes:
Impacts of the Channel Model
Anh Thu Phan Ho, Bao An Hoang Mai, Wadih Sawaya, Patrick Bas
To cite this version:
Anh Thu Phan Ho, Bao An Hoang Mai, Wadih Sawaya, Patrick Bas. Document Authentication
Using Graphical Codes: Impacts of the Channel Model. ACM Workshop on Information Hiding
and Multimedia Security, Jun 2013, Montpellier, France. pp.ACM 978-1-4503-2081-8/13/06.
�hal-00836409�
Document Authentication Using Graphical Codes:
Impacts of the Channel Model
Anh Thu Phan Ho
LAGIS UMR 8219 CNRS Inst. Telecom, Telecom Lille1 59000 Villeneuve d’Ascq, FR
[email protected]
Bao An Mai Hoang
LAGIS UMR 8219 CNRS Telecom Lille1 59000 Villeneuve d’Ascq, FR
[email protected]
Wadih Sawaya
LAGIS UMR 8219 CNRS Inst. Telecom, Telecom-Lille1 59000 Villeneuve d’Ascq, FR[email protected]
Patrick Bas
LAGIS UMR 8219 CNRS Ecole Centrale de Lille 59651 Villeneuve d’Ascq, FR
[email protected]
ABSTRACT
This paper proposes to investigate the impact of the channel model for authentication systems based on codes that are corrupted by a physically unclonable noise such as the one emitted by a printing process. The core of such a system is the comparison for the receiver between an original binary code, an original corrupted code and a copy of the original code. We analyze two strategies, depending on whether or not the receiver use a binary version of its observation to perform its authentication test. By deriving the optimal test within a Neyman-Pearson setup, a theoretical analysis shows that a thresholding of the code induces a loss of performance. This study also highlights the fact that the probability of the type I and type II errors can be better approximated, by several orders of magnitude, computing Chernoff bounds instead of the Gaussian approximation. Finally we evaluate the impact of an uncertainty for the receiver on the opponent channel and show that the authentication is still possible whenever the receiver can observe forged codes and uses them to estimate the parameters of the model.
Categories and Subject Descriptors
K.6.5.0 [Management of Computing and Information Systems]: Computer Security and Protection—Authentica-tion
; H.1.1 [Models and Principles]: Systems and Informa-tion Theory—InformaInforma-tion theory
Permission to make digital or hard copies of all or part of this work for personal or classroom use is granted without fee provided that copies are not made or distributed for profit or commercial advantage and that copies bear this notice and the full citation on the first page. To copy otherwise, to republish, to post on servers or to redistribute to lists, requires prior specific permission and/or a fee.
IH&MMSec’13,June 17–19, 2013, Montpellier, France. Copyright 2013 ACM 978-1-4503-2081-8/13/06 ...$15.00.
Keywords
Authentication, Statistical Analysis, Hypothesis testing, Bi-nary thresholding
1.
INTRODUCTION
Authentication of physical products such as documents, goods, drugs, jewels, is a major concern in a world of global exchanges. According to the Organization for Economic Co-operation and Development (OECD), international trade in counterfeit and pirated goods reached more than US $250 billion in 2009 [10], additionally the World Health Orga-nization in 2005 claimed that nearly 25% of medicines in developing countries are forgeries [9].
One way to perform authentication of physical products is to rely on the stochastic structure of the material that composes the product. Authentication can be performed for example by recording the random patterns of the fiber of a paper [6], but such a system is practically heavy to deploy since each product needs to be linked to its high def-inition capture stored in a database. Another solution is to rely on the degradation induced by the interaction between the product and a physical process such as printing, mark-ing, embossmark-ing, carving ... Because of both the defaults of the physical process and the stochastic nature of the mater, this interaction can be considered as a Physically Unclon-able Function (PUF) [12] that cannot be reproduced by the forger and can consequently be used to perform authentica-tion. In [5], the authors measure the degradation of the inks within printed color-tiles, and use discrepancy between the statistics of the authentic and print-and-scan tiles to per-form authentication. Other marking techniques can also be used, in [11] the authors propose to characterize the ran-dom profiles of laser marks on materials such as metals (the technique is called LPUF for Laser-written PUF) and to use them as authentication features.
We study in this paper an authentication system which uses the fact that a printing process at very high resolution can be seen as a stochastic process due to the nature of differ-ent elemdiffer-ents such as the paper fibers, the ink heterogeneity,
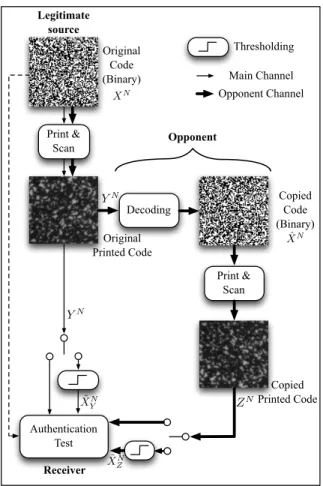
or the dot addressability of the printer. Such an authenti-cation system has been proposed by Picard et al. [8, 7] and uses 2D pseudo random binary codes that are printed at the native resolution of the printer (2400 dpi on a standard off-set printer or 812 dpi on digital HP Indigo printer). The whole system is depicted on Fig. 1: once printed on a pack-age to be authenticated, the degraded code can be scanned and thresholded by an opponent (the forger). Note that at this stage the thresholding is necessary because the indus-trial printers can only print dots, e.g. binary versions of the scanned code. The opponent will produce a printed copy of the original code to manufacture his forgery and the receiver will compare the scanned (and potentially post-processed) version of the original code with the scanned (and poten-tially post-processed) version of the copied code in order to perform authentication. One advantage of this system over previously cited ones is that it is easy to deploy since the au-thentication process needs only a scan of the graphical code under scrutiny and the seed used to generate the original one, no fingerprint database is required.
Original Code (Binary) Original Printed Code Print & Scan Decoding Print & Scan Copied Code (Binary) Authentication Test Opponent Copied Printed Code Receiver XN YN ˆ XN ZN Legitimate source Main Channel Opponent Channel Thresholding YN ˜ XN Y ˜ XN Z
Figure 1: Principle of authentication using graphical codes.
The security of this system solely relies on the use of a PUF, i.e. the impossibility for the opponent to accurately estimate the original binary code. Different security analysis have already been performed w.r.t. this authentication sys-tem, or to very similar ones. In [1], the authors have studied the impact of multiple printed observations of same graphi-cal codes and the authors have shown that the power of the
noise due to the printing process can be reduced in this par-ticular setup. In [3], the authors use machine learning tools in order to try to infer the original code from an observation of the printed code, their study shows that the estimation accuracy can be increased without recovering perfectly the original code. In [2], the authors consider the security analy-sis in the rather similar setup of passive fingerprinting using binary fingerprints under informed attacks (the channel be-tween the original code and the copied code is assumed to be a Binary Symmetric Channel), they show that the security increase with the code length and they propose a practical threshold when type I error (original detected as a forgery) and type II error (forgery detected as an original) are equal. The goal of this paper is to analyze what are the different strategies for the receiver with respect to the post-processing step. We assume that the strategy of the opponent is fixed and that the copied binary code suffers a binary input binary output channel. We show that it is in the receiver’s interest to process directly the scanned grayscale code instead of a binary version and we evaluate the impact of the Gaussian approximation of the test with respect to its asymptotic ex-pression. We also investigate the impact of the estimation of the opponent printing channel over the authentication per-formances.
2.
AUTHENTICATION CHANNEL
2.1
Notations
We designate sets by calligraphic font e.g.X and random variables (RV) ranging over these sets by the same italic capitals e.g. X. The cardinality of the set X is denoted by |X |. The sequence of N variables (X1, X2, ...., XN) is
denoted XN.
2.2
The setup
The authentication sequence is a binary sequence XN
cho-sen at random from the message set XN, and is shared
se-cretly with the legitimate receiver. In our authentication model, XNis published as a noisy version YN, taking values
in the set of pointsVN (see Fig. 1). An opponent may ob-serve YNand, naturally, tries to retrieve the original authen-tication sequence. He obtains an estimated sequence ˆXN
and prints it to forge a fake sequence ZN hoping that it will
be accepted by the receiver as coming from the legitimate source. The receiver observes then a sequence ON which
may be one of the two possible sequences YN or ZN, and
has to decide whether it comes from the legitimate source or not.
The authentication model may then be viewed as a secret communication problem involving two channelsX ! (Y, Z), where unreliable communication is desired for one of them (the opponent channel), and perfect communication for the second one (the main channel). We define the main chan-nel as the chanchan-nel between the legitimate source and the receiver, and the opponent channel as the channel between the legitimate source and the receiver but passing through the counterfeiter channel (see Fig. 1).
2.3
Channel modeling
Let PV /X be the generic transition matrix modeling the
whole physical processes used here, precisely printing and scanning devices. The entries of this matrix are conditional probabilities PV /X(v/x) relating the input alphabetX and
the output alphabet V of the whole processes. In practi-cal and realistic situations,X is a binary alphabet standing with black (0) and white (1) elements of a digital code and the channel output set V stands for the set of gray level values with cardinality K (for printed and scanned images, K = 256 ). Transition matrix PV /X may be any discrete
distribution over the set V. In our global authentication model, the two channelsX ! (Y, Z) are considered being discrete and memoryless with conditional probability dis-tribution PY Z/X(y, z/x). The marginal channels PY /X and
PZ/X constitute the transition probability matrices of the
main channel and the opponent channel respectively. While PY /X = PV /X , PZ/X depends on the opponent processing.
We aim here at expressing this marginal distribution consid-ering that the opponent tries to restore the original sequence before publishing his fraudulent sequence ZN.
When performing a detection to obtain an estimated se-quence ˆXN of the original code, the opponent undergoes
errors. These errors are evaluated with probabilities Pe,W
when confusing an original white dot with a black and Pe,B
when confusing an original black dot with a white. This distinction is due to the fact that the channel distribution PV /Xof the physical devices is arbitrary and not necessarily
symmetric. Let DW and DWc be respectively the optimal
decision regions for decoding white or black, obtained after using classical maximum likelihood decoding. As the oppo-nent observes YN(we assume that all the physical processes involved are identical for the main channel and the opponent channel), the decision regions will be defined as:
DW =!v 2 V : PV /X(v/X = 1) > PV /X(v/X = 0) . (1)
Recalling that PY /X = PV /X , error probabilities Pe,W and
Pe,Bare equal to:
Pe,W = X v2Dc W PY /X(v/X = 1), (2) Pe,B= X v2DW PY /X(v/X = 0). (3)
The channel X ! ˆX can be modeled as a Binary Input Binary Output channel (BIBO) with transition probability matrix PX/Xˆ : 1− Pe,B Pe,B Pe,W 1− Pe,W % (4) As we can see in Fig. 1, the opponent channelX ! Z is a physically degraded version of the main channel. Thus, X ! ˆX ! Z forms a Markov chain with the relation PXZ/Xˆ (ˆx, z/x) = PX/Xˆ (ˆx/x)PZ/ ˆX(z/ˆx). Components of
the marginal channel matrix PZ/X are:
PZ/X(Z = v/x) = X ˆ x=0,1 PXZ/Xˆ (ˆx, Z = v/x) = X ˆ x=0,1 PX/Xˆ (ˆx/x)PZ/ ˆX(Z = v/ˆx). (5)
If we assume that the physical processes are identical for the main channel and the opponent channel (PZ/ ˆX = PY /X =
PV /X) the components of the marginal channel matrix PZ/X
will be expressed as:
PZ/X(Z = v/X = 0) = (1− Pe,B)PV /X(v/X = 0) +Pe,BPV /X(v/X = 1), (6) PZ/X(Z = v/X = 1) = (1− Pe,W)PV /X(v/X = 1) +Pe,WPV /X(v/X = 0). (7)
2.4
Receiver’s strategies
Two strategies are possible for the receiver.
2.4.1
Binary thresholding:
As a first strategy the receiver decodes the observed se-quenceON using maximum likelihood criterion and restores
a binary version ˜XN of the original message XN. Error probabilities in the main channel, i.e. whenON= YN, are
the same as (2) and (3). In the opponent channel, i.e. when ON= ZN, these probabilities are:
˜ Pe,W = X v2Dc W PZ/X(v/X = 1), (8) ˜ Pe,W = X v2Dc W (1− Pe,W)PV /X(v/X = 1) + Pe,WPV /X(v/X = 0). Finally we have: ˜
Pe,W = (1− Pe,W)Pe,W+ Pe,W(1− Pe,B). (9)
The same development yields: ˜
Pe,B = (1− Pe,B)Pe,B+ Pe,B(1− Pe,W). (10)
For this first strategy, the opponent channel may be viewed as the cascade of two binary input/binary output channels:
1− ˜Pe,B P˜e,B ˜ Pe,W 1− ˜Pe,W % = 1− Pe,B Pe,B Pe,W 1− Pe,W % ⇥ 1− Pe,B Pe,B Pe,W 1− Pe,W % . (11) When the channel distribution PV /X is symmetric, we
have Pe,W = Pe,B = p, and expressions (9) and (10) are
unified giving ˜p = 2p(1− p). We recognize here the cross over probability of two cascaded binary symmetric channels with cross probability p. As we will see in the next section, the test that the receiver will perform to decide whether the observed decoded sequence ˜XN comes from the legitimate source or not is tantamount to counting the number of errors in this case.
2.4.2
Grey level observations:
In the second strategy, the receiver performs his test di-rectly on the received sequence ON without any given
de-coding. We will see in the next section that this strategy is better than the previous one for authentication.
3.
HYPOTHESIS TESTING
As the observed sequence may come from the legitimate receiver or from a counterfeiter, the receiver considers two hypothesis H0 and H1 corresponding respectively to each of
the former cases. This problem is formulated by the fact that the observed sequence may be described by two prob-abilities, say Q0 and Q1. A decision rule will assign one of
the two hypothesis for each possible observed sequence and the observed sequence space will then be partitioned into two regionsH0 and H1. Accepting hypothesis H0 while it
is actually a fake (H1 is true) leads to an error of type II
having probability β. Rejecting hypothesis H0 while
actu-ally the observed sequence comes from the legitimate source (H0 is true) leads to an error of type I with probability ↵.
An optimal decision rule will be given by the Neyman Pear-son criterion. The eponymous theorem states that under the constraint ↵ ↵⇤, β is minimized when the choice of H
0 is
done if only if the following log-likelihood test is verified: logQ0(v
N)
Q1(vN) ≥ γ,
(12) where γ is a threshold verifying the constraint ↵ ↵⇤.
3.1
Binary thresholding:
In the first strategy, the final observed data is ˜XN and the original sequence XN is a side information containing
two types of data (”0” and ”1”). The distribution of each component ( ˜Xi, Xi) of the sequence ( ˜XN, XN) is the same
for each of these types. We derive now the probabilities that describe ˜XN for each of the two possible hypothesis. Under hypothesis Hj, j2 {0, 1}, these probabilities are expressed
conditionally to the known original code: P ( ˜XN = ˜xN/XN= xN, Hj) = NB Y i/Xi=0 P (˜xi/Xi= 0, Hj) ⇥ N W Y i/Xi=1 P (˜xi/Xi= 1, Hj),
where NBand NW are respectively the number of black and
white components in the original code.
• Under hypothesis H0 the channel X! ˆX has
distri-butions given by (2) and (3) and we have: P⇣x˜N/xN, H0
⌘
= (Pe,B)ne,B(1− Pe,B)NB−ne,B
⇥ (Pe,W)ne,W(1− Pe,W)NW−ne,W,
where ne,Band ne,Ware the number of errors (˜xi6= xi) when
black is decoded into white and when white is decoded into black respectively.
• Under hypothesis H1, the channel X ! ˆX has
distri-butions given by (9) and (10) and we have: P⇣x˜N/xNH1
⌘
= ( ˜Pe,B)ne,B(1− ˜Pe,B)NB−ne,B
⇥ ( ˜Pe,W)ne,W(1− ˜Pe,W)NW−ne,W.
Applying now the Neyman Pearson criterion (12) the test is expressed as: L1= log P⇣ ˜XN= ˜xN/XN= xN, H 1 ⌘ P⇣ ˜XN= ˜xN/XN= xN, H0⌘ H1 ? H0 γ, (13) L1 = ne,Blog ✓P˜ e,B(1− Pe,B) Pe,B(1− ˜Pe,B) ◆ + ne,Wlog ✓ ˜ Pe,W(1− Pe,W) Pe,W(1− ˜Pe,W) ◆H1 ? H0 λ1, (14) where λ1 = γ − NBlog ⇣1− ˜P B 1−PB ⌘ − NWlog ⇣1− ˜P W 1−PW ⌘ . For symmetric channels, this expression is simplified by
ne,B+ ne,W
H1
?
H0
λ01. (15)
This expression of the test has the practical advantage to only count the number of errors in order to perform the au-thentication task without even knowing the opponent chan-nel, but at a cost of a loss of optimality.
3.2
Grey level observations:
In the second strategy, the observed data isON. Here
again, the distribution of each component (Oi, Xi) of the
sequence (ON, XN) is the same for each type of data of X.
The Neyman Pearson test is expressed as: L2= log P (ON= vN/XN = xN, H 1) P (ON= vN/XN = xN, H 0) H1 ? H0 λ2, (16)
which can be developed as
L2 = NW X i/Xi=1 logPZ/X(Oi= v/Xi= 1) PY /X(Oi= v/Xi= 1) (17) + NB X i/Xi=0 logPZ/X(Oi= v/Xi= 0) PY /X(Oi= v/Xi= 0) H1 ? H0 λ2, L2= NW P i/Xi=1 log ✓ 1− Pe,W+ Pe,W PV /X(Oi/0) PV /X(Oi/1) ◆ + NB P i/Xi=0 log ✓ 1− Pe,B+ Pe,B PV /X(Oi/1) PV /X(Oi/0) ◆H1 ? H0 λ2. (18) Note that here the expressions of the channel models
PV /X(Oi/Xi) are required in order to perform the optimal
test.
3.3
Performance of hypothesis testing
3.3.1
The Gaussian approximation
In the previous section we have expressed the Neyman-Pearson test for the two proposed strategies resumed by (14) and (18). These tests may then be practically performed on the observed sequence in order to make a decision about its authenticity. We aim now at expressing the error prob-abilities of type I and II, and comparing the two possible strategies described previously. Let m = 1, 2 be the index denoting the strategy, a straightforward calculation gives
↵m= X l>λm PLm(l/H0), (19) βm= X l<λm PLm(l/H1). (20)
As the length N of the sequence is generally large, we use the central limit theorem to study the distributions PLm,
m = 1, 2.
For the binary thresholding strategy, the observed sequence is ˆXN. In (14) n
with parameters depending on the source of the observed se-quence, i.e. if it comes from the legitimate source or from the counterfeiter. Let Nx and Pe,x stand respectively for
the number data of type x in the original code and the cross over probabilities of the BIBO channels (4) and (11). When N is large enough, the binomial random variables are ap-proximated with a Gaussian distribution. We have:
ne,x⇠ N (NxPe,x, NxPe,x(1− Pe,x)). (21)
One can obviously now deduce the parameters of the normal approximation describing the log-likelihood L1.
For the second strategy, i.e. when the receiver tests di-rectly the observed gray level sequence, the log-likelihood L2 Eq. (18) may be expressed as two sums of i.i.d. and
becomes: L2 = NW X i/Xi=1 `(Oi; 1) + NB X i/Xi=0 `(Oi; 0) H1 ? H0 λ2, (22)
where `(v; x) is a function ` : V !R with parameter x = 0, 1 and having some distribution with mean and variance equal to: µx= E[`(V ; x)| Hj] = X v2V `(v, x)PV /X(v/x), (23) and var[`(V ; x)| Hj] = X v2V (`(v, x)− µx)2PV /X(v/x), (24)
with PV /X = PY /X (resp. PV /X = PZ/X ) for j = 0 (resp.
1) . The central limit theorem is then used again for the distribution of L2 to compute the type I and type II error
probabilities.
3.3.2
Asymptotic expression
One important problem is the fact that the Gaussian ap-proximation proposed previously provides inaccurate error probabilities when the threshold λm in (19) and (20) is far
from the mean of the random variable Lm. Chernoff bound
and asymptotic expression are preferred in this context as very small error probabilities of type I and II may be de-sired [4]. Given a real number s the Chernoff bound on type I and II errors may be expressed for m = 1, 2 as:
↵m= Pr(Lm≥ λm) e−sλmgLm(s) for any s > 0, (25)
βm= Pr(Lm λm) e−sλmgLm(s) for any s < 0, (26)
where the function gLm(s) is the moment generating
func-tion of Lmdefined as:
gLm(s) = ELm
h
esLmi. (27)
These bounds are significant for λmfar from E [Lm], namely
when bounding the tails of a distribution. The tightest bound is obtained by finding the value of s that provides the minimum of the RHS of (25) and (26), i.e. the min-imum of e−sλmg
Lm(s). Taking the derivative, the value s
that provides the tightest bound is such that1:
λm= dgLm(s) ds gLm(s) = d dsln gLm(s). (28)
1(one can show that e−sλmg
Lm(s) is convex)
Reminding that Lmis a sum of N independant random
vari-ables, asymptotic analysis in probability theory (when N is large enough) shows that bounds similar to (25) and (26) are much more appropriate for estimating ↵mand βmthan the
Gaussian approximation. To make this more clear, we will introduce the semi-invariant moment generating function af-ter an acute observation of the identity (28). The semi-invariant moment generating function of Lm is µLm(s) =
ln gLm(s). This function has many interesting properties
that ease the extraction of an asymptotic expression for (25) and (26) [4]. For instance, this function is additive for the sum of independant random variables, which yields for ex-ample for m = 2: µL2(s) = NW X i/Xi=1 µ`i/1(s) + NB X i/Xi=0 µ`i/0(s), (29)
where µ`i/x(s) is the semi-invariant moment generating func-tion of the random variable `i/x = `(Oi; x). In addition,
the s optimizing the bound and obtained from (28) may be driven from the sum of the derivatives:
λm= NW X i/Xi=1 µ0`i/1(s) + NB X i/Xi=0 µ0`i/0(s). (30)
Chernoff bounds on type I and II errors (25) and (26) may then be expresses as:
↵m = Pr(Lm≥ λm) exp 2 4 NW X i/Xi=1 0µ`i/1(s)− sµ0`i/1(s) 1 (31) + NB X i/Xi=0 0µ`i/0(s)− sµ0`i/1(s) 1 3 5 for any s > 0, and βm = Pr(Lm λm) exp 2 4 NW X i/Xi=1 0µ`i/1(s)− sµ0`i/1(s) 1 (32) + NB X i/Xi=0 0µ`i/0(s)− sµ0`i/1(s) 1 3 5 for any s < 0.
The distribution of each component (Oi, Xi) of the sequence
(ON, XN) is the same for each type of data of X, and
µ`i/x(s) = µ`/x(s) is independent from i for a given type
of data x = 0, 1. The RHS in (31) and (32) can be simpli-fied as: exp⇥NW0µ`/1(s)− sµ 0 `/1(s)1 + NB0µ`/0(s)− sµ 0 `/0(s)1⇤ . (33) The asymptotic expression is evaluated (see [4], Appendix 5A) for the sum of i.i.d and for large N we have (for NB⇡
NW ⇡ N/2), for s > 0: ↵m = Pr(Lm≥ λm) ! N !1 1 |s|pN ⇡µ00 `(s) exp!N 2 [µ`(s)− sµ0`(s)] . (34) and for s < 0:
βm = Pr(Lm λm) ! N !1 1 |s|pN ⇡µ00 `(s) exp!N 2 [µ`(s)− sµ0`(s)] . (35) where µ`(s) = µ`/0(s) + µ`/1(s) , µ0`(s) = µ0`/0(s) + µ0`/1(s), and µ00
`(s) = µ00`/0(s) + µ00`/1(s) is the second derivative of
the semi invariant moment generating function of random variable `(v; x) defined by:
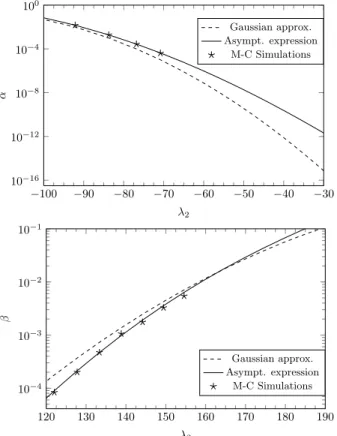
`(v; 0) = log ✓ 1− Pe,W + Pe,W PV /X(v/0) PV /X(v/1) ◆ , `(v; 1) = log ✓ 1− Pe,B+ Pe,B PV /X(v/1) PV /X(v/0) ◆ . Fig. 2 illustrates the gap between the estimation of ↵ and β using the Gaussian approximation and the asymptotic ex-pression. The Monte-Carlo simulations confirm the fact that the derived Chernoff bounds are tight.
−100 −90 −80 −70 −60 −50 −40 −30 10−16 10−12 10−8 10−4 100 λ2 α Gaussian approx. Asympt. expression M-C Simulations 120 130 140 150 160 170 180 190 10−4 10−3 10−2 10−1 λ2 β Gaussian approx. Asympt. expression M-C Simulations
Figure 2: Comparison between the Gaussian ap-proximation, the asymptotic expression and Monte-Carlo simulations (106trials) for the second strategy, N = 2000, σ = 50.
3.4
Comparison between the two strategies
In this setup and without loss of generality, we assume that the print and scan channel is modeled by a discreet non-symmetric and memoryless channel with binary input alpha-betX and grey level outputs V, generated from a normalizeddiscrete Gaussian distribution PV /x(v/x). For x = 0, 1:
PV /x(v/x) = exp(−(v − µx)2/2σ2) P v2V exp(−(v − µx)2/2σ2) . (36) Fig. 3 compares the Receiver Operating Characteristic (ROC) curves associated with the two different strategies, and the impact of the Gaussian approximation. We can no-tice that the gap between the two strategies is important, this is not a surprise since the binary thresholding removes information about the forged code Y , yet this has a practical impact because one practitioner can be tempted to use the weighted bit error rate given in (15) as an authentication score for its easy implementation.
Moreover, as we will see in the next section, the plain scan of the graphical code can be used whenever the receiver needs to estimate the opponent’s channel.
10−20 10−17 10−14 10−11 10−8 10−5 10−2 10−33 10−26 10−19 10−12 10−5 α β
No Thres. Asymp. exp. No Thres. Gauss app.
Thresholding
Figure 3: ROC curves for the two different strategies (N = 2000, σ = 52).
4.
IMPACT OF THE ESTIMATION OF THE
PRINT AND SCAN CHANNEL
The previous scenarios assume that the receiver has a full knowledge of the print and scan channel. Here we assume that the receiver has also to estimate the opponent channel before performing authentication. From the estimated pa-rameters, the receiver will compute a threshold and a test according to a Neyman-Pearson strategy. Depending of the number of observations No, the estimated model and test
will decrease the performance of the authentication system. We consider now that the opponent uses different print-ing device. Accordprint-ing to (6) and (7), the parameters to be estimated are Pe,W, Pe,B, µ0, µ1and σ. We use the classical
Expectation Maximization (E.M.) algorithm combined with the Newton’s method to solve the maximization step.
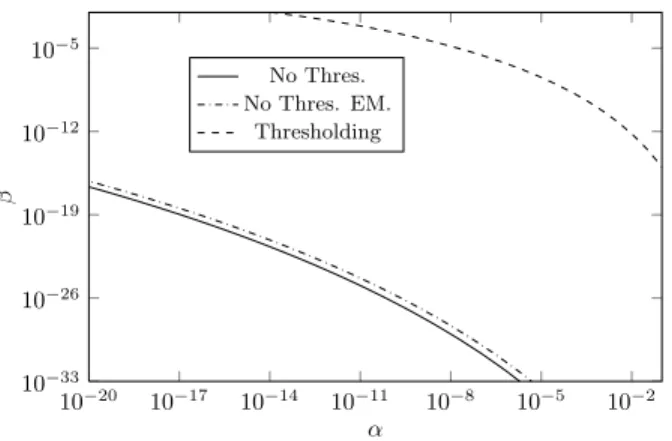
Fig. 4 shows the authentication performances using model estimation for No = 2000 observed symbols. We can notice
that the performance (and the estimated parameters) are very close to an exact knowledge of the model. This analy-sis shows also that if the receiver has some assumptions of the opponent channel and enough observations, he should perform model estimation instead of using the thresholding strategy. Fig. 5 shows the importance of model estimation when comparing it to a blind authentication test when the receiver assumes that both the opponent channel and his channel are identical.
10−20 10−17 10−14 10−11 10−8 10−5 10−2 10−33 10−26 10−19 10−12 10−5 α β No Thres. No Thres. EM. Thresholding
Figure 4: Authentication performance using model estimation with the EM algorithm (N = 2000, No =
2000, σ = 52, µ0 = 50, µ1 = 150). The asymptotic
expression is used to derive the error probabilities.
10−17 10−15 10−13 10−11 10−9 10−7 10−5 10−3 10−33 10−26 10−19 10−12 10−5 α β True Model Est. Model Blind Model
Figure 5: ROC curves comparing different knowl-edges about the channel while the opponent uses a different printing process (σ = 40, µ0 = 40, µ1 =
160). “True model”: the receiver knows exactly this model, “Blind model”: the receiver uses his printing process model as the opponent model, “Est. model”: the receiver estimates the opponent channel using No= 2000 observations.
5.
CONCLUSIONS AND PERSPECTIVES
This papers brings numerous conclusions on the authen-tication using binary codes corrupted by a manufacturing stochastic noise:• The nature of the receiver’s input is of upmost impor-tance and thresholding is a bad strategy with respect to getting an accurate version of the genuine or forged code, except if the system requires it.
• The Gaussian approximations used to compute the ROC of the authentication system are not valuable anymore for very low type I or type II errors. Cher-noff bounds have to be used instead.
• If the opponent’s print and scan channel remains un-known for the receiver, he can use estimation tech-niques such as the E.M algorithm in order to estimate the channel.
• The proposed methodology is not impacted by the na-ture of the noise, and can be applied for different mem-oryless channels that are more realistic for modeling the printing process.
Our futures works plan to address the potential benefits for authentication of structured codes such as error-correcting codes.
6.
ACKNOWLEDGEMENTS
This work was partly supported by the National French project ANR-10-CORD-019 “Estampille”.
7.
REFERENCES
[1] C. Baras, F. Cayre, et al. 2D bar-codes for
authentication: A security approach. Proceedings of EUSIPCO 2012, 2012.
[2] F. Beekhof, S. Voloshynovskiy, and F. Farhadzadeh. Content authentication and identification under informed attacks. In Information Forensics and Security (WIFS), 2012 IEEE International Workshop on, pages 133–138. IEEE, 2012.
[3] M. Diong, P. Bas, C. Pelle, and W. Sawaya. Document authentication using 2D codes: Maximizing the decoding performance using statistical inference. In Communications and Multimedia Security, pages 39–54. Springer, 2012.
[4] R.G. Gallager. Information theory and reliable communication, volume 15. Wiley, 1968.
[5] M.D. Gaubatz, S.J. Simske, and S. Gibson. Distortion metrics for predicting authentication functionality of printed security deterrents. In Image Processing (ICIP), 2009 16th IEEE International Conference on, pages 1489–1492. IEEE, 2009.
[6] T. Haist and H.J. Tiziani. Optical detection of random features for high security applications. Optics communications, 147(1-3):173–179, 1998.
[7] J. Picard, C. Vielhauer, and N. Thorwirth. Towards fraud-proof id documents using multiple data hiding technologies and biometrics. SPIE
Proceedings–Electronic Imaging, Security and Watermarking of Multimedia Contents VI, pages 123–234, 2004.
[8] J. Picard and J. Zhao. Improved techniques for detecting, analyzing, and using visible authentication patterns, July 28 2005. WO Patent WO/2005/067,586. [9] WCO Press. Global congress addresses international
counterfeits threat immediate action required to combat threat to finance/health, 2005. ”http://www. wcoomd.org/en/media/newsroom/2005/november”. [10] WCO Press. Counterfeiting and piracy endangers
global economic recovery, say global congress leaders, 2009. ”http://www.wipo.int/pressroom/en/ articles/2009/article_0054.html”.
[11] S.S. Shariati, F.X. Standaert, L. Jacques, B. Macq, M.A. Salhi, and P. Antoine. Random profiles of laser marks. In Proceedings of the 31st WIC Symposium on Information Theory in the Benelux, 2010.
[12] G.E. Suh and S. Devadas. Physical unclonable functions for device authentication and secret key generation. In Proceedings of the 44th annual Design Automation Conference, pages 9–14. ACM, 2007.