HAL Id: hal-03102695
https://hal.archives-ouvertes.fr/hal-03102695
Submitted on 8 Jan 2021
HAL is a multi-disciplinary open access
archive for the deposit and dissemination of
sci-entific research documents, whether they are
pub-lished or not. The documents may come from
teaching and research institutions in France or
abroad, or from public or private research centers.
L’archive ouverte pluridisciplinaire HAL, est
destinée au dépôt et à la diffusion de documents
scientifiques de niveau recherche, publiés ou non,
émanant des établissements d’enseignement et de
recherche français ou étrangers, des laboratoires
publics ou privés.
Distributed under a Creative Commons Attribution| 4.0 International License
Cancer Uncovers a Novel Combinatorial Treatment
Overcoming Primary Drug Resistance
Fabienne Lamballe, Fahmida Ahmad, Yaron Vinik, Olivier Castellanet,
Fabrice Daian, Anna-katharina Müller, Ulrike Köhler, Anne-laure Bailly,
Emmanuelle Josselin, Rémy Castellano, et al.
To cite this version:
Fabienne Lamballe, Fahmida Ahmad, Yaron Vinik, Olivier Castellanet, Fabrice Daian, et al..
Mod-eling Heterogeneity of Triple-Negative Breast Cancer Uncovers a Novel Combinatorial Treatment
Overcoming Primary Drug Resistance. Advanced Science, Wiley Open Access, 2020, pp.2003049.
�10.1002/advs.202003049�. �hal-03102695�
www.advancedscience.com
Modeling Heterogeneity of Triple-Negative Breast Cancer
Uncovers a Novel Combinatorial Treatment Overcoming
Primary Drug Resistance
Fabienne Lamballe,* Fahmida Ahmad, Yaron Vinik, Olivier Castellanet, Fabrice Daian,
Anna-Katharina Müller, Ulrike A. Köhler, Anne-Laure Bailly, Emmanuelle Josselin,
Rémy Castellano, Christelle Cayrou, Emmanuelle Charafe-Jauffret, Gordon B. Mills,
Vincent Géli, Jean-Paul Borg, Sima Lev, and Flavio Maina*
Triple-negative breast cancer (TNBC) is a highly aggressive breast cancer subtype characterized by a remarkable molecular heterogeneity. Currently, there are no effective druggable targets and advanced preclinical models of
the human disease. Here, a unique mouse model (MMTV-R26Metmice) of
mammary tumors driven by a subtle increase in the expression of the
wild-type MET receptor is generated. MMTV-R26Metmice develop
spontaneous, exclusive TNBC tumors, recapitulating primary resistance to
treatment of patients. Proteomic profiling of MMTV-R26Mettumors and
machine learning approach show that the model faithfully recapitulates intertumoral heterogeneity of human TNBC. Further signaling network analysis highlights potential druggable targets, of which cotargeting of WEE1 and BCL-XL synergistically kills TNBC cells and efficiently induces tumor regression. Mechanistically, BCL-XL inhibition exacerbates the dependency of
TNBC cells on WEE1 function, leading to Histone H3 and phosphoS33RPA32
upregulation, RRM2 downregulation, cell cycle perturbation, mitotic
catastrophe, and apoptosis. This study introduces a unique, powerful mouse model for studying TNBC formation and evolution, its heterogeneity, and for identifying efficient therapeutic targets.
Dr. F. Lamballe, Dr. F. Ahmad, O. Castellanet, F. Daian, Dr. F. Maina Aix Marseille Univ
CNRS
Developmental Biology Institute of Marseille (IBDM) Turing Center for Living Systems
Parc Scientifique de Luminy Marseille 13009, France
E-mail: fabienne.lamballe@univ-amu.fr; flavio.maina@univ-amu.fr Dr. Y. Vinik, Dr. A.-K. Müller, Dr. U. A. Köhler, Prof. S. Lev
Department of Molecular Cell Biology Weizmann Institute of Science Rehovot 76100, Israel
The ORCID identification number(s) for the author(s) of this article can be found under https://doi.org/10.1002/advs.202003049 © 2020 The Authors.Advanced Science published by Wiley-VCH GmbH.
This is an open access article under the terms of the Creative Commons Attribution License, which permits use, distribution and reproduction in any medium, provided the original work is properly cited.
DOI: 10.1002/advs.202003049
1. Introduction
Genetically engineered mouse models (GEMMs) of breast cancer have been proven as a powerful tool for gaining mechanistic insights into tumor initiation, progression, and metastasis as well as for developing innovative cancer therapy.[1]
GEMM models for breast cancer commonly use mammary-gland specific promoters, including MMTV (virus long terminal repeat), WAP (whey acidic protein), and C3 to ensure expression of transgenes in the mammary epithelium. More than 25 different murine GEMMs for breast cancer expressing different genes/oncogenes such as, PyMT (polyoma middle T antigen), SV40 T antigen, ErbB2/Neu, cyclinD1, Ras, Myc,
TGF-𝛼, and Wnt1 have been established.[2]
The most widely used models are
MMTV-Neu and MMTV-PyMT, which result in the
development of multifocal adenocarcinoma and metastatic lesions in the lungs and/or lymph nodes. MMTV-Neu mice have been
Dr. A.-L. Bailly, Dr. C. Cayrou, Dr. V. Géli, Prof. J.-P. Borg Aix Marseille Univ
Centre de Recherche en Cancérologie de Marseille (CRCM) Equipes labellisées Ligue ‘Cell polarity, cell signaling and cancer’ and ‘Telomere and Chromatin’
Inserm CNRS
Institut Paoli-Calmettes Marseille 13009, France E. Josselin, Dr. R. Castellano Aix Marseille Univ Inserm CNRS Institut Paoli-Calmettes CRCM TrGET Platform Marseille 13009, France
used for modeling epidermal growth factor receptor 2 (HER2)-positive breast cancer, whereas MMTV-CyclinD1 for estrogen receptor (ER)-positive breast cancer. MMTV-PyMT mice lose the expression of ER𝛼 and progesterone receptor (PR) as they
progress and concomitantly gain androgen receptor (AR) expres-sion, therefore could be used for modelling luminal AR (LAR) positive Triple-Negative Breast Cancer (TNBC).[3]However, only
a small fraction of TNBC patients (≈15%) are positive for AR, while the majority have been classified into different molecular subtypes, including basal-like (BL1 and BL2) and mesenchymal (M).[4,5]
TNBC, which accounts for ≈10–15% of all breast cancer pa-tients, is defined by the lack of ER and PR expression, as well as by the absence of HER2 amplification/overexpression. Com-pared to the other breast cancer subtypes, TNBC is character-ized by the earliest age of onset, a high propensity for metas-tasis, and the worst prognosis in terms of relapse and survival rate.[6–8] Over 80% of TNBC patients exhibit alterations in the
TP53 locus,[9]whereas a smaller fraction has mutations in genes
controlling the PI3K pathway and the homologous recombina-tion machinery (BRCA1/2). A molecular feature of TNBC is the dependency of cancer cells on signals that are rarely mutated, a phenomenon defined as “nononcogene addiction.”[10]
Collec-tively, these traits are among the leading cause of limited efficacy of current TNBC therapies. Radiation therapy and chemotherapy, applied before and after surgery, are the mainstay of treatment, al-though frequently associated with drug resistance and recurrent disease.[6–8]
Extensive efforts have been made to search for molecu-lar targeted therapies effective for TNBC treatment. Although some targeted therapies approved for treatment of other can-cer types have been proposed in TNBC, they rarely turned out to be clinically relevant.[11]These limited responses are
as-sociated with the high heterogeneity of the disease and the lack of suitable immunocompetent preclinical models that re-capitulate the molecular diversity of TNBC. Among potential targets for TNBC subsets are Poly(ADP-Ribose) Polymerase 1 (PARP1), AR, vascular endothelial growth factor receptor, epidermal growth factor receptor (EGFR), MET, PI3K/mTOR, MEK, Cyclin-dependent kinases (CDKs), heat shock protein 90 (HSP90), histone deacetylase (HDAC), hypoxia-inducible factor 1-𝛼 (HIF1-𝛼), and integrins.[11,12]Inhibition of WEE1 kinase has
been proposed as a promising treatment option for TNBC and several other types of solid cancer.[13,14]WEE1 plays a central role
in the G2/M checkpoint and controls DNA synthesis as part of
Prof. E. Charafe-Jauffret Aix Marseille Univ Inserm
CNRS
Institut Paoli-Calmettes CRCM
Experimental Histo-Pathology Platform Marseille 13009, France
Prof. G. B. Mills Knight Cancer Institute Portland, OR 97201, USA Prof. J.-P. Borg
Institut Universitaire de France (IUF) 1 rue Descartes, Paris 75231, France
the S phase checkpoint. Therefore, inhibition of WEE1 is asso-ciated with accumulation of DNA damage and aberrant mito-sis. Coinhibition of WEE1 with either radiotherapy or anticancer drugs such as cisplatin, gemcitabin, paclitaxel, or inhibitors of CDC25, ATR, or PARP causes death of breast cancer cells.[15–22]
The rational of these combined treatments is to associate DNA-damaging therapies together with perturbation of DNA damage checkpoint gatekeepers through WEE1 targeting. Nevertheless, the consequences of WEE1 targeting may be broader than cell cycle regulation, in view of recent studies showing that WEE1 in-activation increases CDK-dependent firing of dormant replica-tion origins thereby leading to replicareplica-tion stress and increased dNTP demand.[23,24]Moreover, WEE1 was reported to modulate
Histone H2B phosphorylation to inhibit transcription of several histone genes in yeast and humans and to function as a histone-sensing checkpoint in budding yeast.[25,26]
We have previously reported the engineering of a unique mouse genetic model in which subtly increased wild-type MET receptor tyrosine kinase (RTK) levels can be triggered in a tem-poral and spatial manner (R26stopMetmice). This model has
illus-trated the vulnerability of specific cells to slightly enhanced RTK levels, notwithstanding the resilience of most cell types.[27–29]For
example, at adulthood enhanced MET levels in the liver trigger spontaneous formation of hepatocellular carcinoma, recapitulat-ing several features of human patients.[29–32]Here, we report the
generation of a unique mouse model (MMTV-R26Met mice) in
which a subtle increase in the expression levels of the wild-type MET RTK leads to spontaneous TNBC formation. The tumori-genic switch correlated with a critical threshold of MET expres-sion, whereas aggressiveness was associated with high MET lev-els and discrete signaling reprogramming. Proteomic profiling, signaling network analysis, and machine learning indicated that the MMTV-R26Met mice not only model different tumorigenic
stages of TNBC, but also largely recapitulates heterogeneity of the human disease as well as primary resistance to treatment. We used this unique model to identify potential therapeutic targets for TNBC through signaling reprogramming analysis and pro-vide strong epro-vidence that combination treatment with BCL-XL and WEE1 inhibitors could be a promising therapeutic approach with high clinical impact.
2. Results
2.1. Enhanced Wild-Type RTK MET Expression Levels in the Mouse Mammary Gland Induce Spontaneous TNBC Development
Previous studies showed that expression of oncogenic MET led to the development of diverse mammary tumors with basal characteristics.[33]We assessed the sensitivity of the mammary
gland to slightly increased wild-type MET levels by crossing the MMTV-Cre transgenic with R26stopMet mice (referred to as
MMTV-R26Met). The specificity of the LacZ-stop cassette
dele-tion obtained by the MMTV-Cre mice[34]was evaluated using the
R26stopMet-Lucmice,[29]in which Mettgis followed by an internal
ri-bosome entry site-Luciferase reporter (Figure 1a). In vivo imag-ing of female MMTV-R26Met-Lucmice revealed a strong luciferase
signal in mammary glands only after the first lactation (Fig-ure 1b), consistent with the expression of the Cre recombinase
Figure 1. Increased expression of wild-type MET levels in the mouse mammary gland leads to TNBC formation. a) Strategy used to enhance wild-type
MET in the mammary gland of mice. TheR26stopMetmouse line, carrying the LacZ-stop cassette followed by chimericMettg, was crossed with the
MMTV-Cre mice, carrying the MMTV-Cre recombinase under the control of the mouse mammary tumor virus MMTV promoter. After recombination, expression of the Mettgis ensured by the removal of the LacZ-stop cassette (MMTV-R26Metmice). The same strategy was used to generate transgenic mice carrying the
LacZ-stop cassette followed byMettgand IRES-Luciferase before (R26stopMet-Luc) and after (MMTV-R26Met-Luc) Cre-mediated recombination. b)
Non-invasive in vivo bioluminescence imaging ofMMTV-R26Met-Lucmice. Imaged mice were either not pregnant, under lactation (first or second lactation
cycle), or in postlactation phase (n = 6 mice per group). Although mainly detected in the mammary glands, low luciferase expression was also observed
in the salivary gland (asterisk), in the skin of the paws and tail (white arrowhead), which is due to partial leakage of theMMTV-Cre line, as previously
reported.[34]The five pairs of the mouse mammary glands are depicted on the scheme in the left. c) RT-qPCR analyses showing transcript levels of
the endogenous mouseMet (mMet), Hgf, and the Mettg, in mammary glands of eitherMMTV (upper left panel) or MMTV-R26Met(lower panel) mice.
Mammary fat pads of three different mice were used for each stage. The age of each mouse is indicated (for virgin animals (V): in weeks; for the other stages: pregnancy (Pg), lactation (Lact), and postlactation (PL): in days). The scheme on the top right illustrates the dynamic expression of the various transcripts. Note that during lactation, the expression levels of the endogenousMet and Hgf transcripts are very low, whereas expression of the Mettg
is maintained. d) Kaplan–Meier analysis of mammary gland tumor incidence inMMTV-R26Met(n = 32), control (R26STOPMet,n = 17), and
MMTV-ErbB2 mice (n = 19) generated in the same mixed (C57/129, 50%/50%) genetic background (MMTV-MMTV-ErbB2mix). e) Representative histopathological and
immunohistological analysis ofMMTV-R26Mettumors (n = 24) using hematoxylin/eosin (H&E), anti-human MET staining to detect expression of the
MET transgene (METtg), anti-Ki67 to assess the proliferative index. Expressions of the estrogen- (ER), progesterone-(PR), and ErbB2 receptors (HER2)
following MMTV promoter activation by prolactin.[35,36]This led
to removal of the stop cassette, and thus Mettgexpression in the
mammary gland of MMTV-R26Metmice (Figure 1a). Consistently,
the Luciferase-positive domains further increased after the sec-ond lactation and were significantly reduced in postlactating fe-males, in agreement with involution of the mammary gland oc-curring when the lactation phase is over (Figure 1b). This imag-ing analysis exemplifies the remodelimag-ing of the mammary gland overtime. In view of a dynamic regulation of the HGF/MET sys-tem in mammary gland morphogenesis previously reported,[37,38]
we assessed Met and Hgf mRNA levels in MMTV-R26Met and
control mice from the virgin to the postlactation state. RT-qPCR analysis revealed comparable dynamics of Met and Hgf transcript expression in both MMTV-R26Met and control mice: high
lev-els at virgin state, a progressive downregulation during preg-nancy, reaching almost undetectable levels during lactation, and a restoration of Met and Hgf levels at the postlactation stage (Fig-ure 1c). Whereas Mettgexpression was undetectable in virgin
an-imals, it became evident starting from the pregnancy stage, co-herent with MMTV promoter activation by prolactin,[35,36] and
remained expressed during subsequent phases. Western blot analysis confirmed METtgexpression in the mammary gland of
MMTV-R26Metmice (Figure S1a, Supporting Information). The
presence of HGF in the stroma surrounding the gland likely en-sures full signaling competence of the METtg, as we previously
reported in embryonic hepatocytes.[27,29,32]
We therefore hypothesized that the MMTV-R26Metmice could
be an appropriate genetic setting to assess the vulnerability of the mammary gland to subtle perturbation of wild-type MET lev-els overtime. In view of remarkable changes occurring during mammary gland morphogenesis, illustrated by our biolumines-cence imaging and transcriptional analyses, and the suscepti-bility of parity-induced mammary epithelial subtypes to signal-ing perturbations,[39] MMTV-R26Met mice were kept under
re-peated cycles of pregnancy. Overtime, a proportion of
MMTV-R26Metmice spontaneously developed mammary gland tumors
(Figure 1d). Remarkably, the kinetic of tumor formation was similar to that of MMTV-ErbB2 mice generated in the same ge-netic background we used as reference (MMTV-ErbB2mix;
Fig-ure 1d; FigFig-ure S1b, Supporting Information). The percentage of mice with tumors correlated with the severity in RTK alteration: 16% of MMTV-R26Metmice (with enhanced wild-type MET)
de-veloped tumors (32/196) compared to 58% of MMTV-ErbB2mix
mice (with oncogenic HERBB2 overexpression; 11/19; Figure 1d; Figure S1b, Supporting Information). A proportion of
MMTV-R26Metmice with mammary gland tumors also developed lung
metastasis (19%; 6/32; Figure S1c, Table S1, Supporting Informa-tion). Histological analyses of the MMTV-R26Mettumors revealed
highly aggressive and infiltrating breast carcinomas, which have been histologically identified as being exclusively TNBC (24 tu-mors analyzed; Figure 1e; Table S1, Supporting Information).
2.2. The MMTV-R26MetTumor Model Recapitulates
Heterogeneity and Primary Drug Resistance of TNBC Human Patients
To further characterize the MMTV-R26Met mammary tumors,
we applied a semiquantitative proteomic profiling through
re-verse phase protein array (RPPA), a high-throughput antibody-based technique to analyze protein activities in signaling net-works. Analysis of expression and/or phosphorylation levels (247 signals, Table S2, Supporting Information) displayed that the
MMTV-R26Met tumors (n = 24) clearly segregate from control
mammary glands (n = 3; Figure 2a). Interestingly, the
MMTV-R26Mettumors form four distinct clusters, highlighting
hetero-geneity in signaling levels, including the MET phosphorylation status (Figure 2a,b; Figure S1d, Table S3, Supporting Informa-tion). Heterogeneity was also observed at Met transcript lev-els, as revealed by RT-qPCR (Figure S1e, Supporting Informa-tion), reflecting the heterogeneity of MET levels among TNBC patients.[40–42]Thus, a slight increase in Met levels in the mouse
mammary glands is sufficient to trigger the tumorigenic pro-gram of TNBC.
Next, we explored the possibility to classify the MMTV-R26Met
tumors to TNBC subtypes by analyzing the RPPA data apply-ing the Random Forest machine learnapply-ing algorithm previously used with transcriptomic data.[43]As subtype classification is
usu-ally done on transcriptomic data, we first used the RPPA data of 152 TNBC patients from the TCGA dataset to build a model for subtyping prediction. We trained the model using tenfold cross validation to optimize the method parameters (Figure S1f, Sup-porting Information). The model was sensitive to the M class (balanced accuracy 0.89), and had lower sensitivity in distinguish-ing between BL1 and BL2 classes (balanced accuracy of 0.69 and 0.55, respectively). This was done to take into account that most of the patients are BL1, with a consequent 30% correct BL1 pre-diction called “no information rate.” Our Random Forest model had accuracy of 57% (or 71% without distinguishing BL1 and BL2), with a significance of p-value = 0.002 compared to the “no-information rate.” We then applied the model on the RPPA data of MMTV-R26Mettumors to predict their classification.
Remark-ably, we found that all TNBC subtypes are represented by the
MMTV-R26Mettumors with an enrichment of the mesenchymal
subtype (Figure 2c,d). Collectively, these results showed that a moderate increase of MET levels in the mammary gland is suffi-cient to perturb tissue homeostasis, is able to initiate the TNBC program including the formation of lung metastasis, and that the resulting tumors recapitulate the heterogeneity characteristic of TNBC patients.
To further exploit the MMTV-R26Metcancer model, we
estab-lished and molecularly/biologically characterized six mammary gland tumor (MGT) cell lines from individual MMTV-R26Met
tu-mors (Figure 3a). Four cell lines, MGT4, MGT9, MGT11, and MGT13 exhibited tumorigenic properties in vivo, illustrated by the formation of tumors when injected heterotopically into the flank of nude mice, whereas the two other lines, MGT2 and MGT7 did not (Figure 3b). The four tumorigenic cell lines exhib-ited oncogenic features, whereas the MGT2 and MGT7 cell lines did not. In particular, we observed increased MET mRNA and protein levels (Figure 3c; Figure S2a,b, Supporting Information), with a heterogeneity similar to that observed among
MMTV-R26Met tumors and reported in TNBC patients.[41,42] MGT4,
MGT11, and MGT13 (not MGT9) cell lines were capable of form-ing tumor spheroids when grown in self-renewal conditions (Fig-ure 3d,e). MGT9 cells did not form spheroids, rather adhered to the low-attachment culture dish, correlating with downreg-ulation of proteins involved in stemness such as Notch/Jagged
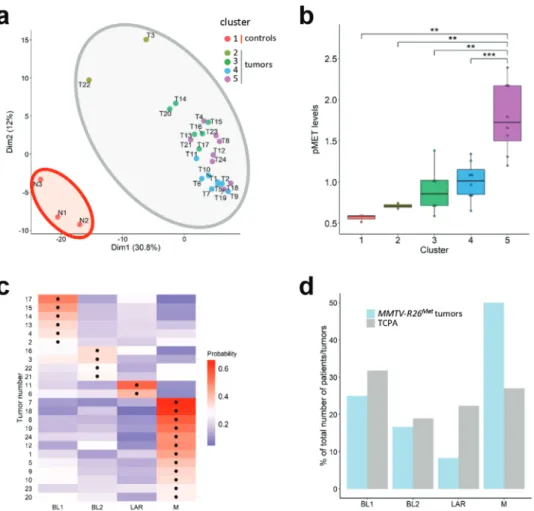
Figure 2. Machine learning processing of RPPA data from tumors (n = 24) and control (n = 3) illustrates that the MMTV-R26Metmodel faithfully
recapitulates intertumoral heterogeneity of human TNBC. a)K-means clustering (using k = 5 clusters) of the RPPA data for control mammary gland
(from eitherMMTV (N1 and N2) or MMTV-R26Met(N3) mice) and tumor samples is depicted in the PCA plot. The red area includes the normal
mammary tissue (cluster 1;n = 3), whereas the grey area includes the tumors separated into four clusters defined by the points color (cluster 2–5). b)
Clusters defined in (a) are characterized by different MET phosphorylation status. Colors of the clusters in panels (a) and (b) are the same. c) Heatmap depicting the probability that each tumor belongs to a specific subtype. The black dots indicate the type with the highest probability for each tumor. BL1: basal-like-1; BL2: basal-like-2; LAR: luminal androgen receptor; M: mesenchymal. d) Histogram reporting enrichment of the tumors compared to The Cancer Proteome Atlas (TCPA). Note that, even though all subtypes are represented,MMTV-R26Mettumors are more enriched for the mesenchymal
(M) subtype. Values are expressed as means ± s.e.m. **P< 0.01; *** P < 0.001.
and PI3K/AKT/mTOR pathways (Figure S2c, Table S4, Support-ing Information). Additionally, the tumorigenic cell lines were characterized by a high proliferation index, with a low propor-tion of cells in the G0 cell cycle phase (Figure S3a–d, Support-ing Information). Cells of the tumorigenic lines also exhibited increased motility, particularly for MGT13 cells that display a rather mesenchymal-like morphology compared with the other cell lines (Figure 3f; Figure S2a, Supporting Information). Fur-thermore, these cell lines also recapitulated the heterogeneity of p53 alterations observed in TNBC patients: p53 overexpression (likely oncogenic) in MGT4 and MGT9, decreased expression of p53 in MGT13, and comparable p53 levels in MGT11 (Figure S3e, Supporting Information).
Interestingly, the tumorigenic MGT cell lines (MGT4, MGT9, MGT11, and MGT13) were resistant to conventional chemother-apeutic agents, such as Docetaxel, Cisplatin, 5-Fluorouracil (5′FU), and only partially sensitive to Doxorubicin, although only at high doses (Figure 3g). Furthermore, all these MGT cell
lines were resistant to three drug combinations previously re-ported to be effective for TNBC treatment: combined inhibition of EGFR+MET, PI3K+MEK, and EGFR+PYK2[44–46](Figure 3h).
Together, these results show that the MMTV-R26Met-derived cell
lines are a relevant model to study as well drug resistance, an important feature of TNBC.
2.3. Signaling Network Analysis of MMTV-R26MetTumor Derived
Cells
To further characterize MMTV-R26MetMGT cells, we examined
their signaling status by RPPA and subsequent bioinformatics analysis (247 epitopes, listed in Table S2, Supporting Informa-tion). The signaling profiles highlighted two major features, as illustrated by principal component analysis (PCA). First, the tu-morigenic MGT4, MGT9, MGT11, and MGT13 cells clearly seg-regate from the two types of nontumorigenic cells: MGT7 and
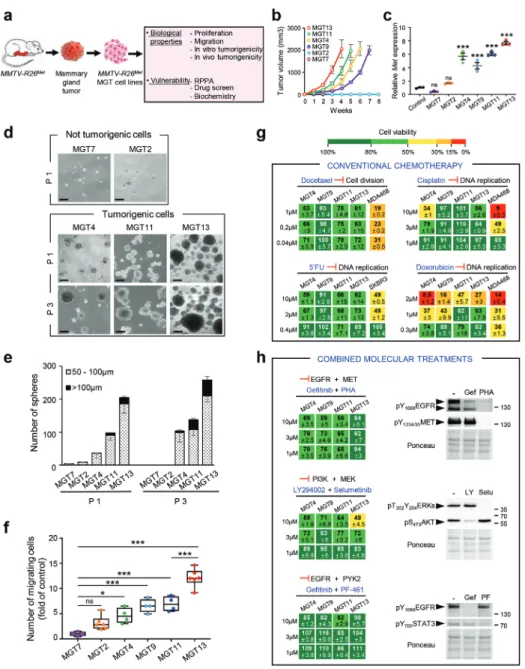
Figure 3. Cells derived fromMMTV-R26Metmammary gland tumors recapitulate primary resistance to drugs used in conventional chemotherapies and
to combined molecular treatments. a)MMTV-R26Metmammary gland tumors (MGT) were used to generateMMTV-R26MetMGT cell lines, which were
then utilized for assessing various biological properties and vulnerability to drugs. b) In vivo tumorigenic properties of theMMTV-R26Metcell lines.
Xenografts studies were performed by subcutaneous injection of cells in the flank of nude mice (n = 4–5, injected bilaterally). Evolution of the tumor
volume shows that MGT4, MGT9, MGT11, and MGT13 are highly tumorigenic cell lines, whereas the MGT2 and MGT7 cells do not form tumors. c) Graph reporting totalMet mRNA levels (endogenous plus exogenous) in the 6 MMTV-R26MetMGT cell lines compared to normal mammary epithelial
cells (control). Three independent biological samples were used per line. d,e) Tumor sphere formation assessing in vitro tumorigenicity of MMTV-R26Metcells. (d) Representative images of tumor spheres derived from MGT7, MGT2, MGT4, MGT11, and MGT13 cells, obtained after 1 (P1) or 3
(P3) passages. (e) Histogram reporting the number of spheres, classified in two groups according to their size (dotted bars: 50–100 µm; black bars
>100 µm), generated by the indicated MMTV-R26Metcell lines. Note that i) the very low capacity of MGT2 and MGT7 in forming spheres is totally
abolished after 3 passages, and ii) the number and size of spheres generated by MGT4, MGT11, and MGT13 increases from passage 1 to passage 3, reflecting their self-renewal capacity. Each experiment was done in triplicate. Three independent experiments were performed. f) Quantification of the migration capacity of eachMMTV-R26Metcell line determined by the number of migrating cells compared to MGT7 (fold of control). Three independent
experiments were performed. g) Cell viability ofMMTV-R26MetMGT cells exposed to drugs conventionally used in chemotherapy. Human TNBC cell
lines (MDA-MB-468 and SKBR3) were used as positive controls. Percentage of cell viability in presence of drugs compared to controls (untreated cells) is indicated. Percentages are reported using a color code (from green to red; the scale is shown on the top and is used as a reference in all studies). h) Dose–response effects of drug used in combined treatments on the viability ofMMTV-R26MetMGT cells. Western blots depict the effect of each
drug on its specific target. Note loss of EGFR phosphorylation in cells treated with PHA-665752, the MET inhibitor. 5′FU: 5-fluorouracil; Gef: gefitinib; LY: LY294002; PF: PF-461; PHA: PHA-665752; Selu: selumetinib. Values are expressed as means ± s.e.m. For multiple comparisons (for (c), (e), and (f)), statistical significance was assessed by one-way ANOVA followed by Tukey test. Not significant (ns)P> 0.05; * P < 0.05; *** P < 0.001. Statistical
MGT2 (Figure 4a; Figure S4a, Table S4, Supporting Information). MGT2 cells, which express very low level of MET, can be consid-ered as pretumorigenic. It is therefore tempting to speculate that critical levels of MET might establish a threshold for a tumori-genic switch, while higher MET levels are associated with aggres-siveness. Second, the four tumorigenic MMTV-R26MetMGT cell
lines fall into two distinct TNBC subtypes that we named “sub-type A” for MGT4, MGT9, MGT11, and “sub“sub-type B” for MGT13 (Figure 4a; Figure S3a, Table S4, Supporting Information). These two subtypes display distinct phenotypic features and MET levels (Figure S2a,b, Supporting Information). Strikingly, by PCA anal-ysis we could segregate into “subtype A” and “subtype B” both
MMTV-R26MetMGT cells and tumors (Figure 4b). Additionally,
we identified ARID1A, Claudin-7, and E-Cadherin as hallmark of the “subtype A” (Figure 4c; Table S5, Supporting Information).
To obtain insights on molecular and cellular functions char-acterizing “subtype A” from “subtype B,” we performed a series of enrichment analyses by applying Enrichr, a web-based tool to highlight enrichments based on gene sets. Both subtypes showed an enrichment in pathways related to DNA repair, cell cycle regu-lation, and metabolism (Figure 4d; Figure S4b, Supporting Infor-mation). These enrichments are consistent with enhanced prolif-eration capacity of MGT4, MGT9, MGT11, and MGT13 cells ver-sus nontumorigenic cells. Moreover, “subtype B” is enriched in pathways related to stemness properties (Figure 4d; Figure S4b, Supporting Information), consistent with the enhanced capabil-ity of MGT13 to form tumor spheroids in vitro (Figure 3d,e). Fur-ther analysis of RPPA data using the Limma package highlighted differences between the RPPA profiles of subtypes A and B ver-sus the nontumorigenic MGT cells. In particular, we detected upregulation of (a) Bim, which might sensitize the cells to an-tiapoptotic drugs, (b) CDK1 and RAD50, which are implicated in cell cycle regulation and DNA damage response (Figure 4e; Table S6, Supporting Information). Biochemical studies supported the RPPA results and revealed consistent upregulation of oncogenic signals in MGT4, MGT9, MGT11, and MGT13 compared with control cells. This included phosphorylation of MET, EGFR, of their downstream adaptor GAB1, of MEK/ERKs, AKT, RB, and elevated antiapoptotic signals such as MCL1, BCL-XL, and XIAP (Figure 4f).
2.4. Combined Targeting of WEE1 and BCL-XL Is Deleterious for TNBC Cells
Inspired by the signaling profiles of MGT cells and tumors, we designed a drug screen aiming at identifying combinatorial treat-ments effective for the two subtypes of TNBC cells modeled by the MMTV-R26Metmice. Among all treatments tested in the
MGT4 cell line (single or combined drugs), we uncovered that the simultaneous inhibition of BCL-XL and WEE1 drastically re-duced tumor cell viability (Figure S5a,b, Supporting Informa-tion). By further assessing the effects of this combined treatment on the six MMTV-R26Met MGT cell lines, we found that
BCL-XL+WEE1 inhibition was deleterious for all four tumorigenic
MMTV-R26MetMGT cells (MGT4, MGT9, MGT11, MGT13), but
not for the nontumorigenic cells (MGT2 and MGT7; Figure 5a,b). Importantly, this highlights lack of toxic effect of the newly iden-tified drug combination. Combined inhibition of BCL-XL and
WEE1 was synergistic (for 3 out of 4 MMTV-R26Met MGT cell
lines), as shown by the Bliss score and by the Chou–Talalay com-bination index score calculation (Figure 5a; Figure S5c, Support-ing Information). Furthermore, BCL-XL+WEE1 targetSupport-ing was detrimental for all six human TNBC cells tested (Figure 5c). In-triguingly, when this drug combination was tested on human non-TNBC cells, we found that inhibition of BCL-XL did not ex-acerbate the effects elicited by WEE1 targeting (Figure 5d), indi-cating that WEE1 inhibition is particularly detrimental in TNBC cells.
Recent studies have reported the sensitivity of TNBC to WEE1 targeting in the presence of either PARP or ATR inhibitors, or Cisplatin.[17,19,20,22,47]However, we found that MMTV-R26Met
MGT cells were either resistant or only partially sensitive to these drug combinations (Figure 5e), recapitulating other mechanisms of primary resistance beside those reported in Figure 3g,h. Thus, BCL-XL targeting is a preferable strategy to exacerbate WEE1 es-sentiality in TNBC.
Finally, we assessed in vivo the potency of BCL-XL+WEE1 co-targeting on tumor growth. We engineered a cell line for in vivo imaging by stably transfecting the MGT11 cells, characterized by strong tumorigenic properties, with a Luciferase reporter vector (defined as MGT11Luc). We confirmed that the MGT11Luccells
have comparable biological properties as the parental cells, and maintain sensitivity to combined BCL-XL+WEE1 targeting (Fig-ure S5d,f, Supporting Information). Orthotopic studies showed that combinatorial BCL-XL+WEE1 inhibition reduced in vivo tu-mor growth of MGT11Luccells injected into the mammary fat pad
of mice (Figure 5f–i; Figure S5g, Supporting Information). No ob-vious effects on mouse viability or murine weight indicated the lack of toxicity. Thus, the MMTV-R26Metmodel recapitulating
het-erogeneity and resistance of TNBC led us to uncover a new potent drug combination based on BCL-XL and WEE1 inhibition, effec-tive on human TNBC cell lines characterized by distinct features.
2.5. BCL-XL Inhibition Exacerbates WEE1 Requirement in TNBC Cells
While BCL-XL primarily has an anti-apoptotic function by in-hibiting cytochrome C release, WEE1 acts on multiple regulatory circuits. Besides its well-established involvement in regulating the G2/M transition through phosphorylation of CDK1, recent studies have highlighted additional mechanistic roles of WEE1 in DNA replication stress and regulation of histone synthesis and levels. Therefore, we thoroughly examined the signaling changes occurring following BCL-XL and WEE1 inhibition in MGT cell lines by RPPA analysis (426 epitopes were analyzed, Table S2, Supporting Information); some changes were validated by West-ern blot studies. As examples, the profile of proteins differentially expressed and/or phosphorylated in MGT4 is displayed in
Fig-ure 6a (Table S7, Supporting Information). Interestingly, while
BCL-XL inhibition alone had modest effects, WEE1 inhibition had marked effects on the cells, many of which were accentu-ated by treatment with the BCL-XL inhibitor. Among identified changes, some were consistently observed in all MGT cell lines, whereas others were specific to individual MGT lines. These changes covered a broad range of signaling/cellular functions, such as those associated with cell survival/death, cell cycle
Figure 4. Proteomic analysis highlighted signaling changes inMMTV-R26Mettumors, leading to the identification of a new potent drug combination
for TNBC cells. a) Principal component analysis (PCA) of theMMTV-R26MetMGT cell lines, using reverse phase protein array (RPPA) data. The 2
nontumorigenic cell lines are well separated from each other, with MGT2 that we named “pretumorigenic” cells. Both nontumorigenic cells are distinct from the two tumorigenic cell clusters, designated as “subtype A” (MGT4, MGT9, MGT11) and “subtype B” (MGT13). b) Graph showing the combined PCA ofMMTV-R26MetMGT cell lines and tumors, according tok-mean clustering (using k = 4 clusters). Cluster 1: normal tissues; cluster 2: low
phospho-MET tumors; cluster 3: “subtype B” cell line (MGT13) and tumors; cluster 4: “subtype A” cell lines (MGT4, MGT9, MGT11) and tumors. Cell lines are indicated by a black dot. c) Graphs reporting the expression levels in “subtype A” (A) and “subtype B” (B)MMTV-R26Mettumors of the indicated proteins,
considered as the hallmark of the “subtype A” cell lines (Table S5, Supporting Information). Unpaired Student’st-test was used. * P< 0.05; *** P <
0.001. d) Proteomic profiles of cells belonging to the different clusters (shown in (a)) were compared to identify enrichments by applying the Enrichr software. Histograms report the enriched cell signaling pathways, using the Reactome database, ordered according to the combined score. The 20 top ranked enrichments are highlighted. Note that the majority of the changes are related to signals (indicated by arrowheads) involved in DNA repair (red), metabolism (blue), cell cycle regulation (yellow), and stemness (green) (indicated by colored arrowheads). e) Graph showing the fold change (Log2) of
protein phosphorylation or expression between “subtype A” (x-axis) or “subtype B” (y-axis) cell lines versus the nontumorigenic cells (MGT2, MGT7).
Proteins among the highest significant differentially expressed in “subtype A” (in blue), “subtype B” (in red), or both (in purple) are indicated (Table S6, Supporting Information).p-values were determined by the Limma package in R. f) Western blot analysis of total protein extracts from MMTV-R26Met
regulation, DNA damage/repair, histone levels, and oncogenic properties (Figure 6b; Table S7, Supporting Information).
Consistent with the well-known regulatory activity of WEE1 in cell cycle progression, we observed decreased levels of phosphoY15CDK1 (the direct target of WEE1), phosphoS795RB,
and CHK1 expression upon WEE1 inhibition (Figures 6b and 7a; Table S7, Supporting Information). This was accompanied by an alteration in the distribution of cells in cycle phases as shown by FACS profiles (Figure 7b). Concerning cell survival signals, combined BCL-XL+WEE1 targeting in MGT cells led to a drastic downregulation of MCL1 and XIAP antiapoptotic signals associ-ated with intense cleavage of Caspase3 and PARP (Figures 6a,b and 7a). Regarding DNA damage and repair, we observed an up-regulation of phosphoS1987ATM and phosphoS139H2AX (histone
variant,𝛾H2AX), reflecting increased levels of DNA damage in the MGT cells upon treatment (Figures 6a,b and 7a; Figure S6a, Supporting Information). This high proportion of DNA damage is associated to the downregulation of Rad51 (Figure 6a,b), which plays a major role in double-strand break (DSB) repair by ho-mologous recombination and in fork protection, and restart dur-ing replication stress,[48] raising the possibility that this
down-regulation is related to the increase of phosphoS139H2AX.
More-over, we observed a drastic downregulation of RRM2, a subunit of the ribonucleotide reductase required to maintain high levels of dNTPs,[23]with an upregulation of Histone-H3 and H3K9me2
levels (Figure 6a–d; Figure S6b, Table S7, Supporting Informa-tion). This was further confirmed by cell fractionation studies, showing downregulation of RRM2, and increased pS33RPA32 in
the chromatin fraction of cells co-treated with WEE1 and BCL-XL inhibitors (Figure 7e). Finally, concerning oncogenic signals, we found a significant downregulation of phosphorylation lev-els of MET and GAB1 (Figure 7a). Collectively, these results in-dicated that BCL-XL inhibition exacerbates the dependence of TNBC cells on the overall functions exerted by WEE1: an intact dNTP pool (by stabilizing RRM2 protein levels), appropriate his-tone levels, and proper cell cycle progression through G2/M.
2.6. Combined BCL-XL and WEE1 Inhibition Leads to Mitotic Catastrophe and Apoptosis of MMTV-R26MetTNBC Cells
We explored at cellular levels the biological events associated with BCL-XL and WEE1 inhibition by immunocytochemistry. In cells experiencing the combined treatment, we found a significant in-crease in the number of𝛾H2AX-positive cells as well as a raise
in intensity of𝛾H2AX staining per cell, reflecting an accumu-lation of DNA DSBs (Figure 8a). These findings are in agree-ment with the above results (Figure 7a; Figure S6a, Supporting Information) and reflect increased DNA damage in a high pro-portion of cells following BCL-XL+WEE1 targeting. In addition, we found a striking increase in phosphoS10Histone H3
(pH3)-positive cells when subjected to the combined treatment (Fig-ure 8b), suggesting that a high proportion of cells are in G2/M.[49]
This could reflect a premature entry in mitosis due to WEE1 in-hibition, but also an accumulation of unrepaired DNA damage in mitosis.[13,50]We investigated the consequences of this
prema-ture mitotic entry by performing a double immunostaining with anti-𝛼-Tubulin and anti-pH3 antibodies in cells treated (or not)
with BCL-XL+WEE1 inhibitors. Interestingly, the staining high-lighted a marked increase of cells harboring mitotic catastrophe revealed by monopolar, multipolar, or disorganized spindles, and even cytokinesis failure (Figure 8c). The results further showed that BCL-XL inhibition exacerbated the effects of WEE1 targeting by forcing cells to exit mitosis without undergoing complete chro-mosome segregation, a phenomenon called mitotic slippage. As a consequence, these excessive unscheduled and abnormal mito-sis events led to an increased formation of micronuclei in treated cells (Figure 8d).
Finally, we assessed the terminal event associated with com-bined BCL-XL and WEE1 targeting on TNBC cells. We found that a pan-Caspase inhibitor (Z-VAD-FMK) significantly rescued cell death caused by the combined treatment of TNBC cells (Fig-ure 8e,f). This result was consistent with Western blots analysis showing a strong increase in Caspase3 and PARP cleavage upon combined BCL-XL+WEE1 inhibition (Figure 7a). By contrast, in-hibition of ferroptosis, another cell death mechanism to which TNBC cells are highly sensitive,[51] did not prevent cell death
(Figure 8e,f). Together, these findings indicate that the combined targeting of BCL-XL and WEE1 exacerbates the dependency of TNBC cells on WEE1 function in a context of low antiapoptotic inputs, leading to mitotic catastrophe and apoptosis.
3. Discussion
In this study, we have developed a new TNBC mouse model that recapitulates primary drug resistance, we uncovered that the combined inhibition of WEE1 and BCL-XL selectively kills mouse and human TNBC cell lines, and provided mechanistic insights into inhibition of WEE1 and BCL-XL in TNBC cells.
Figure 5. Combined inhibition of BCL-XL and WEE1 is deleterious for allMMTV-R26MetMGT and human TNBC cell lines tested. a) Dose–response
effects of A1155463 (A11, targeting BCL-XL) alone or in combination with Adavosertib (Adav, targeting WEE1) on the viability of the four tumorigenic
MMTV-R26MetMGT cell lines. Combined drug effects are reported on the left of the top panel. Detailed matrix (middle panel) and Loewe plots (lower
panel) highlight the drug synergism. b) Cell viability assay performed on the nontumorigenic MGT2 and MGT7 cell lines highlights the lack of in vitro toxic effect of A1155463+Adavosertib drug combination. c,d) Cell viability in response of A1155463 (1 × 10⁻⁶m) and Adavosertib (3 × 10⁻⁶m) in a panel
of c) human TNBC and d) human non-TNBC breast cancer cell lines. In all figures, cell viability is presented as percentage of control (untreated cells) and labeled by the green (high)-to-red (low) color code. e) Dose–response effects on the viability ofMMTV-R26MetMGT cells treated with single or
combined drugs as indicated. In (a–e), at least three independent experiments were performed. Values are expressed as the mean ± s.e.m. f–i) In vivo effects of A1155463+Adavosertib treatment in orthotopic tumors. (f) Orthotopic injection of MGT11Luccells in the mammary fat pad of NSG mice, drug
administration, and tumor volume measurement were performed as illustrated. Tumor volume (g) and tumor weight (h) measured at the end point of the experiment (day 37;n = 8 mice per group). (i) Graph reporting the evolution of the body weight of mice during the whole procedure. Body weight
was measured every day, before drug administration. No significant changes were observed, indicating that the dose of drugs used in vivo were not toxic. A11: A1155463 (BCL-XL inhibitor); Adav: Adavosertib (WEE1 inhibitor); AZD: AZD6738 (ATR inhibitor); Cisp: cisplatin; Olap: Olaparib (PARP inhibitor). Values are expressed as the mean ± s.e.m. Unpaired Student’st-test was used. ** P< 0.01.
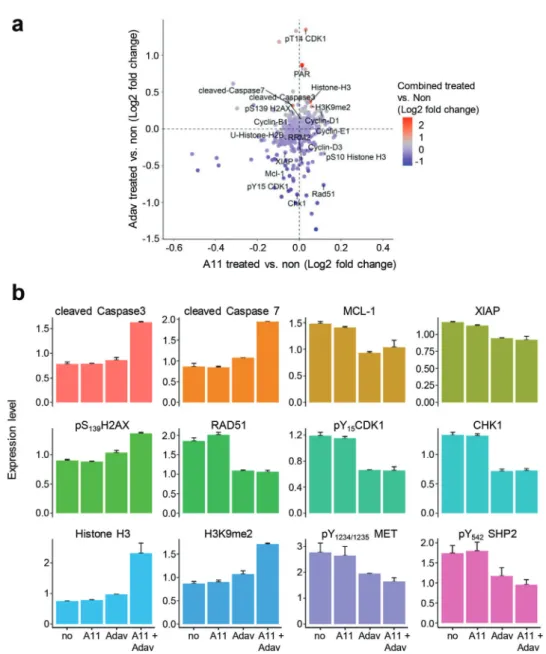
Figure 6. BCL-XL and WEE1 targeting leads to perturbation of several signals, including epigenetic, DNA damage/repair, apoptosis, and cell cycle
regulators. a) Graph showing the fold change (Log2) of protein phosphorylation or expression in MGT4 cells between: A1155463 (A11) versus untreated (on thex-axis), Adavosertib (Adav) versus untreated (on the y-axis), and the combination versus untreated (colors of the dots). Changes related to
epigenetics (HistoneH3, H3K9me2, phosphoS10HistoneH3, U-HistoneH2B, RRM2) DNA damage and repair (𝛾H2AX, Rad51, PAR), apoptosis (cleaved
Caspase7, cleaved Caspase3), and cell cycle (CHK1, CDK1, cyclins) are indicated. b) Changes in the expression/phosphorylation levels of the reported proteins in MGT4 cells untreated and treated with the indicated drugs, based on RPPA analysis (Table S7, Supporting Information).P-values were
determined by the Limma package in R.
A number of transgenic mice have been engineered to model TNBC, predominantly through drastic genetic manipulations (of-ten combined), such as loss-of-tumor suppressors and overex-pression of activated oncogenes.[52] Although they have been
instrumental to implicate candidate genes as oncogenes, each model generally recapitulates a fraction of disease features pre-dominantly associated with the genetic manipulation employed. Patient-derived xenografts capture the heterogeneity that charac-terizes cancers like TNBC. However, transplantation-based mod-els in immunocompromised mice do not report on the recipro-cal crosstalk between cancer and immune cells, a limitation that can be overcome, in part, by laborious and expensive
“human-ized models.” However, most murine TNBC models do not reca-pitulate the formation of spontaneous cancers occurring in hu-man patients. In this respect, the MMTV-R26Metmodel is rather
unique for a series of features.
i) Tumors developed by MMTV-R26Met mice are exclusively
TNBC rather than covering a range of breast cancer types. This is not the case for other transgenic mice overexpressing MET oncogenic forms in the mammary gland,[33,53–55]
gener-ated in the past because of the implication of MET in breast cancer pathophysiology. Indeed, MET is overexpressed in about 40% of breast cancer patients (in luminal A: 36%; in
Luminal B: 39%; in HER2+: 48%; in TNBC: 53%[56]), and
its overexpression often correlates with poorly differentiated and aggressive forms of the disease.[41]In TNBC, MET is
par-ticularly highly expressed, and implicated in malignancy pro-gression (Figure S7, Supporting Information), metastasis, and resistance to anticancer therapies.[40,41] Consequently,
agents targeting MET are actively being explored for clinical purposes,[57,58]including in TNBC.[59–61]
ii) In MMTV-R26Metmice, the TNBC program is driven by a
subtle increase of MET levels in the mammary gland, and by the wild-type form of MET rather than oncogenic versions of MET (mutated MET or TPR-MET).[33,53,54]Consequently,
MMTV-R26Met TNBC cells are not addicted to MET, a
fea-ture predominantly characterizing cancers induced by driver oncogenes. This might explain why the MMTV-R26Metmodel
reported here recapitulates the tumor heterogeneity typical of TNBC patients.
iii) TNBC heterogeneity is recapitulated by MMTV-R26Metmice
at different levels, and heterogeneity is maintained in
MMTV-R26Met cell lines established from independent
tu-mors.
iv) MMTV-R26Met TNBC recapitulates primary resistance to
conventional chemotherapy and to a set of targeted molec-ular treatments reported in previous studies.[45]
Histologically, the 28 MMTV-R26Mettumors analyzed revealed
differences in their grade (although the majority were high-grade), with a range of low to high mitotic index, and the ab-sence or preab-sence of necrotic areas. Heterogeneity is also evi-denced by processing our RPPA analysis of 24 MMTV-R26Met
tumors through machine learning, indicating that the 4 TNBC subtypes (BL1, BL2, LAR, and mesenchymal) are indeed rep-resented, with the most aggressive mesenchymal subclass en-riched. Diversity was preserved in vitro by the four MMTV-R26Met
MGT cells we established from distinct tumors. Heterogeneity was maintained even concerning MET levels in TNBC, as shown for example by the different levels of MET expression and ac-tivation in MMTV-R26Mettumors and cells (for example,
phos-phorylation levels of MET and of GAB-1, a MET downstream effector). It is tempting to speculate that although all tumors in MMTV-R26Met mice originate from a common genetic
set-ting characterized by a slight increase of MET levels, this con-text does not impose an oncogenic path in which MET would be systematically altered in all tumors to the same extent. Fi-nally, MMTV-R26MetMGT cells are also heterogeneous in terms
of drug sensitivity: for example, while MGT9 and MGT11 are re-sistant to single WEE1 targeting, MGT4 and MGT13 are partially sensitive.
It is rather surprising that a subtle increase of MET levels, in its wild-type form, spontaneously initiates a destabilization pro-cess that fully recapitulates the whole TNBC program. Neverthe-less, this sensitivity to MET levels is conditioned by a multiparous context, as females without multiple pregnancies did not develop tumors. Both MET and HGF are dynamically expressed during pregnancy/lactation, as we showed here consistent with previous reports.[37,38] Moreover, the HGF/MET system regulates
mam-mary gland morphogenesis, especially ductal branching and pro-liferation of ductal end buds.[62]These data illustrate how a tight
regulation of the time and signal input levels required for the mammary gland remodeling is critical to prevent transformation. The vulnerability of the mammary gland to a slight increase in MET levels resembles the susceptibility of the liver we reported in previous studies.[29–32]The vulnerability of the mammary gland
and the liver is contrasted by a remarkable resilience of other tis-sues, in which a tumorigenic event requires additional genetic alterations, as reported for malignant peripheral nerve sheath tumors.[63]Whether such a mild MET perturbation in the
mam-mary gland occurs in specific subgroups of women and/or phys-iological contexts and can increase susceptibility to tumor devel-opment remains an open issue. If this is not the case, such ge-netic manipulation nevertheless makes it possible to initiate a cascade of molecular events leading to a clinically relevant TNBC context.
The second major finding of this work is that combinato-rial inhibition of WEE1 and BCL-XL kills a panel of heteroge-neous MMTV-R26Metand human TNBC cell lines. For decades,
WEE1 has been considered primarily as a key regulator in cell cycle progression.[13,14]In particular, WEE1 regulates the G2/M
checkpoint through phosphorylation and inactivation of CDK1, thus preventing entry of cells with unrepaired DNA damage into mitosis.[13] Nevertheless, additional mechanistic functions
of WEE1 have recently emerged. Indeed, WEE1 stabilizes RRM2 protein, a regulatory subunit of the ribonucleotide reductase re-quired to maintain high dNTPs levels.[23]In addition, WEE1 was
reported in yeast and human to inhibit transcription of several histone genes by phosphorylating Histone H2B at Tyr37.[25]In
ad-dition, the WEE1 yeast homolog Swe1WEE1was recently reported
to act as a histone-sensing checkpoint by sensing excess histone levels before cells enter mitosis, thus preventing aberrant chro-mosomal segregation and polyploidy.[26] Thus, WEE1 targeting
Figure 7. BCL-XL targeting exacerbates WEE1 requirement in TNBC cells. a) Western blots showing the effects of A1155463 (1 × 10⁻⁶m), Adavosertib
(3 × 10⁻⁶m), and combined treatment on the indicated signals in the MGT4 and MGT11 cells, 12 h after treatment. For MGT4, p53 panel corresponds
to a short exposure time in which basal levels are barely visible (compared to those reported in Figure S3e, Supporting Information), to document its upregulation upon drug treatment. At least two independent experiments were performed. b) Graph reporting the distribution of cells treated with the indicated drugs (for 12 h), compared to untreated cells (no), in each phase of the cell cycle as determined by flow cytometry using PI and Ki67 staining. Three independent experiments were performed. Statistical analyses were performed by two-way ANOVA followed by Tukey test, and are reported in Table S11 of the Supporting Information. c) Graphs reporting changes by RPPA in levels of Histone H3, H3K9me2, RRM1, and RRM2 in MGT cells exposed to A1155463, Adavosertib, or in combination. Distinct MGT cell lines are indicated in colors. For multiple comparisons, statistical significance was assessed by one-way ANOVA followed by Tukey test. d) Western blot showing RRM2 downregulation in MGT11 cells treated with Adavosertib alone or in combination with A1155463. Representative results of two independent experiments. e) Western blot showing downregulation of RRM2 and increase of pS33RPA32 levels in the chromatin fraction (corresponding to the 600 × 10−3m KCl) of cells cotreated with WEE1+BCL-XL (A11+Adav). Cells
were treated with A1155463 (0.3 × 10⁻⁶m) plus Adavosertib (1 or 3 × 10⁻⁶m). Two independent experiments were performed. A11: A1155463; Adav:
Figure 8. Combined BCL-XL and WEE1 inhibition leads to mitotic catastrophe and apoptosis. Cells untreated or treated for the indicated times with
A1155463 (0.3 × 10⁻⁶m), Adavosertib (3 × 10⁻⁶m), or in combination, were immunostained with the indicated antibodies. DAPI was used to counterstain
the nuclear DNA. a) MGT11 cells treated for 12 h with the drugs were immunostained with anti-𝛾H2AX antibodies. Left: the number of 𝛾H2AX-positive cells according to the intensity of staining is represented in the violin plot (Log2). Right: representative images of𝛾H2AX immunostaining. Scale bar:
50 µm. Four independent experiments were performed. b,c) MGT11 cells treated for 16 h with the drugs were stained with anti-pH3 (red) and𝛼-Tubulin (microtubules, green) antibodies. b) Left: percentage of cells in mitosis (pH3-positive cells) versus total number of cells. Right: representative images of pH3 immunostaining. Scale bar: 50 µm. c) Quantifications (top) and examples (bottom) of cells harboring either typical mitotic phenotypes (normal) or mitotic catastrophe (monopolar, multipolar, or disorganized spindle) revealed by anti-pH3/𝛼-Tubulin immunostaining. To calculate the percentage of cells harboring mitotic catastrophe, we considered cells in metaphase and anaphase among the pH3-positive cells. Scale bar: 5 µm for multipolar spindle,
might affect several key cellular processes that are particularly relevant in cancer cells as they proliferate at high rates and are more prone to replication stress with higher demands in dNTP and histones. WEE1 inhibition may therefore particularly expose cancer cells to DNA damage. This is reflected by the marked in-crease of cells harboring mitotic catastrophe upon the combined inhibition of WEE1 and BCL-XL in TNBC cells.
WEE1 is an attractive target for cancer therapies including for TNBC, and strategies are being intensively explored in preclinical studies and clinical trials. It has been recently reported that WEE1 targeting, in combination with either cisplatin or inhibitors of ATR or PARP is effective in human TNBC cells lines.[17,19,20,22,47]
By testing them in MMTV-R26MetMGT cells, mimicking primary
resistant treatment contexts, we have shown that these three com-binations are indeed effective, albeit to a varying degree and de-pending on the cell line. Nevertheless, the combinatorial target-ing of WEE1 together with BCL-XL elicits superior effects, as shown by the loss of viability of all four very aggressive/highly tumorigenic MMTV-R26MetMGT cell lines and of the six human
TNBC cell lines tested. Interestingly, such vulnerability is specific to TNBC cells as three out of four non-TNBC cell lines were re-silient to WEE1 plus BCL-XL inhibition. This resilience, as well as the absence of effects on two nontumorigenic MMTV-R26Met
MGT cell lines (MGT2, MGT7) highlights two relevant points. First, the reduction of the stress support pathway by targeting BCL-XL exacerbates a specific requirement of WEE1 in TNBC. This effect resembles an “essentiality-induced” synthetic lethal-ity, characterized by the essentiality of one gene following the targeting of a second gene.[64]Nevertheless, we cannot exclude
that BCL-XL targeting may also contribute to altered cell cycle progression.[65]Second, in addition to the absence of in vivo side
effects, BCL-XL plus WEE1 targeting appears to be a rather safe treatment for healthy cells.
4. Conclusion
We propose that the MMTV-R26Metgenetic setting we have
gen-erated is a relevant model for molecular and preclinical studies on TNBC in an immunocompetent context. The usefulness of the MMTV-R26Metmodel is further strengthened by its
capabil-ity to recapitulate TNBC heterogenecapabil-ity and primary resistance to treatments. As cells derived from MMTV-R26Mettumors
main-tain these features, they constitute a valuable cellular model to explore TNBC molecular/biological properties, to screen TNBC therapeutic options, and to investigate the immune-cancer cell crosstalk through syngeneic orthotopic studies. We illustrated how the combination of this unique model with proteomic pro-filing, signaling network analysis, and machine learning can lead
to the identification of a new, potent drug combination for TNBC treatment, based on WEE1 and BCL-XL targeting. Our findings may be particularly relevant from a translational perspective, con-sidering that agents targeting WEE1 or BCL-XL are already in phase I/II clinical trials.
5. Experimental Section
Mice: R26stopMet mice (international nomenclature
Gt(ROSA)26Sortm1(Actb-Met)Fmai), and R26stopMet-Luc mice
(interna-tional nomenclature Gt(ROSA)26Sortm1(Actb-Met-IRES-Luc)Fmai) carrying
a conditional mouse–human chimeric Met transgene in the Rosa26
locus was previously reported.[27,28,66] In both lines, expression of
the METtg (with or without Luciferase) was conditioned by the
Cre-mediated removal of a LoxP-stop-LoxP cassette. MMTV-R26Met and
MMTV-R26Met-Luctransgenic mouse lines were generated by crossing the
R26stopMet or R26stopMet-Luc mice, respectively, with the MMTV-Cre line
(B6129-Tgn(MMTV-Cre)4Mam) obtained from the Jackson Laboratory. All animals were maintained in a mixed genetic background (50% 129/Sv, 50% C57/Bl6). Mice were genotyped by PCR analysis of genomic DNA as described elsewhere.[27,28]Since it has been well established that
mam-mary gland tumor formation is accelerated in multiparous females,[39]
MMTV-R26Metmice were maintained in constant breeding. After 5–12
cycles of pregnancy, tumors were found in not pregnantMMTV-R26Met
mice.
Cell Lines: MMTV-R26MetMGT cell lines were derived from
indepen-dentMMTV-R26Mettumors. To establishMMTV-R26MetMGT cell lines,
MMTV-R26Mettumors were dissected, and chopped into 1 mm3pieces.
Cells were dissociated for 30–40 min at 37 °C with type II collagenase (1 mg mL−1, ThermoFisher Scientific) and DNase I (20 µg mL−1, Roche) in
DMEM/F12 (Dulbecco’s modified Eagle’s media/F12, 1/1, ThermoFisher Scientific) complemented with 10% fetal bovine serum (FBS, Ther-moFisher Scientific), penicillin–streptomycin (P/S, 100 U mL−1/0.1 mg
mL−1, ThermoFisher Scientific), and fungizone (25µg mL−1, Sigma). The
cell suspension was then passed through a 40 µm nylon cell strainer to re-move aggregates, and cells were seeded in complete DMEM/F12 medium (DMEM/F12, supplemented with 10% FBS, P/S, glutamine (2 × 10⁻³
m, ThermoFisher Scientific), glucose (0.25%, Sigma), insulin (10 µg mL−1,
Sigma), transferrin (10 µg mL−1, Sigma), sodium selenite (5 ng mL−1,
Sigma), hydrocortisone (0.5 µg mL−1, Sigma), EGF (20 ng mL−1, Roche),
and HGF (10 ng mL−1, Peprotech), and cultured in this complete medium
in a humidified incubator at 37 °C in a 5% CO2atmosphere. All cells were
tested by PCR-based assay to verify that they were free of Mycoplasma con-tamination. The establishment of normal mammary epithelial cell culture was performed as described above. Mammary glands were dissected from
MMTV-R26Metmice not carrying tumor.
RPPA: Protein lysates of dissected mammary gland tumors (n = 24), control mammary glands (MMTV andMMTV-R26Met), andMMTV-R26Met
MGT cells either not treated or treated for 12 h with A1155463 (1 × 10⁻⁶
m), Adavosertib (3 × 10⁻⁶m), or A1155463 + Adavosertib (1 × 10⁻⁶m, 3 ×
10−6m) were prepared according to the MD Anderson Cancer Center
plat-form instructions. Samples were screened with 426 antibodies to identify signaling changes in protein expression and phosphorylation levels.
10 µm for normal monopolar and disorganized spindle images. Three independent experiments were performed. d) MGT11 cells were treated for 24 h with the indicated drugs. Nuclear DNA was counterstained with DAPI. Percentage of cells with micronuclei versus the total number of cells (left) and representative images (right) are shown. Scale bar: 10 µm. Three independent experiments were performed. e,f) The pancaspase inhibitor z-VAD-FMK rescues from cell death induced by the combination of A1155463 and Adavosertib. (e)MMTV-R26MetMGT11 and (f) MDA-MB-231 cells were
pretreated with either the apoptosis (z-VAD: z-VAD-FMK) or the ferroptosis (Ferr-1: Ferrostatin-1) inhibitor at the indicated doses, for 1 h and then for additional 24 h in the absence or presence of A1155463 (A11, 0.3 × 10⁻⁶m) + Adavosertib (Adav, 3 × 10⁻⁶m). Histograms represent the percentage of cell
viability in presence of drugs compared to controls (untreated cells). Statistics refer to cell viability obtained in presence of the apoptosis or ferroptosis inhibitors compared to A1155463+Adavosertib alone. The efficiency of Ferrostatin-1 was assessed in presence of Erastin, a ferroptosis inducer. Three independent experiments were performed. Data are expressed as means ± s.e.m. For multiple comparisons, statistical significance was assessed by one-way ANOVA followed by Tukey test. not significant (ns)P> 0.05; ** P < 0.01; *** P < 0.001.
Bioinformatic Analysis: Random Forest was performed using the ran-domForest package in R. RPPA data for 152 TNBC patients in the TCGA dataset (TCPA: The Cancer Proteome Atlas) was split into training (80%) and test (20%) sets. The expression levels of 105 proteins (protein with-out missing data in the TCGA and whose expression was also evaluated in RPPA) were scaled to have an average of 0 and standard deviation of 1, and were used to train a random forest model for TNBCtype-4 classi-fication by optimizing the number of proteins randomly selected at each split, using tenfold cross validation. The model with the highest accuracy was validated on the test set, and used to predict the classification of the mice tumors to the four TNBC subtypes. Hierarchical clustering of the RPPA data and partition clustering were performed and visualized using the gplots and Factoextra packages in R.
Statistical Analysis: Data are presented as the median or as the mean ± standard error of the mean (s.e.m.), according to sample distributions. For two sided comparisons, unpaired Student’st-test was used for data
show-ing normal distributions and Wilcoxon test in other situations. For multi-ple comparisons, ANOVA test followed by Tukey test was used. All statisti-cal analyses were performed using the GraphPad Prism and software. For the RPPA analysis of untreatedMMTV-R26Metcell lines (Figure 4a), cells
were analyzed in triplicates. RPPA analyses of drug perturbation effects were done in duplicates (Figure 6). Expression levels of proteins were Log2 transformed before analysis. Analysis of fold-change proteins andp-values
to determine significantly differentially expressed proteins were done by the Limma package in R. The cumulative overall disease-free survival rates were calculated using the Kaplan–Meier method.P values are indicated
in figures.P< 0.05 was considered significant. * P < 0.05; ** P < 0.01;
***P< 0.001.
Ethics statement: All procedures involving the use of animals were carried out in accordance with the European Community Council Di-rective of 22 September 2010 on the protection of animals used for experimental purposes (2010/63/EU). The experimental protocols were performed according to the institutional Ethical Committee guidelines for animal research (Comité d’éthique pour l’expérimentation animale – Comité d’éthique de Marseille) and in compliance with the French law un-der the agreement number D13-055-21, delivered by the “Préfecture de la Région Provence-Alpes-Côte-d’Azur et des Bouches-du-Rhône”. Mice were housed under pathogen-free conditions in enriched cages, with a light/dark cycle, and fed ad libitum according to Safe Complete Care Com-petence (SAFE A04). The mouse project authorization of the Maina lab-oratory is: APAFIS #8214-2016121417291352.v5, delivered by the “Min-istère de l’Enseignement Supérieur, de la Recherche et de l’Innovation”. Orthotopic experiments were approved by animal ethics committees (APAFIS#13349-2018013116278149 v2).
Supporting Information
Supporting Information is available from the Wiley Online Library or from the author.
Acknowledgements
F.L. and F.A. contributed equally as joint first authors. S.L. and F.M. con-tributed equally as joint senior authors. The authors thank all members of labs for helpful discussions and comments, R. Dono and F. Helmbacher for extremely valuable feedback on the study, A. Furlan for initial work with
MMTV-R26Metmice, S. Richelme for in vivo bioluminescence imaging
re-ported in Figure 1B and for work on a first cohort of mice, E. Marechal for her contribution to theMMTV-R26Metcharacterization, C. Sequera for the
analysis of overall survival of TNBC patients according toMET expression
levels, M. Buferne for in vivo bioluminescence imaging, and the animal house platform for excellent help with mouse husbandry. This research was supported by a grant from the Ministry of Foreign Affairs and Inter-national Development (MAEDI) and the Ministry of National Education, Higher Education and Research (MENESR) of France and by the Ministry of Science and Technology of Israel (Grant #3-14002) to F.M. and S.L. This
study was supported in part by research funding from Institut National du Cancer, Région Alpes-Côte d’Azur, and Canceropôle Provence-Alpes-Côte d’Azur to F.M. F.A. was supported by the Higher Education Commission (HEC) of Pakistan. U.A.K. was supported by the Rising Tide Foundation Cancer Research Postdoctoral Fellowship, the Dean Fellow-ship of the Faculty of Biology of the Weizmann Institute of Science (WIS), and the Postdoctoral Fellowship of the Swiss Society of Friends of the WIS. J.-P.B. is a scholar of Institut Universitaire de France. V.G. was supported by the “Ligue Nationale Contre le Cancer” (Equipe Labellisée). The contri-bution of the Region Provence Alpes Côtes d’Azur and of the Aix-Marseille University to the IBDM animal facility and of the France-BioImaging/PICsL infrastructure (ANR-10-INBS-04-01) to the imaging facility is also acknowl-edged. The funders had no role in study design, data collection and anal-ysis, decision to publish or preparation of the manuscript.
Conflict of Interest
The authors declare no conflict of interest.
Keywords
BCL-XL, cancer mouse model, drug resistance, MET, signaling reprogram-ming, triple-negative breast cancer, WEE1
Received: August 10, 2020 Revised: October 12, 2020 Published online:
[1] A. Fantozzi, G. Christofori,Breast Cancer Res. 2006, 8, 212.
[2] M. K. Park, C. H. Lee, H. Lee,Lab. Anim. Res. 2018, 34, 160..
[3] J. L. Christenson, K. T. Butterfield, N. S. Spoelstra, J. D. Norris, J. S. Josan, J. A. Pollock, D. P. Mcdonnell, B. S. Katzenellenbogen, J. A. Katzenellenbogen, J. K. Richer,Horm. Cancer 2017, 8, 69.
[4] L. Gerratana, D. Basile, G. Buono, S. De Placido, M. Giuliano, S. Minichillo, A. Coinu, F. Martorana, I. De Santo, L. Del Mastro, M. De Laurentiis, F. Puglisi, G. Arpino,Cancer Treat. Rev. 2018, 68, 102.
[5] B. D. Lehmann, B. Jovanovi´c, X. Chen, M. V. Estrada, K. N. Johnson, Y. Shyr, H. L. Moses, M. E. Sanders, J. A. Pietenpol,PLoS One 2016, 11, 0157368.
[6] B. A. Kohler, R. L. Sherman, N. Howlader, A. Jemal, A. B. Ryerson, K. A. Henry, F. P. Boscoe, K. A. Cronin, A. Lake, A. M. Noone, S. J. Henley, C. R. Eheman, R. N. Anderson, L. Penberthy,J. Natl. Cancer Inst. 2015, 107, 048.
[7] A. C. Garrido-Castro, N. U. Lin, K. Polyak,Cancer Discovery 2019, 9,
176.
[8] S. Lev,Biochem. Soc. Trans. 2020, 48, 657.
[9] M. Kriegsmann, V. Endris, T. Wolf, N. Pfarr, A. Stenzinger, S. Loibl, C. Denkert, A. Schneeweiss, J. Budczies, P. Sinn, W. Weichert, Oncotar-get 2014, 5, 9952.
[10] N. L. Solimini, J. Luo, S. J. Elledge,Cell 2007, 130, 986.
[11] G. Bianchini, J. M. Balko, I. A. Mayer, M. E. Sanders, L. Gianni,Nat. Rev. Clin. Oncol. 2016, 13, 674.
[12] J. R. Jhan, E. R. Andrechek,Pharmacogenomics 2017, 18, 1595.
[13] C. J. Matheson, D. S. Backos, P. Reigan,Trends Pharmacol. Sci. 2016, 37, 872.
[14] J. J. J. Geenen, J. H. M. Schellens,Clin. Cancer Res. 2017, 23, 4540.
[15] K. A. Bridges, H. Hirai, C. A. Buser, C. Brooks, H. Liu, T. A. Buchholz, J. M. Molkentine, K. A. Mason, R. E. Meyn,Clin. Cancer Res. 2011, 17,
5638.
[16] M. Aarts, R. Sharpe, I. Garcia-Murillas, H. Gevensleben, M. S. Hurd, S. D. Shumway, C. Toniatti, A. Ashworth, N. C. Turner,Cancer Discov-ery 2012, 2, 524.
[17] H. Zheng, F. Shao, S. Martin, X. Xu, C. X. Deng,Sci. Rep. 2017, 7,