HAL Id: hal-02156603
https://hal.archives-ouvertes.fr/hal-02156603
Submitted on 19 Nov 2019HAL is a multi-disciplinary open access
archive for the deposit and dissemination of sci-entific research documents, whether they are pub-lished or not. The documents may come from teaching and research institutions in France or abroad, or from public or private research centers.
L’archive ouverte pluridisciplinaire HAL, est destinée au dépôt et à la diffusion de documents scientifiques de niveau recherche, publiés ou non, émanant des établissements d’enseignement et de recherche français ou étrangers, des laboratoires publics ou privés.
Validating the sensitivity of inhomogeneous
magnetization transfer (ihMT) MRI to myelin with
fluorescence microscopy
G. Duhamel, V.H. Prevost, M. Cayre, A. Hertanu, S. Mchinda, V.N.
Carvalho, G. Varma, P. Durbec, D.C. Alsop, Olivier M Girard
To cite this version:
G. Duhamel, V.H. Prevost, M. Cayre, A. Hertanu, S. Mchinda, et al.. Validating the sensitivity of inhomogeneous magnetization transfer (ihMT) MRI to myelin with fluorescence microscopy. Neu-roImage, Elsevier, 2019, 199, pp.289-303. �10.1016/j.neuroimage.2019.05.061�. �hal-02156603�
Validating the sensitivity of inhomogeneous Magnetization Transfer
(ihMT) MRI to myelin with fluorescence microscopy
G. Duhamel1*, V.H. Prevost1, M. Cayre2, A. Hertanu1, S. Mchinda1, V. N. Carvalho1, G. Varma3, P. Durbec2, D.C. Alsop3 and O.M. Girard1
1Aix Marseille Univ, CNRS, CRMBM - UMR 7339, Marseille, France 2Aix Marseille Univ, CNRS, IBDM - UMR 7288, Marseille, France
3Department of Radiology, Division of MR Research, Beth Israel Deaconess Medical Center, Harvard Medical School, Boston, MA 02215, USA
*Corresponding author: Guillaume Duhamel, PhD
Aix Marseille Univ, CNRS, CRMBM UMR 7339 27 bd Jean Moulin, Faculté de Médecine
13005 Marseille, France guillaume.duhamel@univ-amu.fr
Highlights
• Inhomogeneous magnetization transfer (ihMT) was validated as a myelin sensitive imaging technique against fluorescence microscopy
• ihMT signal was strongly and significantly correlated with myelin-related plp-GFP (proteolipid - Green Fluorescence Protein) signal
• Short dipolar relaxation time (T1D) filtering is an efficient way to reduce non-myelin contribution in ihMT signal
• MT signal was more weakly correlated with plp-GFP signal and had a much larger non-myelin contribution
• ihMT contrast can be varied with pulse timing, leading to different signal properties in terms of sensitivity and specificity for myelin content
Data availability statement
Abstract
Inhomogeneous Magnetization Transfer (ihMT) is a development from the MT MRI technique. IhMT can be considered as a dipolar order relaxation time (T1D) weighted imaging modality whose signal has shown an enhanced selectivity for myelin-rich structures. However, a formal validation of the ihMT sensitivity relative to a gold standard myelin density measurement has not yet been reported. To address this need, we compared ihMT MRI with green fluorescence protein (GFP) microscopy, in a study performed on genetically-modified plp-GFP mice, considered as a reference technique for myelin-content assessment. Various ihMT protocols consisting of variable T1D filtering and radiofrequency power temporal distributions, were used for comparison with fluorescence microscopy. Strong and significant linear relationships (r2 (0.87-0.96), p <0.0001) were found between GFP and ihMT ratio signals across brain regions for all tested protocol variants. Conventional MT ratios showed weaker correlations (r2 (0.24-0.78), p £0.02) and a much larger signal fraction unrelated to myelin, hence corresponding to a much lower specificity for myelin. T1D-filtering reduced the ihMT signal fraction not attributed to myelin by almost twofold relative to zero filtering suggesting that at least half of the unrelated signal has a substantially shorter T1D than myelin. Overall, these results strongly support the sensitivity of ihMT to myelin content.
Key words
Myelin imaging, MRI, inhomogeneous magnetization transfer, ihMT, plp-GFP, fluorescence microscopy
Funding
This work was supported by the national research agency ANR [ANR-17- CE18-0030], VERISMO project.
V. P. received funding from the French Government's ‘Investissements d'Avenir’ program A*MIDEX, [ANR-11- IDEX-0001-02].
S. M. received funding from ARSEP 2017 grant (Association pour la Recherche sur la Sclérose en Plaques)
V. N. C. received funding from the European Union’s Horizon 2020 research and innovation program under the Marie Skłodowska-Curie grant agreement No713750. Also, it has been carried out with the
financial support of the Regional Council of Provence-Alpes-Côte d’Azur and with the financial support of the A*MIDEX (n° ANR- 11-IDEX-0001-02), funded by the Investissements d'Avenir project funded by the French Government, managed by the French National Research Agency (ANR).
1. Introduction
Magnetization transfer (MT) (Wolff and Balaban, 1989) and inhomogeneous Magnetization Transfer (ihMT) (Varma et al., 2015a) are MRI techniques sensitive to the macromolecular content of biological tissues. Whereas conventional MT analysis considers the classic Zeeman
order magnetization of macromolecules, ihMT highlights dipolar order (Varma et al., 2015b),
an additional degree of freedom associated to dipolar-broadened lineshapes. Dipolar order corresponds to the polarization of dipolar-coupled spins within their local magnetic fields (Korb and Maruani, 1981; Provotorov, 1962) and is associated with a relaxation time constant, T1D. Relatively long T1D values have been measured in lipid bilayer membranes (Swanson et al., 2017) and in brain white (WM) and grey (GM) matter (Varma et al., 2017). In contrast, much shorter T1Ds were estimated in other tissues and samples (Manning et al., 2016; Varma et al., 2015b), which most likely explains the strong selectivity of the ihMT images for myelin-rich structures. This myelin selectivity was further supported by quantitative calculation of the ihMT ratio (ihMTR) values, the ihMT signal normalized by the unsaturated reference signal (S0): ihMTR~4-10% in GM and WM (Girard et al., 2017, 2015) and ihMTR≾1% in muscle tissue (Prevost et al., 2017). In addition to this strong contrast for myelinated tissues, the ihMT technique also benefits from trivial processing, simply based on the subtraction of a minimum of 2 MT images obtained with different radiofrequency (RF) irradiation parameters. Overall, these properties have made ihMT an attractive method to assess myelin-related information in
vivo, in the clinical context of demyelinating diseases (Rasoanandrianina et al., 2017; Van
Obberghen et al., 2018) or in the context of aging studies (Geeraert et al., 2017; Taso et al., 2016). In addition, other studies have shown that the ihMT signal correlates with established myelin-sensitive MR imaging techniques such as myelin water fraction (MWF) (Ercan et al.,
2018; Geeraert et al., 2017). To date, however, no validation of ihMT as a myelin imaging technique against an established histologic standard has been reported.
The existence of an ihMT signal is related to the creation of dipolar order by off-resonance RF irradiation. The ihMT signal is consequently weighted by the associated relaxation time constant T1D. In practice, the sensitization of the ihMT signal for a given T1D value is driven by power and timing parameters of the RF irradiation. Higher RF power tends to increase the ihMT signal of all T1Ds (Prevost et al., 2017), but may reduce ihMT contrast by greatly increasing contribution to the signal from short T1D (i.e. few hundreds of µs to ~1ms) components (Manning et al., 2016) relative to longer T1Ds (i.e. few ms or longer). Fortunately, when using a train of RF pulses for irradiation, the repetition time of consecutive pulses (Dt)
can be tuned to attenuate or filter out the signal contribution from such short T1D components (Prevost et al., 2017). As stressed in recent studies, concentrating RF power within bursts over the long irradiation period, as opposed to RF power regularly distributed along this period, increases the ihMT MRI signal in various tissues (Mchinda et al., 2017; Varma et al., 2018). Overall, the changes in ihMT signal induced by the modification of the irradiation parameters are different depending on the brain structures and type of tissues. Both intensity and contrast in ihMT images depend on the parameters of the RF irradiation, raising additional questions about which acquisitions would correlate best with myelin content. Hence several variants of ihMT acquisitions should be validated against a gold standard myelin measure.
We address this need below by comparing ihMTR values derived from ihMT experiments with different irradiation parameters with myelin-content assessed with a reference technique. Several methods for ex vivo myelin visualization and quantification are available, including histochemical Luxol Fast Blue staining (Kluver and Barrera, 1953), Myelin Basic Protein (MBP) immunostaining, myelin fluorescent reporter mice or transmission electron microscopy. Genetically-modified plp-GFP (proteolipid protein-Green Fluorescent Protein)
mouse is the animal model in which the green fluorescent protein (GFP) is specifically expressed in myelinating oligodendrocytes (Le Bras et al., 2005; Spassky et al., 2001). The GFP fluorescence, which is directly observable and quantifiable with fluorescence microscopy, reflects the expression of proteolipid protein, the major myelin protein in the central nervous system. In the adult brain of these mice, GFP-expressing cells are mature oligodendrocytes but not oligodendroglial progenitors (Ferent et al., 2013). Therefore, fluorescence microscopy performed on plp-GFP mice represents a direct and very valuable tool to observe and quantify myelin content. We chose plp-GFP fluorescence as the reference technique for validating ihMT as a myelin imaging technique.
2. Material and Methods
2.1 Ethics statement
Animal experiments were conducted on C57Bl/6J mice and plp-GFP mice and were performed following French guidelines for animal care from the French Department of Agriculture (Animal Rights Division), the directive 2010/63/EU of the European Parliament and of the Council of 22 September 2010 and approved by our institutional committee on Ethics in animal research (Comité d’Ethique de Marseille n°14, project authorization
APAFIS#1747-2015062215062372v6).
2.2 IhMT technique and irradiation schemes
An ihMT image is generated by the subtraction of an MT image obtained with a single frequency-offset RF irradiation at +Df, MT+, and an MT image obtained with a symmetric dual frequency-offset RF irradiation at ±Df, MT+-, both performed with identical average RF power. Single frequency-offset RF irradiation of the macromolecular pool creates dipolar order (Manning et al., 2016; Varma et al., 2015b), which reduces RF saturation effects contributing to the MT+ signal. On the other hand, simultaneous symmetric dual frequency-offset RF
irradiation eliminates any dipolar order contribution from the MT+- signal (Varma et al., 2015b) and leads to enhanced RF saturation effects (Swanson et al., 2017). Hence, the (MT+ - MT+-) image, that is ihMT, isolates the dipolar order contribution from the MT effects. To minimize sensitivity to off-resonance and asymmetry of the macromolecular line, a second ihMT image using negative frequency irradiation for the single frequency image is also acquired and added to the first (Prevost et al., 2016; Varma et al., 2015a). It has been shown that dipolar order effects are weighted by dipolar relaxation mechanisms (characterized by the dipolar relaxation time T1D) and this additional weighting can be exploited to attenuate/filter out the signal from short T1D components. This is achieved by a modification of the dual frequency-offset RF irradiation experiment, performed sequentially using repetition of frequency alternated RF pulses, as opposed to simultaneously using multiband (e.g. cosine-modulated) RF pulses (Varma et al., 2017). By doing so, dipolar order is allowed to relax in between repeated RF pulses hence providing sensitivity to this contrast mechanism. Based on the above, it may be inferred that the ihMT signal output depends upon the value of T1D, the RF power absorption, and the implementation of the dual frequency-offset RF irradiation. The latter two can be developed to either enhance or attenuate the ihMT signal intensity of components based on their
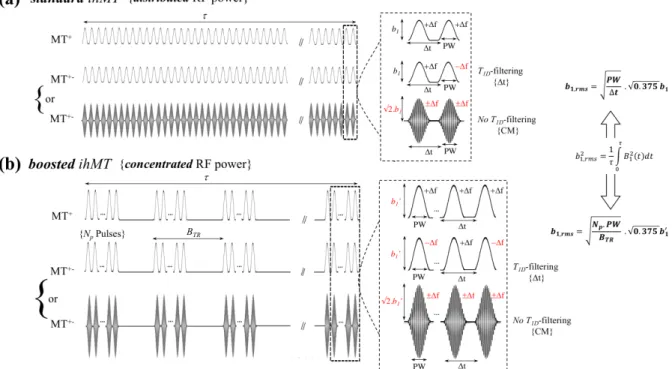
Fig 1. Standard and boosted ihMT protocols. a) standard and b) boosted ihMT protocols obtained with distributed RF power and concentrated RF power throughout the irradiation period, t, respectively. Concentration of RF power was achieved using bursts of Np RF pulses followed by a mixing time
without RF power, repeated every BTR. Dashed boxes were zoomed in to display the main features of
the RF pulses: Hann-shaped pulses (normalized power integral 0.375), duration PW, pulse repetition time Dt, peak power b1 (standard protocols) or b1’ (boosted protocols), frequency +Df or -Df. MT+- was
achieved either by frequency alternation (from +Df to -Df), allowing T1D-filtering, or with
cosine-modulated pulses (CM, peak power increased by a Ö2 factor), producing simultaneous irradiation at +Df
and -Df. CM pulses did not allow T1D-filtering. Identical irradiation power, b1,rms, was used for all
experiments. Note that the indicated b1,rms formulas applied for Hann-shape pulses.
The first strategy, referred to as standard ihMT (Fig. 1a) in the following, corresponds to the one used in previous reports of preclinical and clinical studies (Girard et al., 2015; Prevost et al., 2017; Varma et al., 2015a). It employed for RF irradiation, a train of uniformly distributed pulses (peak power, b1) depositing an average root-mean-square power, b1,rms, over the total irradiation time,t. The second strategy, referred to as boosted ihMT (Fig. 1b) in the following, employed a concentrated RF power deposition scheme. Bursts of Np RF pulses followed by relatively long mixing periods (i.e. periods with RF power set off) were repeated every BTR (burst repetition time) for a total irradiation time, t. Peak power of individual RF pulses (b1’) were adjusted such that the deposited average root-mean-square power was identical to that of
the standard ihMT experiment, b1,rms. The mixing periods, during which both relaxation and magnetization transfer occur, can be properly tuned to enhance the ihMT signal for a given set of irradiation parameters: In humans, 100-200% ihMT signal increase is possible with b1,rms applied in a concentrated manner rather than with uniform distribution of RF power (Mchinda et al., 2017; Varma et al., 2018).
Dual frequency-offset irradiation of both standard and boosted ihMT experiments was achieved either sequentially by alternating the offset frequency (+Df to -Df) of consecutive RF
pulses or, simultaneously, by using cosine-modulated (CM), i.e. dual-band, shaped pulses. Simultaneous irradiation at +Df and -Df leads to actual decoupling of the dipolar order from the
Zeeman order (Varma et al., 2015b) independent of the T1D value. Conversely, the frequency-alternating approach introduces an additional degree of freedom Dt, the time between
consecutive pulses, which can be adjusted to modulate the ihMT signal. Fast frequency-alternation (Δt <<T1D) averages out dipolar order effects occurring during the individual RF pulses, hence leading to a MT+- signal tending towards the one obtained using the simultaneous CM approach. On the other hand, long Δt values (Δt > T1D) allow dipolar order relaxation to occur between individual RF pulses and leads to a dual frequency-offset irradiation experiment virtually equivalent to the single frequency-offset one for infinitely long Dt values (Varma et
al., 2017). For this configuration, the ihMT signal would naturally vanish. In other words, Δt is setting a limit for efficient saturation of both frequency offsets and can be adjusted to attenuate or even filter out the ihMT signal of components associated with short T1D values. Further details of this short T1D-filtering mechanism can be found in (Prevost et al., 2017).
To summarize, the implementations in Fig. 1 lead to distinct ihMT protocol variants, specifically referred to as the following: standard ihMT with or without T1D-filtering (Fig 1a)
and boosted ihMT with or without T1D-filtering (Fig 1b). The value of Dt drives the strength of the T1D-filtering.
2.3 MRI experimental setup
MR experiments were performed with a preclinical 11.75T scanner (Bruker Avance 500 MHz/89 mm wide bore vertical imager, Ettlingen, Germany) and a transmit/receive volume birdcage coil (Bruker, Ettlingen, Germany; length L=3 cm, diameter Ø=2 cm). Experiments were conducted on healthy female C57Bl/6J mice and plp-GFP mice. After isoflurane induction in an anesthetic chamber at 3%, mice were maintained under anesthesia during MR experiments by spontaneous respiration of a mixture of air and isoflurane (1.5%; constant flow, 300 mL/min; Univentor 400 anesthesia unit, Zejtun, Malta) through a dedicated nose cone. Respiration and temperature were controlled throughout the experiments with an MR-compatible monitoring and gating system (SA Instruments, Stony Brook, NY, USA). A heating blanket connected to a water bath system was placed on the back of the mice to maintain physiological temperature (T = 37.0 ± 0.5°C).
Prior to ihMT image acquisition, first and second order B0 shimming was performed using fastmap (Bruker) with a 1.15x1.15x1.15 cm3 volume centered in the mouse brain. The MT irradiation schemes of Fig. 1 followed by a single-shot RARE (Rapid Acquisition with Relaxation Enhancement) readout were implemented in Bruker’s Paravision 5.1 software. The following imaging parameters were used for all experiments: axial orientation; slice thickness, 1 mm; field of view, 20 mm; acquisition matrix, 64 × 64; minimum TE and echo spacing, 1.82 ms; TEeff = 12.74 ms; RARE factor = 38; partial Fourier acceleration = 1.7; linear phase encoding; bandwidth = 400 kHz; acquisition train length ~70 ms; TR = 3 s.
At very high magnetic field, the chemical shift of the macromolecular line induces MT asymmetry effects, which need to be accounted for to obtain reliable ihMT measurements
(Prevost et al., 2016). Compensation was realized experimentally by i) shifting the center
frequency, fc, of the irradiation offset-frequency Df from fc=0Hz to fc=-100Hz, and ii) by taking for the single frequency-offset MT image, the average of a MT image obtained with irradiation realized at fc+Df, (MT+) and one obtained with irradiation realized at fc-Df, (MT -) (Prevost et
al., 2016). Finally, acquisition of two dual frequency-offset MT image (MT+- and MT-+) allows calculation of the final ihMT image as:
𝑖ℎ𝑀𝑇 = (𝑀𝑇* + 𝑀𝑇,) − (𝑀𝑇*, + 𝑀𝑇,*) equation 1
An extra image acquired with the RF irradiation power set to zero, S0, served as reference signal for normalization and calculation of the semi-quantitative ihMT ratio:
𝑖ℎ𝑀𝑇𝑅 = 01234
5 equation 2
Single-offset and dual-offset MT ratios (MTR+Df and MTR+/-Df) can be derived from the same image dataset as
𝑀𝑇𝑅*∆7 = 1 −239
45 equation 3
𝑀𝑇𝑅*/,∆7 = 1 −239;
45 equation 4
2.4 Validation of ihMT with fluorescence microscopy
This experiment evaluated to what extent ihMTR values obtained with different ihMT protocols correlate with myelincontent. Two axial ihMT RARE slices (position: 0.7mm and -3.2mm from bregma) were acquired on plp-GFP mice (n=3, 12 weeks, 23±2g) with six different ihMT variants consisting of both standard and boosted protocols parameterized with different
latter two achieved by sequential frequency alternation and increasing values of Dt. The irradiation parameters of each ihMT variant, summarized in table 1, were chosen to maximize the signal difference between myelinated (WM and GM) and non-myelinated (muscle) structures, based on the results reported in Prevost et al (Prevost et al., 2017) for standard protocols and on the results of the experiment presented in appendix A for boosted protocols. A total number of 80 and 50 repetitions of the ihMT (MT+, MT-, MT+- and MT-+) images were acquired for standard protocols and boosted protocols respectively. The acquisition time was 3 seconds for a single-NEX MT image and hence 12 seconds for a single-NEX ihMT image. The acquisition time for the 6 investigated configurations (50 NEX and 80 NEX for the boosted and
standard protocols and S0 images) was 84 minutes and the total experiment (including animal temperature stabilization, RF coil power and shim adjustment, image localization and acquisition of the ihMT protocols) had a duration of 115-120 minutes.
Table 1: Parameters for the ihMT protocols used in studies for comparison with fluorescence microscopy
protocol T1D-filtering Np BTR (ms) PW (ms) b1 or b1’ (µT)
standard
Strong (Dt=3.3ms) N/A N/A 3 11.4
Weak (Dt=1.3ms) N/A N/A 1 12.4
No (CM, Dt=1.3ms) * N/A N/A 1 12.4
boosted
Strong (Dt=3.3ms) 12 90 3 17.2
Weak (Dt=1.3ms) 12 90 1 29.8
No (CM, Dt=1.3ms) 12 90 1 29.8
Standard and boosted ihMT protocols with 3 different T1D-filtering strengths were applied on 3 plp-GFP
mice. PW corresponds to the pulse length, Dt to the repetition time of consecutive pulses, Np to the
number of pulses per burst, BTR to the repetition time of consecutive bursts and b1’ to the peak-power of
the irradiation pulses. The * symbol indicates that the standard protocol without T
1D-filtering was applied
on 2 mice only. Other irradiation parameters were b1,rms=6.7µT, Df=10kHz and t=900ms.
After in vivo MR experiments, mice were deeply anesthetized (ketamine 150 mg/kg with xylazine 15 mg/kg) and perfused (intra-cardiac) with the fixative paraformaldehyde (PFA) 4%. Mouse brains were then extracted, post-fixed 2 hours in 4% PFA and cryopreserved overnight in 20% sucrose. Brains were frozen and carefully sectioned into 20-µm thick histological slices (Cryostat Leica CM3050S) targeting the same axial planes as imaged by MRI
(rostro-caudal levels -0.7mm and -3.2mm from bregma). Sections were mounted with Dabco anti-fading agent. GFP fluorescence images were acquired using a Zeiss fluorescence microscope with a 5x objective and a fixed exposure time.
2.5 Image processing
MRI data processing was realized with Matlab (vR2012, MathWorks Inc., Natick, MA, USA). For each configuration of table 1, individual 256x256 MT images were reconstructed by Fourier transform after cosine windowing (Harris, 1978) and 4x zero-filling of the 64x64 initial k-space. Magnitude MT images were averaged over the NEX and processed using custom routines to generate the final ihMT and ihMTR images using equations 1 and 2, as well as MTR+Df and MTR+/-Df images using equations 3 and 4. Note that strictly-speaking the concept of T1D-filtering does apply for dual-offset frequency irradiation MT and ihMT, but not for single-frequency irradiation MT. For single frequency RF irradiation, weak and no T1D-filtering experiments were identical (single-offset RF pulses repeated every (Dt=1.3ms)). However, for consistency in presentation, we refer to the different T1D-filtering conditions for ihMTR, MTR +/-Df, as well as MTR+Df.
Quantitative analyses were performed in 7 different brain structures: internal capsule (IC), corpus callosum (CC), optic nerves (ON), thalamus (Th), cortex (Cx), hippocampus (HC) and Inter-Peduncular Nucleus (IPN). Regions-of-interest (ROIs) were manually placed in these 7 brain structures on ihMTR and GFP fluorescence images (Fig. 3d) by two different observers (V.H.P and M.C) using a mouse brain atlas as reference. The analysis was restricted to these structures, considered relatively homogeneous throughout the 1mm-thick slices, in order to limit partial volume effects in MRI measurements. Mean values of ihMTR, MTR+Df and MTR +/-Df were measured in each ROI for all mice. Quantification of myelin content in each ROI was
obtained by measuring the mean GFP fluorescence intensity (ImageJ software (NIH)) in 3 20µm-thick histological sections, spaced by 160µm each, hence covering a total thickness of 340µm. Background fluorescence (measured in the lateral ventricle) was subtracted from the mean GFP fluorescence intensity. The resulting signal was normalized, taking as a reference the ROI with the highest GFP signal, and was referred to as [𝐺𝐹𝑃@@@@@@] in the following.
2.6 Statistical analyses
Statistical analyses were performed using JMP software (v9.0.1; SAS Institute, Cary, NC).
One-way analysis of variance followed by a Tukey–Kramer HSD test corrected for multiple comparisons was used to test for differences between brain structures for ihMTR values and GFP values. Three groups of structures were considered for such comparison: white matter, obtained by averaging measurements in IC, CC and ON ROIs; mixed structures, obtained by averaging measurements in Th and IPN ROIs; and grey matter obtained by averaging measurements in Cx and HC ROIs.
Pearson’s correlation coefficient (r) and linear regression analysis were used to determine associations of the relationship between individual ihMTR values (derived from the 6 variants of table 1) and myelin-content (GFP fluorescence intensity, [𝐺𝐹𝑃@@@@@@]) across ROIs in IC, CC, ON, Th, Cx, HC and IPN and animals (n=3). Linear regression analysis was also performed for mean ihMTR values in each ROI calculated over the three animals. A correlation coefficient r>0.7 (r2>0.5) being considered as significantly strong with P-value<0.05. Significance of differences between Pearson’s correlation coefficients for the 6 sequence variants was tested using Fisher’s
r-to-z transformation and asymptotic z-test. Slopes and intercepts of regression equations were
compared between protocol variants using analysis of covariance (ANCOVA) where ihMTR values were used as a dependent variable, GFP fluorescence intensity ([𝐺𝐹𝑃@@@@@@]) was used as a
covariate, and the protocol variant was used as a categorical factor. In addition, the agreement between ihMT and GFP fluorescence was assessed by a Bland-Altman analysis (Bland and Altman, 1986). IhMTR values in different anatomical structures were normalized with respect to values in IC. Differences between normalized ihMTR values (B𝚤ℎ𝑀𝑇𝑅@@@@@@@@@D) and [𝐺𝐹𝑃@@@@@@] values were then plotted against their averages. Significance of the bias between ihMT and GFP measurements was evaluated using the one sample t-test for the mean difference. The limits of agreement were calculated as the mean difference ± 1.96 standard deviation of the mean difference. Similar correlation analyses with GFP were performed for MTR+Df and MTR+/-Df.
3. Results
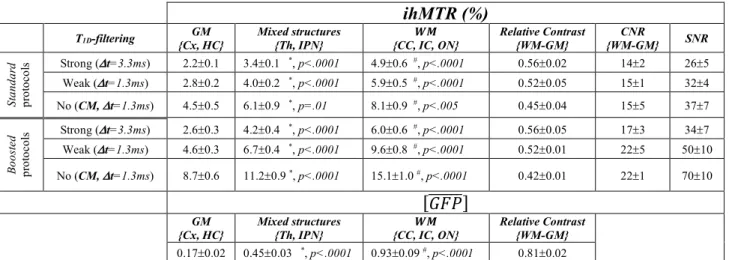
Representative standard and boosted ihMTR images obtained at -3.2mm and -0.7mm from bregma with the 6 ihMT protocols outlined in table 1 and showing different intensities and contrasts are displayed in figure 2. Figures 3a and 3b show the good qualitative agreement in the distribution of signal intensity within the brain between ihMTR and GFP fluorescence images: white matter structures including IC, CC and ON presented high intensities whereas GM Cx and HC showed reduced intensities. ROIs within brain structures used for quantitative measurements of ihMTR and GFP fluorescence, and for correlation analyses are displayed in Fig. 3d. Table 2 summarizes the statistics of GFP fluorescence and ihMTR measurements in brain structures. Values of [𝐺𝐹𝑃@@@@@@] and ihMTR were found significantly different in all structures (and for all ihMT configurations). Relative contrast values between WM and GM were higher for T1D-filtered ihMTR images (0.52-0.56) compared to non-filtered ones (0.42-0.45). Conversely, the non-filtered ihMTR images provided the highest SNR values. As for CNR, higher values were obtained for weakly-filtered and non-filtered ihMTR images.
Table 2: Quantitative ihMTR and [𝐺𝐹𝑃@@@@@@] values in brain structures
ihMTR (%)
T1D-filtering {Cx, HC} GM Mixed structures {Th, IPN} {CC, IC, ON} 𝑾𝑴 Relative Contrast {WM-GM} {WM-GM} CNR SNR
St andar d pr ot oc ol s Strong (Dt=3.3ms) 2.2±0.1 3.4±0.1 *, p<.0001 4.9±0.6 #, p<.0001 0.56±0.02 14±2 26±5 Weak (Dt=1.3ms) 2.8±0.2 4.0±0.2 *, p<.0001 5.9±0.5 #, p<.0001 0.52±0.05 15±1 32±4 No (CM, Dt=1.3ms) 4.5±0.5 6.1±0.9 *, p=.01 8.1±0.9 #, p<.005 0.45±0.04 15±5 37±7 Bo os te d pr ot oc ol s Strong (Dt=3.3ms) 2.6±0.3 4.2±0.4 *, p<.0001 6.0±0.6 #, p<.0001 0.56±0.05 17±3 34±7 Weak (Dt=1.3ms) 4.6±0.3 6.7±0.4 *, p<.0001 9.6±0.8 #, p<.0001 0.52±0.01 22±5 50±10 No (CM, Dt=1.3ms) 8.7±0.6 11.2±0.9 *, p<.0001 15.1±1.0 #, p<.0001 0.42±0.01 22±1 70±10 [𝐺𝐹𝑃@@@@@@] GM {Cx, HC} Mixed structures
{Th, IPN} {CC, IC, ON} 𝑾𝑴
Relative Contrast {WM-GM}
0.17±0.02 0.45±0.03 *, p<.0001 0.93±0.09 #, p<.0001 0.81±0.02
Mean values ± standard deviation, calculated by pooling the measurements of the 3 mice in Cx and HC ROIs for GM; in Th and IPN ROIs for mixed structures and the measurements in IC, CC and ON ROIs for WM. The relative contrast between WM and GM was calculated as (ihMTRWM -ihMTRGM)/ihMTRWM for MRI and as ([𝐺𝐹𝑃@@@@@@]WM-[𝐺𝐹𝑃@@@@@@]GM)/ [𝐺𝐹𝑃@@@@@@]WM for fluorescence. The CNR was calculated as (ihMTRWM-ihMTRGM)/s, and the SNR as ihMTRWM/s, with s, the noise of the ihMTR image. The # symbol indicates statistical difference (ANOVA, Tukey-Kramer HSD corrected for multiple comparisons) with values in both GM and mixed structures and the * symbol indicates statistical difference with values in GM.
Fig 2. standard ihMTR and boosted ihMTR (Np=12, BTR=90ms) maps obtained on the same mouse
for different T1D-filtering strengths at a) -3.2mm and b) -0.7mm from bregma. Other irradiation
parameters were B1,rms=6.7µT, Df=10kHz and t=900ms. These maps were used for correlation analyses
with GFP fluorescence by comparing ihMTR values and normalized GFP intensity measured in ROIs outlined in Fig. 3d.
Fig 3. (a) ihMTR maps (boosted protocol, Np=12, BTR=90ms, weak T1D-filtering, Dt=1.3ms) with insets
showing zoomed regions for comparison with (b) GFP fluorescence images. Images located at -0.7mm and -3.2mm from bregma. Note that the bright spots visible at the bottom of the ihMTR map (-3.2mm from bregma) correspond to trigeminal nerves, which were not preserved during the brain extraction.
(c) Mouse brain atlas at -0.7mm and -3.2mm from bregma (Franklin and Paxinos, 2013) indicating the
investigated brain structures: cortex (Cx), corpus callosum (CC), thalamus (Th), internal capsule (IC), optic nerves (ON), hippocampus (HC) and Inter-Peduncular Nucleus (IPN). (d) ROIs used for quantitative analyses and regression analyses are superimposed on ihMTR maps and GFP fluorescence images.
Results of the linear regression analyses of ihMTR values as a function of the normalized GFP signal intensity, [𝐺𝐹𝑃@@@@@@], for individual data and averaged across ROIs data are presented in Table 3, and corresponding plots are shown in Figs. 4a and 4b respectively. Bland-Altman plots
comparing normalized ihMTR values and normalized GFP intensity in the ROIs are shown in Appendix B (Fig. B.1).
Fig 4. Linear regressions of ihMTR values derived from the 6 ihMT protocols described in table 1 on
myelin density according to [𝐺𝐹𝑃@@@@@@] values in brain structures for (a) individual measurements in each animal and each ROI of Figs. 3d and (b) mean values in each ROI (error bars representing standard deviations across mice). Plain markers correspond to results from standard ihMT protocols (Fig.1a) and open markers from boosted ihMT protocols (Fig. 1b). The different colors indicate variable T1D-filtering
strengths. Linear fits (𝑖ℎ𝑀𝑇𝑅 = 𝛼 × [𝐺𝐹𝑃@@@@@@] + 𝛽) to scatterplot data were obtained by least-square regression and correlation coefficients, r2, (assessed by a bivariate (Pearson) correlation test) were
reported for all protocols. Shaded areas correspond to confidence curves for line fits with a a-level=0.1. All correlations were significant (p <0.0001).
The significance of the linear relationship between ihMTRs and [𝐺𝐹𝑃@@@@@@] (𝑖ℎ𝑀𝑇𝑅 = 𝛼 × [𝐺𝐹𝑃@@@@@@] + 𝛽) was very high for all ihMT protocol variants for both individual data (0.87 £
r2 £ 0.97, p <0.0001 (Fig. 4a)) and averaged data (0.96 £ r2 £ 0.99, p <0.0001 (Fig. 4b)). Moreover, no significant differences were found for correlation strength of the regression lines between ihMTR variants, thereby validating ihMT as a myelin-sensitive imaging technique, regardless of the selected irradiation parameters. Bland-Altman plots (Fig. B.1) show good agreements between [𝐺𝐹𝑃@@@@@@] and B𝚤ℎ𝑀𝑇𝑅@@@@@@@@@D for all configurations with a significant bias ranging from ~12% for T1Dfiltered protocols to ~20% for nonfiltered ones. A proportional bias (~ -0.5) was observed indicating closer agreement for measurements in WM. This proportional bias was reduced for T1D-filtered ihMTR configurations, consistent with the lower intercept obtained from the regression analysis.
Table 3: Linear regression analysis of associations between ihMTR and [𝐺𝐹𝑃@@@@@@] – Sensitivity and specificity of ihMTR for myelin.
𝑖ℎ𝑀𝑇𝑅 = 𝛼 × [𝐺𝐹𝑃@@@@@@] + 𝛽 T1D-filtering r r2 n p a±da, p b ±db, p 𝑺𝒑 = 𝜶 𝜶*𝜷 ±dSp 𝑵𝑺𝒑 = 𝟏 − 𝑺𝒑 ±dNSp In di vi du al d at a (F ig . 4a) St andar d ih M T Strong (Dt=3.3ms) 0.97 0.94 23 <.0001 3.62 ± 0.20, p<.0001 1.60 ±0.12, p<.0001 0.69 ± 0.06 0.31 ± 0.03 Weak (Dt=1.3ms) 0.98 0.96 23 <.0001 4.02 ± 0.19, p<.0001 2.17 ± 0.11, p<.0001 0.65 ± 0.04 0.35 ± 0.03 No (CM, Dt=1.3ms) 0.93 0.87 15 <.0001 4.78 ± 0.51, p<.0001 3.70 ± 0.31, p<.0001 0.56 ± 0.08 0.44 ± 0.06 Bo os te d ih M T Strong (Dt=3.3ms) 0.97 0.94 23 <.0001 4.43 ± 0.25, p<.0001 1.95 ± 0.15, p<.0001 0.69 ± 0.06 0.31 ± 0.03 Weak (Dt=1.3ms) 0.98 0.96 23 <.0001 6.57 ± 0.28, p<.0001 3.52 ± 0.17, p<.0001 0.65 ± 0.04 0.35 ± 0.02 No (CM, Dt=1.3ms) 0.98 0.96 23 <.0001 8.41 ± 0.38, p<.0001 7.29 ± 0.23, p<.0001 0.53 ± 0.03 0.47 ± 0.02 St ruc tur e-ave rage d dat a (F ig. 4 b) St andar d ih M T Strong (Dt=3.3ms) 0.99 0.98 7 <.0001 3.56 ± 0.23, p=.0001 1.65 ± 0.15, p<.0001 0.68 ± 0.07 0.32 ± 0.04 Weak (Dt=1.3ms) 0.99 0.98 7 <.0001 3.99 ± 0.23, p<.0001 2.20 ± 0.15, p<.0001 0.65 ± 0.05 0.35 ± 0.03 No (CM, Dt=1.3ms) 0.98 0.96 7 <.0001 4.84 ± 0.42, p<.0001 3.74 ± 0.28, p<.0001 0.56 ± 0.07 0.44 ± 0.05 Bo os te d ih M T Strong (Dt=3.3ms) 0.99 0.97 7 <.0001 4.28 ± 0.31, p<.0001 2.06 ± 0.20, p=.0002 0.68 ± 0.07 0.32 ± 0.04 Weak (Dt=1.3ms) 0.99 0.98 7 <.0001 6.47 ± 0.35, p<.0001 3.61 ± 0.23, p<.0001 0.64 ± 0.05 0.36 ± 0.03 No (CM, Dt=1.3ms) 0.99 0.99 7 <.0001 8.40 ± 0.37, p<.0001 7.33 ± 0.24, p<.0001 0.53 ± 0.03 0.47 ± 0.02
n represents the number of data points used for regression analysis. Sp, calculated as 𝑆𝑝 = R R*S corresponds to the component of ihMTR signal associated specifically to myelin and NSp, calculated as 𝑁𝑆𝑝 = 1 − 𝑆𝑝 = U
V9U to the non-specific signal component; da, db, dSp and dNSp correspond to the
standard deviations of each metric. Coefficients of correlation between ihMTR and [𝐺𝐹𝑃@@@@@@], r, were assessed by a bivariate (Pearson) correlation test, with p<0.05 considered as significant.
Of interest, ihMT was much more highly correlated with myelin, as quantified by GFP, than conventional MTR measurements obtained from the data (Tables S1 and S2 in supplementary materials and corresponding plots shown in Figs. 5): 0.24 £ r2£ 0.64, p <0.02 for MTR+Df individual data (Fig. 5a) and 0.47 £ r2£ 0.69, 0.02 < p <0.09 for MTR+Df averaged data (Fig. 5b); 0.67 £ r2£ 0.78, p <0.0001 for MTR+/-Df individual data (Fig. 5c) and 0.73 £ r2 £ 0.82, 0.03 < p <0.07 for MTR+/-Df averaged data (Fig. 5d). Bland-Altman plots (Figs. B.2) show much poorer agreement for MTR+Df and MTR+/-Df with [𝐺𝐹𝑃@@@@@@] as compared to ihMTR, with constant biases in the order of ~40-45% and proportional biases 3 times higher (~ -1.5) than those obtained with ihMTR.
Fig 5: Linear regressions of MTR+Df (a,b) and MTR+/-Df (c,d) values derived from the 6 protocols described in table 1 on myelin density according to [𝐺𝐹𝑃@@@@@@] values in brain structures for (a, c) individual measurements in each animal and each ROI of Figs. 3d, and (b, d) mean values in each ROI (error bars representing standard deviations across mice). The different colors indicate variable T1D-filtering
strengths. Linear fits (𝑀𝑇𝑅*∆7 = 𝛼 × [𝐺𝐹𝑃@@@@@@] + 𝛽 (a,b) and 𝑀𝑇𝑅*/,∆7= 𝛼 × [𝐺𝐹𝑃@@@@@@] + 𝛽 (c,d)) to scatterplot data were obtained by least-square regression and correlation coefficients, r2, (assessed by a
bivariate (Pearson) correlation test) were reported for all protocols. Shaded areas correspond to confidence curves for line fits with a a-level=0.1. All correlations were significant (P <0.0001 for MTR+/-Df v.s. GFP, and P <0.02 for MTR+Df v.s. GFP).
Despite the excellent correlations between ihMTR values and [𝐺𝐹𝑃@@@@@@], all ihMT protocol variants are not equivalent. Boosted configurations produced significantly higher slope (a) and intercept (b) values (p<0.01) than their counterparts acquired with standard configurations, with the exception of strong-T1D filtering sequences, for which no differences were found in the
intercepts between standard and boosted protocols (p=0.16). For standard protocols, significant differences in the slopes were found between no T1D-filtering and strong T1D-filtering configurations only (p=0.01), whereas intercepts were different between all T1D-filtering conditions (p<0.03). For boosted protocols, slopes and intercepts were different between all
T1D-filtering conditions (p<0.0001). The differences in linear regression a and b parameters provide key information regarding the sensitivity and specificity of ihMTR for myelin. Within the framework of brain tissue analysis, a sensitivity of ihMTR for myelin may be defined by the slope, a, and a corresponding specificity as 𝑆𝑝 = R*SR . Indeed, for [𝐺𝐹𝑃@@@@@@]=1 (case of the most myelinated structure taken as reference for normalization), the component of the ihMTR signal associated with this GFP signal (and hence with myelin) is 𝛼 for a total detected ihMTR signal of 𝛼 + 𝛽. Hence, Sp corresponds to the fraction of the ihMTR signal that is specific to myelin. In other words, 𝑆𝑝 = 70% means that for the most myelinated structure ([𝐺𝐹𝑃@@@@@@]=1), 70% of the ihMTR signal can be associated specifically with myelin. By extension, one can also define the non-specific ihMTR signal component as 𝑁𝑆𝑝 = 1 − 𝑆𝑝 =R*SS . The importance of power concentration and T1D-filtering for the sensitivity and specificity of ihMT to myelin is quantitatively highlighted in table 3. Higher slope values (a) obtained with the
boosted protocols signify higher sensitivity for myelin as compared to their standard ihMT
variant counterparts. In addition, stronger T1D-filtering resulted in lower sensitivity (lower a) but higher specificity (Sp) of ihMTR for myelin. Of particular interest, the myelin-specificity of ihMT is preserved for boosted protocols associated with T1D-filtering, as shown by identical values of Sp obtained for standard and boosted ihMT with strong T1D-filtering (Sp=0.69±0.06) or weak T1D-filtering (Sp=0.65±0.04). Without T1D-filtering, a slight decrease of specificity was observed for boosted ihMT (Sp=0.53±0.03) compared to standard ihMT (Sp=0.56±0.08).
non-filtered conditions, similar to MTR+/-Df. Both MTR+Df and MTR+/-Df were associated with lower values of Sp, with minor dependence on the T1D-filtering strengths (0.08£ Sp £0.12 for MTR+Df and 0.16£ Sp £0.18 for MTR+/-Df, Tables S1 and S2 in supplementary material) in comparison to ihMTR.
4. Discussion
4.1 Validation of ihMT with GFP fluorescence microscopy
Notwithstanding the dependence of signal intensity on irradiation parameters, all ihMT protocol variants produced ihMTRs highly correlated with the GFP signal (r2>0.9, Fig. 4). Since GFP in our model is expressed under the control of the promoter of plp, the major protein constituting myelin, it seems reasonable to assume a linear relationship between GFP signal and myelin content (Le Bras et al., 2005; Spassky et al., 2001), at least in the context of mature and intact myelin. These strong correlations generally validate ihMT as a myelin-sensitive imaging technique. It is important to note that no other correction than the removal of the background noise signal (measured in the ventricle) was applied for calibrating the GFP signal. In particular, the tissue autofluorescence, which may interfere with GFP fluorescence and introduce a signal-offset, was not considered. Since this potential GFP-signal offset would in turn translate into a quantification bias of b, a variability in the absolute values of Sp and NSp would be expected. However, for a given mouse, since the same GFP-offset bias occurred for all ihMT analyses, the relative differences in a, b, Sp and NSp observed between the ihMT variants can be generalized.
The validation of ihMT as a myelin-sensitive imaging technique is an important step for the use of ihMT in preclinical and clinical research for diagnosis, therapy follow-up or neuroscience studies.
MT imaging applied in demyelinating disorders showed that MTR variations can be associated with demyelination (Zaaraoui et al., 2008), inflammation (Gareau et al., 2000) and edema (Dousset et al., 1992). The sensitivity of MT to these multiple mechanisms limits the potential of the semi-quantitative MTR parameter to univocally characterize demyelination/remyelination processes in myelin diseases such as multiple sclerosis (Moll et al., 2011). On the other hand, quantitative MT (qMT) provides us with f, the macromolecular bound pool fraction (Sled and Pike, 2000), a quantitative metric that is highly-correlated with myelin content in various neurological conditions (Thiessen et al., 2013; Underhill et al., 2011), albeit not specific. The main issue with this model-based technique is the rather long protocol and complex processing (Portnoy and Stanisz, 2007), which requires several parametric images for robust multi-parameter fitting, even for the most optimized ones (Naumova et al., 2017; Yarnykh, 2012).
In contrast, ihMT allows probing an additional degree of freedom within the myelin resonance spectrum and can have an interesting role to play. IhMT variants generally outperformed their conventional MT counterparts for myelin detection, as indicated by much weaker correlations between MTR values and [𝐺𝐹𝑃@@@@@@] (Fig. 5). The specificity of ihMTR for myelin was about 4 to 6 times higher than that of MTR+Df and MTR+/-Df (Sp values, Tables 3, S1 and S2). The irradiation parameters explored offered limited opportunities to sensitize MT sequences to a specific T1D range for modulation of the myelin-specificity, unlike ihMT protocols. This is demonstrated by the MTR+/-Df data having minor differences in both a and
Sp for varying MR parameters (table S2, supplementary material), consistent with the
dual-frequency offset irradiation being naturally insensitive to T1D because of decoupling of Zeeman order from dipolar order. For single-frequency offset irradiation, although the contribution of dipolar order is embedded in the large MT signal, it may still have an effect: When strong dipolar order is created such as for boosted protocols, the sensitivity and specificity for myelin
were reduced (see a and Sp in table S1). This is a rather paradoxical situation: the stronger the dipolar order effects are generated in myelinated tissues, the stronger the attenuation of MT+ saturation effects, hence limiting sensitivity and specificity for these tissues.
Correlations of ihMTRs with myelin histology imaging are as good as those obtained with f, the bound pool fraction extracted from qMT analyses (Khodanovich et al., 2017; Underhill et al., 2011), which was found to be the best predictor of pathological myelin content among metrics derived from other advanced MR techniques (DTI, T1, T2, MWF) (Thiessen et al., 2013). The intercepts of the linear equations describing the relationship between myelin content and ihMTRs (Fig. 4) and between myelin content and f (Thiessen et al., 2013; Underhill et al., 2011) were both non-zero, thereby indicating that structures other than myelin contribute to these measured parameters. Fortunately, with ihMT, T1D-filtering can be used to tailor protocols with variable contributions of non-myelin protons. Although the myelin nonspecific signal component could represent almost half of the total ihMT signal without T1D-filtering, it reduces to a third of the total when modest short-T1D filtering was used (NSp values, table 3). This indicates that, on average, ihMT-responding non-myelin protons are associated with T1D values shorter than myelin ones. Though further investigation of the precise nature of those protons is merited, the faster dipolar relaxation of these protons could result from faster water exchange processes (Manning et al., 2016). Hence, membrane protons of less motionally-restricted glial cells, which represent nearly 35% of mouse brain cells (Herculano-Houzel et al., 2006) are reasonable candidates. In principle, even larger Dt values might entirely remove the contribution from short-T1D non-myelin structures, leading to 100% myelin-specific ihMTR images, albeit with lower sensitivity. Note also that further investigation of the contribution of other ihMT parameters (f, the fraction of dipolar order associated to T1D and R, the exchange rate with the free pool) is merited. Indeed, if the strength of T1D-filtering scales the initial
sensitivity, f and R associated to the different structures may further contribute to the final signal and contrast.
In summary, ihMTRs are semi-quantitative parameters trivial to process, highly correlated to myelin content and whose sensitivity and specificity to myelin can be modulated by sequence parameters variation. These properties are all assets, which warrant future studies to evaluate the potential of ihMT for studies of myelin related disorders.
4.2 What is the optimal ihMT protocol for myelin imaging?
Boosted ihMT protocols should benefit all applications of the technique, but the best choice of cosine-modulated pulses or frequency-alternated pulses for dual-offset irradiation would depend on the specific target of the study. Hence, if very high sensitivity (a value) for myelin is sought, then boosted ihMT protocols without any T1D-filtering (i.e. use of cosine-modulated pulses), which additionally provide the highest value of SNR and high CNR, are best options. However, the extent to which a significant signal arising from non-myelin protons (NSp~0.5, table 3) could interfere with the unambiguous interpretation of ihMTR variations as a change in myelin with this protocol needs to be evaluated. Conversely, protocols with frequency-alternating pulses provide more opportunities to modulate the ihMT contrast with
T1D-filtering, offer highest relative contrast values and higher specificity (Sp³0.65, table 3) for myelin. As such, boosted ihMT configurations associated with weak T1D-filtering (Dt~1ms), which additionally provide high SNR values and similar CNR than that of non-filtered protocols, can be considered as optimal ihMT protocols.
Interestingly, T1D-filtered and non-filtered ihMT protocols could also be combined
together (e.g. by subtraction) to filter-out signal of long-T1D components and modulate
interesting in animal models that involve loss of the myelin compact multilamellar structure (e.g. Experimental Allergic Encephalomyelitis (EAE), a relevant model of multiple sclerosis) (Ohler et al., 2004), for which a decrease in T1D values might be expected.
In any case, ihMTR values are not unique for a given tissue but depend on the irradiation scheme and associated parameters. Hence, in order to ease future comparisons, it is recommended to carefully note the type of protocols used, RF irradiation power and T1D -filtering conditions in future reports of ihMT studies.
4.3 Limitations of the study
One of the main limitations of this study is the small number of investigated animals (n=3). Additionally, ihMTR analyses were performed on relatively low resolution and thick slice 2D images, which limited the ability to perform a voxel-by-voxel comparison with GFP images and only permitted the ROI analysis to be performed in a few regions of the brain. Highly resolved 3D imaging and image coregistration would improve the comparison of ihMTR with GFP images. The acquisition time for the multiple NEX used to obtain ihMTR images in this study was rather long, which could prevent their use in multimodal imaging studies. However, halving the number of NEX, and therefore reducing the acquisition time for boosted ihMTR images to ~6 minutes, did not change the correlation results (data not shown) nor the conclusions regarding sensitivity and specificity of the ihMTR variants for myelin. This is rather important for human studies, for which a high number of scan repetition is usually not feasible. Finally, no absolute quantification of the measurements was achieved in this study. Hence, even though ihMTR correlates well with GFP fluorescence it does not provide an absolute quantitative measure of myelin content. In this perspective refined quantitative ihMT metrics, including for instance the value of the dipolar order relaxation time, T1D, or the fraction of macromolecules associated to dipolar order, f, could be obtained by application of the ihMT
models (Varma et al., 2017, 2015b) on data acquired with several different irradiation parameters.
5. Conclusion
This work reports a formal validation of the ihMT sensitivity relative to a reference myelin density measurement technique, plp-GFP fluorescence microscopy.
All tested ihMT protocol variants, standard and boosted with or without T1D-filtering, showed very high correlations with GFP detection in the plp-GFP reporter mouse line, thereby generally validating ihMT as a myelin-sensitive technique. Short-T1D filtering reduced the fraction of signal unrelated to myelin, hence making protocols with frequency-alternating pulses for dual-offset frequency irradiation more myelin-specific than those using cosine-modulated pulses.
IhMT protocols generally outperformed their conventional MT counterparts as indicated by higher correlations between ihMTR values and GFP fluorescence signal, 4-6 times higher specificity for myelin, and a broad capacity to sensitize ihMTR to specific T1D ranges. These assets provide motivation for the use of ihMT and to evaluate its potential in future studies of myelin disorders.
6. Appendices
A.1 Characterization of the boosted ihMT protocols
A comprehensive characterization of the boosted ihMT protocol is presented and discussed in this appendix. It extended analyses of previous studies performed in a clinical context
(Mchinda et al., 2017; Varma et al., 2018) by characterizing the effects of power concentration on the ihMT signal for various T1D-filtering conditions and high RF-power irradiation conditions (B1,rms=6.7µT), that are not achievable within typical clinical settings at conventional field strengths (𝐵[ ≥ 1.5𝑇). This characterization enabled determining a set of boosted ihMT protocols providing high signal selectivity for myelin-rich structures, which were used for the validation study (section 2.4).
A.2 Methods
Female C57Bl/6J mice (12 weeks, 23±2g) underwent a 2-hour protocol during which axial single-slice (position: -0.7mm from bregma) boosted ihMT RARE images (Fig. 1b) were acquired using the parameters in table A1. A total number of 6 mice was necessary to cover the 39 sets of parameters in order to obtain a total number of n=3 mice per parameter set.
Table A1: boosted ihMT protocol parameterization
T1D-filtering Np BTR (ms) PW (ms) b1’ (µT) Strong (Dt=3.3ms) 6 12 18 60, 90, 130 60, 90, 130 60, 90, 130 3 3 3 19.9, 24.3, 29.3 14.0, 17.2, 20.7 11.5, 14.0, 16.9 Weak (Dt=1.3ms) 2 6 12 18 13, 50, 130 30, 50, 90, 130 30, 50, 90, 130 30, 50, 90, 130 1 1 1 1 27.8, 54.4, 87.8 24.3, 31.4, 42.2, 50.7 17.2, 22.2, 29.8, 35.8 14.0, 18.1, 24.3, 29.3 No (CM, Dt=1.3ms) 2 6 12 18 13, 90, 150 30, 50, 90, 130 30, 50, 90, 130 30, 50, 90, 130 1 1 1 1 27.8, 73, 94.3 24.3, 31.4, 42.2, 50.7 17.2, 22.2, 29.8, 35.8 14.0, 18.1, 24.3, 29.3 Values of variables used for the characterization of the boosted ihMT protocol (Fig. 1b) at constant averaged RF irradiation power, b1,rms=6.7µT. PW corresponds to the pulse length, Dt to the repetition
time of consecutive pulses, Np to the number of pulses per burst, BTR to the repetition time of consecutive
bursts and b1’ to the peak-power of the irradiation pulses. Other irradiation parameters were derived
from previous optimization of the ihMT signal in brain internal capsule using the standard ihMT experiment, Df=10kHz, and t=900ms (Prevost et al., 2017). CM stands for Cosine-Modulated pulses; Six mice were necessary to cover the 39 sets of parameters with a total number of n=3 mice per parameter set.
For each set of parameters, 20 repetitions of the (MT+, MT-, MT+-, MT-+) images were acquired and ihMT processing was realized with the methodology described in the section 2.5. IhMTR values were evaluated in ROIs manually drawn in the internal capsule (IC), cortex (Cx) and muscle (Mu) (Fig. A1) and were further reported as mean in-ROI values ± group (n=3) standard deviation.
A.3 Results
The effect of RF pulse parameters on the ihMT technique is illustrated in Fig. A.1, which shows ihMTR images acquired using the boosted ihMT protocol with different levels of RF power concentration and strength of T1D-filtering. Variation of signal intensities and contrasts between long-T1D myelinated WM and GM and shorter-T1D muscle are evidenced depending on saturation parameters. The effect of T1D-filtering can be appreciated by comparing ihMTR images obtained for identical power settings (Fig. A.1b vs Fig. A.1c): Strong ihMTR values, albeit non-uniform in all structures, were obtained in the absence of T1D-filtering (use of CM, Fig. A.1c); Use of T1D-filtering attenuated signal in short-T1D muscle, yielding ihMTR images with enhanced contrast between highly-myelinated white matter and muscle (Fig. A.1b). Reducing Np from 12 to 2 greatly increased ihMTR values in all structures when no T1D-filtering was used (Fig. A.1c versus Fig. A.1d) but, significantly reduced them when it was combined with T1D-filtering (Fig. A.1b versus Fig. A.1a).
Fig A.1. Representative boosted ihMTR brain images. IhMTR values and contrasts between structures are modulated by the combined effects of T1D-filtering and the concentration of RF power.
Arrows indicate internal capsule (IC, red), cortex (Cx, blue) and muscle (Mu, green). Highly-concentrated RF power (Np=2) resulted in reduced signal when combined with T1D-filtering (a) but in a
very large increase without T1D-filtering (d), for which highest ihMTR values were obtained in all brain
structures. This highlighted the non-equivalence of frequency-alternated pulses and cosine-modulated pulses for dual-offset irradiation. For less-concentrated RF power, T1D-filtering, (b), allowed better
contrast between highly-myelinated WM (e.g. IC) and muscle at the cost of a slight signal decrease compared to that without T1D-filtering, (c).
Figure A.2 shows boosted ihMTR values (ihMTR{boosted}) measured in internal capsule (Figs. A.2a,d,g), cortex (Figs. A.2b,e,h) and muscle (Figs. A.2c,f,i) reported as a function of RF power concentration (driven by both the values of BTR and Np) and T1D-filtering strength.
T1D-filtering {Dt=1.3 ms} No T1D-filtering {CM} Cx IC Mu 2 mm (a) (b) (c) (d) Np=2, BTR=50ms, b1’=54.4µT Np=12, BTR=90ms, b1’=29.8µT Np=2, BTR=90ms, b1’=73.0µT 0 % 30 ihMTR ihMTR 0 30 % ihMTR 0 30 % ihMTR 0 % 30
Fig A.2. Dependence of ihMTR with T1D-filtering and RF power concentration. Variations of
ihMTR values measured in Internal Capsule (IC, (a), (d), (g)), Cortex (Cx, (b), (e), (h)) and muscle (Mu, (c), (f), (i)) as a function of the T1D-filtering strength ((a-c), strong T1D -filtering, Dt=3.3ms; (d-f),
weak T1D-filtering, Dt=1.3ms; (g-i), no T1D-filtering, CM) and the RF power concentration (adjusted by
variable values of {Np, BTR}, the number of pulses per burst and the burst repetition time). ihMTR values
derived from optimized standard ihMT protocols were taken from (Prevost et al., 2017).
For long-T1D tissues, in comparison with the standard ihMT protocol, the boosted ihMT protocols provided a signal gain (higher ihMTR values) whose magnitude depended on the T1D -filtering strength: whereas the gain was very modest with strong T1D-filtering (Dt=3.3ms) (Figs. A.2a,b), the ihMTR signal measured in IC and Cx almost doubled for weak T1D-filtering
0 5 10 15 20 25 30 0 20 40 60 80 100 120 140 160 0 6 12 18 24 30 0 20 40 60 80 100 120 140 160 0 5 10 15 20 25 30 0 20 40 60 80 100 120 140 160 0 5 10 15 20 25 30 0 20 40 60 80 100 120 140 160 0 6 12 18 24 30 0 20 40 60 80 100 120 140 160 0 5 10 15 20 25 30 0 20 40 60 80 100 120 140 160 0 5 10 15 20 25 30 0 20 40 60 80 100 120 140 160 0 6 12 18 24 30 0 20 40 60 80 100 120 140 160 0 5 10 15 20 25 30 0 20 40 60 80 100 120 140 160 Standard boosted Np=6 Np=12 Np=18 standard boosted Np=6 Np=12 Np=2 standard boosted Np=6 Np=12 Np=18 standard boosted Np=6 Np=12 Np=2 standard boosted Np=6 Np=12 Np=18 standard boosted Np=6 Np=12 Np=2 Int er na lC aps ul e ( IC ) ihM T R (%) C or te x ( C x) ihM T R (%) M us cl e ( M u) ihM T R (%) BTR(ms) BBTRTR(ms)(ms) BTR(ms) BTR(ms) BTR(ms) BTR(ms) BTR(ms) BTR(ms) BTR(ms)
Strong T1D-filtering {Dt=3.3ms} Weak T1D-filtering {Dt=1.3ms} No T1D-filtering {CM}
(a) (d) (g) (b) (e) (h) (c) (f) (i) Standard boosted Np=6 Np=12 Np=18 standard boosted Np=6 Np=12 Np=18 standard boosted Np=6 Np=12 Np=18
(Dt=1.3ms) (Figs. A.2d,e) and quadrupled without T1D-filtering (Figs. A.2g,h), as compared to
standard protocols. Very long BTR values (BTR ³130ms) were inefficient as indicated by the onset of decrease of ihMTR{boosted} values. RF power concentration from 12 to 2 pulses was inefficient when T1D-filtering was used, leading to decreased ihMTRs.
Boosted ihMT protocols using Np=12 and BTR=90ms yielded high signal difference between myelin-rich structures and others for all T1D-filtering conditions and were hence chosen for the validation experiment (table 2).
ihMT signal enhancement in short T1D-structures
The three to eight-fold (without T1D-filtering) ihMTR signal increase obtained for muscle tissue, emphasized the stronger signal enhancement of short-T1D tissues using boosted ihMT protocols. This effect can be explained by the mechanisms underlying the creation of the ihMT signal, which relies on the influence of dipolar order on RF saturation effects. Exchange of magnetization between Zeeman and dipolar order reservoirs of the bound pool during single-frequency offset irradiation is mediated by the competitive effects of RF power (𝑅_7` ∝ 𝑏cd)
and dipolar order relaxation (𝑇ce) (Eq. 2 of (Varma et al., 2015b), such that, if dipolar relaxation is too fast, the dipolar order magnetization will remain negligible with no net effect on the RF saturation of the Zeeman magnetization. In this case, the effects of single-frequency offset and dual-frequency offset irradiations would be similar (Eq. 2 tending toward Eq. 3 in (Varma et al., 2015b)), hence resulting in no ihMT effect. A necessary condition for an observable ihMT effect was proposed and formulated by the coarse rule, 𝑅_7`𝑇ce > 0.01 (Manning et al., 2016). The b1 values of RF pulses in standard ihMT protocols made the previous inequality barely met in short-T1D muscle, hence resulting in reduced ihMTR values. Conversely, concentrating RF pulses at constant average b1,rms such as done in boosted ihMT protocols, naturally resulted in pronounced increase of pulse power 𝑏cg, thus making the previous inequality met for a broader
range of T1D values, hence revealing ihMT signal from short T1D components. This mechanism likely explains the very large increase of ihMTR in muscle observed, for instance, with boosted ihMT protocols and no T1D-filtering (Fig. A.1c).
Non-equivalence of cosine-modulated pulses and frequency-alternated pulses for dual-offset irradiation
The general variations of boosted ihMTR values with {Np, BTR} shown on Fig. A.2 are in agreement with previous experimental results obtained in humans with a 3D steady-state GE sequence and frequency-alternating RF pulses (Mchinda et al., 2017) and with a 2D ihMT prepared sequence with CM RF pulses for dual frequency irradiation (Varma et al., 2018), and are furthermore well supported by the theoretical ihMT model illustrated by numerical simulations (Fig. A.3).
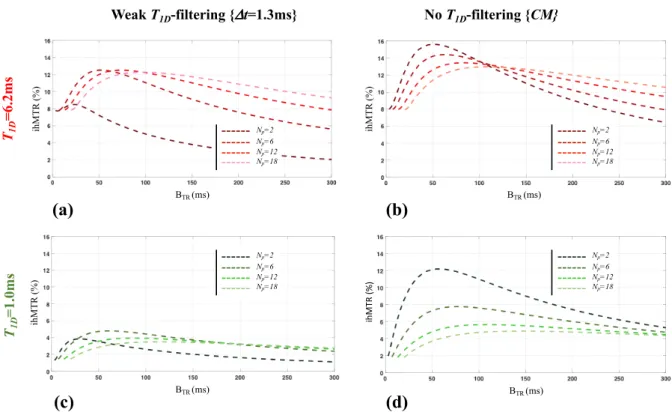
Fig A.3. Numerical simulations of the dependence of ihMTR with RF power concentration with and without T1D-filtering. A piecewise numerical integration of the ihMT theory (Mchinda et al., 2017;
Weak T1D-filtering {Dt=1.3ms} No T1D-filtering {CM}
T1D = 6.2m s BTR (ms) ihM T R (%) BTR (ms) ihM T R (%) Np=6 Np=12 Np=18 Np=2 Np=6 Np=12 Np=18 Np=2 T1D = 1.0m s BTR (ms) ihM T R (%) BTR (ms) ih M TR (% ) Np=6 Np=12 Np=18 Np=2 Np=6 Np=12 Np=18 Np=2 (a) (b) (d) (c)
Varma et al., 2015b) was implemented using a MATLAB solver (ode45) and the methodology described in (Mchinda et al., 2017) adapted to the ihMT-prepared boosted sequence (i.e. simulating the boosted ihMT RARE sequence used experimentally) instead of an ihMT-steady-state boosted sequence (i.e. simulating the boosted ihMT-GRE sequence). Simulations considered the following tissue parameters, adapted from literature (Mchinda et al., 2017):
𝑇ch = 0.65𝑠, 𝑅 = 65s-1, 𝑓 = 0.65 , 𝑇
d` = 12.5 µs, 1 (𝑅⁄ ch𝑇dh) =581 , 𝑅𝑀[`⁄𝑅ch=7.3
Simulations are shown for T1D values of 6.2ms (mimicking Internal capsule case) (a,b) and 1.0ms (mimicking muscle) (c,d) with weak T1D-filtering (a,c) and without T1D-filtering (b,d). RF power
concentration was varied with changes in {Np, BTR} values.
This includes: a rapid increase to a maximum, followed by a relatively slower decrease at long BTR values; a higher absolute increase for cosine-modulated based experiments for both long and short T1Ds tissues; for short T1Ds tissues, a higher relative increase between standard ihMT and boosted ihMT; and finally, when reducing Np from 12 to 2, a different variation of ihMTR whether T1D-filtering was used (large decrease, Fig. A.2d and Fig. A.3a), or not (large increase, Figs. A.2g, Fig. A.3b). These opposed variations are important features of boosted ihMT protocols performed at high irradiation power, and confirm the major difference between the sequential frequency-alternated pulses and simultaneous cosine-modulated pulses used for the dual-frequency offset irradiation, consistent with previous theoretical predictions (See Fig. 7 of (Mchinda et al., 2017)). The variable efficiency of both approaches for eliminating dipolar order is responsible for this difference as demonstrated by MT simulations (Fig. A.4).