Convective Transport of Macromolecules in Gels
byScott Travis Johnston
M.S. Chemical Engineering Practice
Massachusetts Institute of Technology, 1995 B.S. Chemical Engineering
Carnegie Mellon University, 1993
Submitted to the Department of Chemical Engineering in partial fulfillment of the requirements for the degree of
Doctor of Philosophy at the
MASSACHUSETTS INSTITUTE OF TECHNOLOGY
September, 1999
D Massachusetts Institute of Technology 1999. All rights reserved.
Signature of Author
Departmentiof Chemical Engineering July 27, 1999
Certified by
William M. Deen Carbon P. Dubbs Professor of Chemical Engineering Thesis Supervisor
Accepted by
-Robert E. Cohen St. Laurent Professor of Chemical Engineering Chairman, Committee for Graduate Students
MASSACHUSET NTITUTE
Convective Transport of Macromolecules in Gels
byScott Travis Johnston
Submitted to the Department of Chemical Engineering on July 27, 1999 in partial fulfillment of the
requirements for the degree of Doctor of Philosophy
ABSTRACT
In porous or fibrous materials where the pore diameter or interfiber spacing is comparable to the dimensions of a protein or other macromolecule, the rates of diffusion or convection of the macromolecule tend to be lower than in bulk solution. This phenomenon, termed "hindered transport," is explained in large part by a combination of steric and hydrodynamic interactions between the permeating molecule and the medium. The primary goal of this thesis was to examine the hindered convection of macromolecules in fibrous gels. This was done by measuring the sieving coefficient (0, the ratio of filtrate to retentate concentration) of globular proteins and Ficoll, a crosslinked copolymer of sucrose and epichlorohydrin (Stokes-Einstein radius, r, = 2.5 -7.0
nm), in agarose membranes as a function of protein size and gel concentration. The proteins used were lactalbumin (r, = 2.1 nm), ovalbumin (rs = 3.0 nm), bovine serum albumin (BSA) (rs = 3.6
nm), and bovine immunoglobulin G (IgG) (r, = 5.2 nm). The volume fraction of agarose (4) was varied from 0.04 to 0.08. Agarose membranes were prepared on polyester mesh supports and
studied in a stirred ultrafiltration cell, and the Darcy permeabilities of the gels were determined in addition to 0. The values of & decreased with increasing r, or
4,
as expected. From themeasurements of 0 and estimates of the protein diffusivity and equilibrium partition coefficient, the convective hindrance factor (K,) was calculated for each protein-gel combination. This is the ratio of the average solute velocity (in the absence of diffusion) to the superficial fluid velocity. For the smallest value of
4
(0.04), it was found that K, exceeded unity for all macromolecules studied. At this gel concentration, K, increased with increasing solute size up to approximately 1.5 for thelargest Ficoll. For larger values of
4,
it was found that K, decreased with increasing solute size. In these gels, K, exceeded unity for smaller solutes, whereas K, < 1 at larger values of rs. At anintermediate 0 (0.06), K, for the largest Ficoll remained close to unity (0.94). For the most concentrated gels (0 = 0.08), K, for this Ficoll decreased to approximately 0.5. The observed
experimental behavior for K, was qualitatively, but not quantitatively, consistent with predictions from existing hindered transport theories for media consisting of parallel fibers or straight pores. Given evidence from previous partitioning and diffusion data that an agarose gel is better
represented as a randomly oriented array of fibers, the quantitative discrepancies between the data and models are not entirely surprising. Thus, the present results suggest that there is a need to extend theories of hindered convection to random arrays of fibers.
In order to correctly interpret the experimental results, the measured sieving coefficients were corrected for the effect of concentration polarization. A model was developed using laminar boundary layer theory to quantify concentration polarization in ultrafiltration systems in which the membrane forms the base of a stirred, cylindrical container. The flow was approximated as a rigid-body rotation above a stationary surface (B6dewadt flow), with a filtration velocity that depended on the osmotic pressure of the retained solute, and therefore varied with radial position on the surface. Because the analysis was limited to moderate solute concentrations and filtrate
velocities, physical properties were assumed to be constant. Attention was restricted to large Reynolds and Schmidt numbers, so it was permissible to neglect radial diffusion and to use an analytical approximation for the velocity field. The axisymmetric convective-diffusion problem was solved using a finite difference method. One set of simulations focused on the osmotic reduction in filtration rate caused by a completely retained solute. The boundary layer results were compared with predictions based on a commonly used stagnant film model, and it was found that the latter consistently underestimated the reduction in filtration rate, although the discrepancies were no more than 21%. A comparison was also made with a "hybrid" model in which stagnant film theory was assumed to be valid locally and local mass transfer coefficients were calculated by the laminar boundary layer model. The hybrid model also underestimated the reduction in the filtration rate; however, discrepancies were no more than 15%. A second set of simulations concerned the effects of polarization on apparent sieving coefficients for permeable solutes. (The apparent sieving coefficient is the filtrate concentration divided by that in the bulk retentate,
whereas the true sieving coefficient for the membrane is the filtrate concentration divided by that at the membrane surface.) A comparison of the boundary layer and stagnant film results showed that the latter consistently underestimated the effects of polarization on sieving. The magnitude of the
discrepancy in the predicted ratio of true to observed sieving coefficient increased with increasing dimensionless filtration rate and with decreasing sieving coefficient, and was as much as 78% for the conditions considered. Thus, the stagnant film approach was found to be much less
satisfactory for correcting sieving coefficients than for predicting mean filtrate velocities. It was found that the hybrid model performed considerably better than the stagnant film model in estimating the effect of polarization on sieving, especially at very small values of 0. For the hybrid model, the maximum deviation from the boundary layer results was only 15%. The predictive capability of the boundary layer model was tested using filtration data with BSA in two commercial ultrafiltration cells. The agreement was found to be excellent, provided that an appropriate value was selected for the angular velocity of the bulk fluid.
Thesis Supervisor: William M. Deen
ACKNOWLEDGEMENTS
I would like to thank my thesis advisor, Professor William Deen, for his guidance and
support throughout the course of this work. His deep understanding of transport phenomena and his thoroughness have kept me honest and taught me much. Thanks are also due to the other members of my thesis committee, Professors Kenneth Smith and Alan Grodzinsky, for their encouragement and their constructive comments regarding the direction of my research.
I would also like to thank the other members, past and present, of my research group:
Randy Lewis, Erin Johnson, Aurelie Edwards, Glen Bolton, Manish Keshive, Jeff White, Pat Gwynne, Bo Chen, Stephanie Stine, and Matt Lazzara. The many conversations, brain-storming sessions, and laughs we shared made my stay at MIT an enjoyable one and helped me maintain my perspective and my sanity.
Special thanks go to Bill and Tonya Grieco, great friends that over the past five years have become more like extended family. I believe it is no mistake that we will soon be neighbors again
in Pennsylvania -it seems that life has a way of keeping those closest to you nearby.
All of this would not have been possible without the love and support of my parents. Mom
and Dad, you have always done whatever you could to provide me with every opportunity possible. I have strived to live my entire life by your example.
Finally, my deepest appreciation goes to my wife Jolene. Thank you for always being there for me -you are truly my best friend in the world. Your encouragement and love has shown me that in our life together anything is possible. I look forward to spending the rest of my years as I have spent the last ten - sharing my greatest triumphs, worst defeats, and everything in between
TABLE OF CONTENTS
Chapter 1: Background ... 11
1.1 Introduction ... ... 11
1.2 Darcy Permeability of Fibrous Media... 12
1.3 Hindered Transport Theory ... 14
1.3.1 Overview ... 14
1.3.2 Porous M edia ... 16
1.3.3 Fibrous Media ... 21
1.4 Summary of Thesis Work ... 22
Chapter 2:Experimental Determination of Convective...
26
Hindrances in Gels
2.1 Introduction ... 262.2 Methods ... 26
2.2.1 Macromolecules ... 26
2.2.2 Gel Membranes... 27
2.2.3 Darcy Permeability Measurements ... 29
2.2.4 Sieving Measurements... 31
2.3 Results and Discussion ... 38
2.3.1 Darcy Permeability ... 38
2.3.2 Sieving Coefficient... 42
2.3.3 Convective Hindrance Coefficient ... 45
2.4 C onclusions ... 64
Chapter 3: Concentration Polarization in Stirred ...
65
Ultrafiltration Cells
3.1 Introduction ... 653.2 Model Development... 68
3.2.2 Pressure Field... 70
3.2.3 V elocity Field ... 71
3.2.4 Concentration Field ... 74
3.2.5 Similarity Solution Near Membrane Outer Edge ... 77
3.2.6 N um erical Solution... 79
3.3 Results and D iscussion ... 80
3.3.1 Mass Transfer Coefficient... 80
3.3.2 Concentration Field ... 85
3.3.3 Effect of Polarization on Filtration Rate ... 89
3.3.4 Effect of Polarization on Sieving ... 93
3.3.5 Comparison with Experimental Data... 96
3 .4 C onclusions ... 103
A
ppendices
... 105A FIDAP Code: Determination of the Polyester Mesh... 105
Correction Factor B FORTRAN Code: Laminar Boundary Layer Model for Concentration ... 126
Polarization in Stirred Ultrafiltration Cells Bibliography...141
LIST OF FIGURES
Figure 1.1 Results of Deen (1987) for W = OK, and H = IKd ...
in cylindrical pores as functions of A = r/rp. The solid and dotted
lines are coefficients governing convection and diffusion, respectively. Figure 1.2
17
Results for hindered transport coefficients Kd and K, in cylindrical ... 18 pores as functions of A = rs/r. Curves were obtained by dividing
the results of Deen (1987) (Figure 1.1) by Eq. 1-11. The solid and dotted lines are coefficients governing convection and diffusion, respectively.
Figure 1.3 Filtration and osmotic reflection coefficients for membranes ... 20 consisting of long, cylindrical pores. Values for caf were calculated
by using the result for W (Figure 1.1) in Eq. 1-10. Values for a,
were calculated from Eq. 1-13.
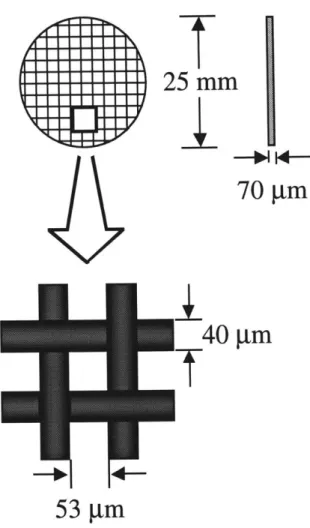
Figure 2.1 Dimensions of polyester mesh support for agarose membranes. ... 28 Figure 2.2
Figure 2.3
Model idealization of polyester mesh. ... 30 Example chromatograms from a Ficoll sieving experiment with a ... 33
6% agarose gel. Plotted is the fluorescence intensity in arbitrary units
as a function of elution time in minutes.
Figure 2.4 Example chromatograms from a Ficoll sieving experiment with a ... 34
6% agarose gel. Plotted is the fluorescence intensity in arbitrary units
as a function of Ficoll Stokes-Einstein radius (nm). Figure 2.5
Figure 2.6
Figure 2.7
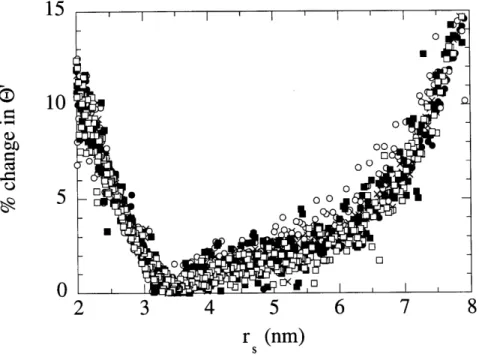
The percentage change in measured sieving coefficient caused by ... 36 shifting experimental results by the uncertainty in the pump flow
rate for all Ficoll experiments with 6% agarose gels. Results are plotted as a function of Ficoll molecular size.
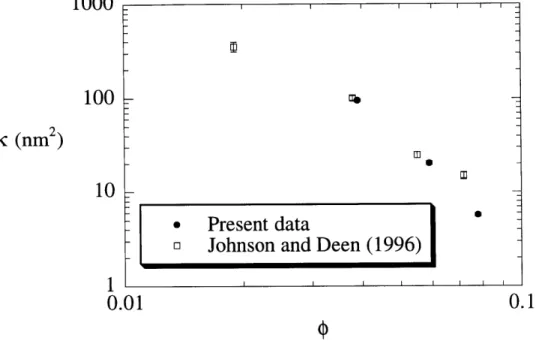
Darcy permeability of agarose gels, K, as a function of the volume... 40 fraction of fibers, 0. Symbols show the mean ± SE (n = 5 for the
data of Johnson and Deen, for present data n = 25 for 6% and 8% gels,
n = 23 for 4% gels).
Darcy permeability of agarose gels, &, as a function of the applied... 41 transmembrane pressure, AP. Open symbols represent 4% gels,
gray symbols are 6% gels, and black symbols are 8% gels.
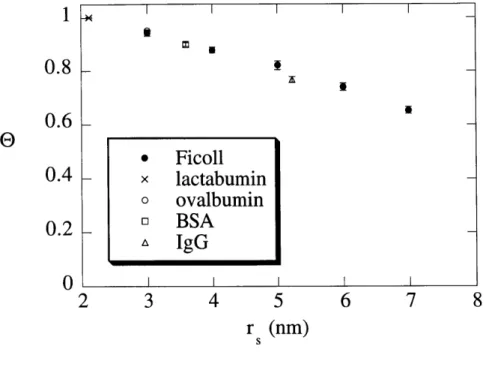
Figure 2.8 True sieving coefficients, e, for solutes as a function of the solute ... 46 size, rs, in 4% agarose gels. Symbols show the mean ± SE (n = 5,
except for lactalbumin, where n = 3).
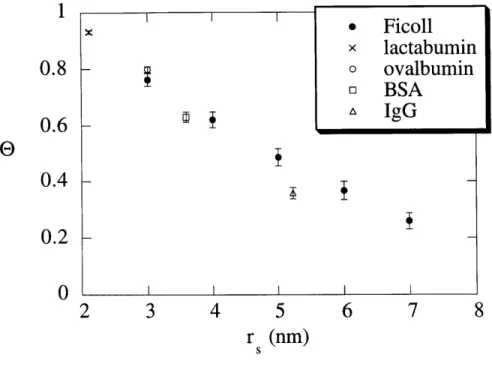
Figure 2.9 True sieving coefficients, 1, for solutes as a function of the solute ... 47 size, rs, in 6% agarose gels. Symbols show the mean ± SE (n = 5).
Figure 2.10 Figure 2.11 Figure 2.12 Figure 2.13 Figure 2.14 Figure 2.15 Figure 2.16 Figure 2.17 Figure 2.18
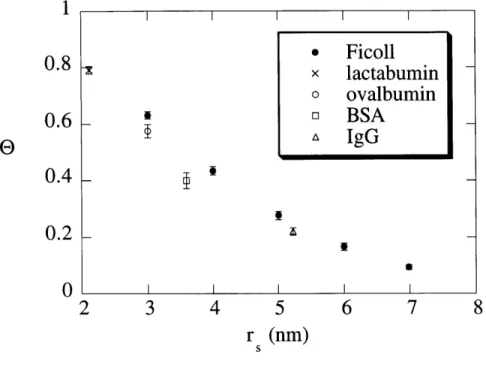
True sieving coefficients, e, for solutes as a function of the solute ... 48 size, rs, in 8% agarose gels. Symbols show the mean ± SE (n = 5).
Values of the convective hindrance coefficient, Kc, for solutes as a ... 53 function of molecular size, rs, in 4% agarose gels. The dotted line is the
result of the Phillips et al. (1990) theory for parallel arrays of fibers.
Values of the convective hindrance coefficient, Ke, for solutes as a ... 54 function of molecular size, rs, in 6% agarose gels. The dotted line is the
result of the Phillips et al. (1990) theory for parallel arrays of fibers.
Values of the convective hindrance coefficient, Kc, for solutes as a ... 55 function of molecular size, rs, in 8% agarose gels. The dotted line is the
result of the Phillips et al. (1990) theory for parallel arrays of fibers.
Values of the convective hindrance coefficient, Kc, for proteins as a ... 57 function of the agarose Darcy permeability, ic.
Values of the filtration reflection coefficient, Uf, for solutes as a ... 59 function of the partition coefficient, 0 in 4% agarose membranes.
The solid line is the theoretical expression developed by Anderson and Malone (1974) (Eq. 1-13).
Values of the filtration reflection coefficient, Uf, for solutes as a ... 60
function of the partition coefficient, P in 6% agarose membranes. The solid line is the theoretical expression developed by Anderson and Malone (1974) (Eq. 1-13).
Values of the filtration reflection coefficient, cf, for solutes as a ... 61 function of the partition coefficient, 0 in 8% agarose membranes.
The solid line is the theoretical expression developed by Anderson and Malone (1974) (Eq. 1-13).
The sieving coefficient in the limit of infinite membrane Peclet ... 63 number (1-Uf) for solutes in agarose gels. The solid line is the
fit of the present data (Eq. 2-12). The dotted line is the empirical correlation of Kapur et al. (1997) (Eq. 2-11).
Figure 3.1 The flow in a typical stirred ultrafiltration cell (panel a) is modeled... 69
as a semi-infinite fluid rotating above a surface (panel b). The membrane radius is R. The angular velocity of the stirrer (o)) differs from that of the bulk fluid in the model (o).
Figure 3.2 Dimensionless mass transfer coefficient as a function of radial ... 81
position for the constant concentration boundary condition (Eq. 3-36). Results from the boundary layer model are shown along with the results of Smith and Colton (1972). The curve labeled "similarity" was calculated from Eq. 3-37.
Figure 3.3 Dimensionless mass transfer coefficient as a function of radial ... 83 position for the constant flux boundary condition (Eq. 3-33).
Results from the boundary layer model are shown for several values of the dimensionless filtration rate (a). The curve labeled "similarity" was calculated from Eq. 3-35.
Figure 3.4 Dimensionless mass transfer coefficient as a function of radial ... 86 position for the constant concentration boundary condition (Eq. 3-36).
The curve labeled "numerical" is the result of the boundary layer model (Figure 3.2). The curve labeled "fitted" is given by Eq. 3-48.
Figure 3.5
Figure 3.6 Figure 3.7
Figure 3.8
Dimensionless mass transfer coefficient as a function of radial ... 87 position for the constant flux boundary condition (Eq. 3-33). The
curve labeled "numerical" is the result of the boundary layer model for a --> 0 (Figure 3.3). The curve labeled "fitted" is given by Eq. 3-49.
Contours of constant concentration computed for ao = 1 and
#=0.5.
... 88 Ratio of average filtration rate to that in the absence of concentration... 91 polarization, as a function of the dimensionless filtration rate withoutpolarization (ao), for the boundary layer, stagnant film, and hybrid models. The results are for an ideal semipermeable membrane.
Ratio of actual sieving coefficient (0) to apparent sieving coefficient ... 94
(1') as a function of dimensionless filtration rate (a), for the boundary
layer, stagnant film, and hybrid models. The effects of osmotic pressure were neglected (P = 0).
Figure 3.9 Scale drawings of the Amicon stirred cells used in the filtration... 97 experiments with BSA. The fluid levels indicated correspond to the
nominal capacities. The values of R and the impeller-membrane separation were 1.05 and 0.14 -0.18 cm, respectively, for the
10 ml cell, and 0.6 and 0.10 cm, respectively, for the 3 ml cell.
Figure 3.10 Figure 3.11
Figure 3.12
Experimental values of the stagnant film mass transfer coefficient,... 99
ksf, as a function of filtration velocity, vf, for BSA.
Comparison of average filtration rates predicted by the boundary... 101 layer model with those measured in the 10 ml cell. Predictions are
shown for three assumed values of y= Oo's; the best-fit value was y= 0.36.
Comparison of average filtration rates predicted by the boundary... 102 layer model with those measured in the 3 ml cell. Predictions are
shown for three assumed values of y= Ows; the best-fit value was y= 0.87.
LIST OF TABLES
Table 2.1 Darcy permeabilities of agarose gels. Values are given as mean ... 39
± SE for 25 measurements, except for those marked with * (n = 23).
Table 2.2 Sieving coefficient results for proteins. Sieving coefficients are ... 43 given as mean ± SE for 5 measurements, except for * (n = 3).
Table 2.3 Sieving coefficient results for selected Ficolls. Sieving coefficients ... 44 are given as mean ± SE for 5 measurements.
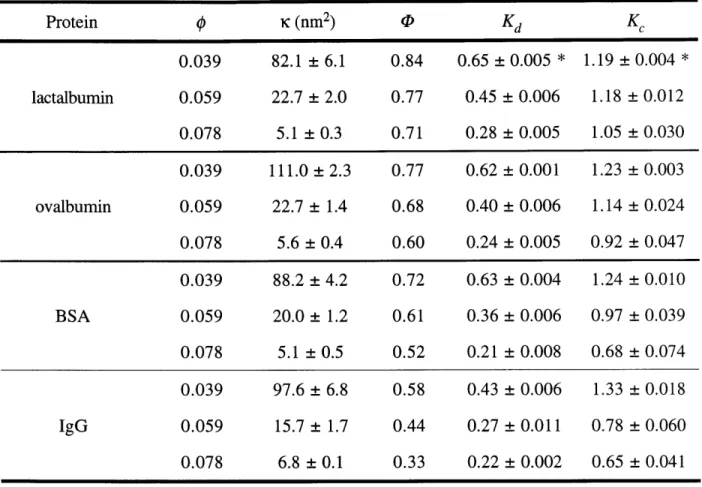
Table 2.4 Partition and hindrance coefficients for proteins. Hindrance ... 50 coefficients are given as mean ± SE for 5 measurements, except
for those marked with * (n = 3).
Table 2.5 Partition and hindrance coefficients for selected Ficolls. Hindrance ... 51 coefficients are given as mean ± SE for 5 measurements.
CHAPTER 1
Background
1.1
Introduction
Hydrogels enjoy many uses in chemical and biomedical research. Techniques such as liquid chromatography and electrophoresis rely on the use of gels as media, and therapeutic devices such as contact lenses and certain implantable drug delivery devices are composed of gels.
Additionally, some body tissues display structures which are remarkably similar to hydrogels. A particularly interesting example is the glomerular basement membrane (GBM). The GBM is the
most significant continuous barrier to the ultrafiltration of blood plasma across the glomerular capillary walls of the kidney, the first step in the formation of urine. The GBM is a fibrous structure consisting primarily of Type IV collagen and glycoprotein (Brenner and Rector, 1981). Robinson and Walton (1987) have suggested that because of its structure, the GBM can be accurately modeled as a random fiber matrix gel.
This widespread utilization of fibrous hydrogels makes it important to understand the transport of proteins and other macromolecules through these materials. Such an understanding would enable the rational design of synthetic media for chromatographic or membrane separations. An understanding of the transport of nutrients through synthetic gels would aid in the design of drug delivery devices in which gels are used to encapsulate cells that produce therapeutic agents (which must in turn be transported out of the gel). The development of an understanding of the transport of proteins and other macromolecules across barriers such as the GBM is an important step in understanding glomerular ultrafiltration and the failures in ultrafiltration associated with disease.
1.2
Darcy Permeability of Fibrous Media
An important part of evaluating hindered transport of solutes in fibrous gels is the understanding of low Reynolds number flow through such media. Experiments and theories related to Stokes flow through fibrous media have been summarized by Jackson and James (1986). The authors compared experimental data for a wide variety of media ranging from stainless steel wire crimps to collagen and solutions of hyaluronic acid. They found that the results for different media collapsed reasonably well if the appropriate dimensionless variables are employed, namely $
(the volume fraction of fibers) and the dimensionless permeability lir2 where rf is the fiber radius and K is the Darcy permeability. Darcy's Law is stated as
v=- VP (1-1)
where v is the fluid velocity, y is the viscosity, and P is pressure.
Theories discussed in this summary involved solving Stokes' equation inside of a unit cell with zero velocity at a rod surface and zero velocity gradient at the edge of the cell. These theories were divided into three categories:
i.) flow parallel to an array of parallel rods ii.) flow normal to an array of parallel rods iii.) flow through three-dimensional arrays
The first group of theories were found to overpredict experimental permeabilities. The authors noted that such a result is to be expected since fibers randomly oriented across the flow would offer more resistance in experiments. The second group of theories were found to predict
permeabilities that were roughly half as large as those predicted by considering flow parallel to an array of parallel rods.
The final group of theories consisted of two expressions, the first of which was derived by Spielman and Goren (1968) by modeling flow through fibrous media as the flow around a single
circular cylinder surrounded by an infinite homogeneous porous medium (a technique now referred to generally as "swarm" theory). Their expression for a three-dimensional array (for 0 < 0.75) was
1 1 +5 _ K_ r / (1-2)
40 3 6 rf KO(rf/61)
where Ko and K, are modified Bessel functions of the second kind. The second expression was derived by Jackson and James (1982) using a cubical lattice model. In this work, it was argued that the permeability of a random media is equivalent to the permeability of a cubical lattice formed of the same material. Their expression was derived by adding the resistances of rods aligned both
with and across the flow, calculated using the model of Drummond and Tahir (1984) for flow normal to a square array of cylinders. It took the form:
C= -[ln -0.931+ O(In#) (1-3)
rf 20 0
The authors noted that the two models (Eqs. 1-2 and 1-3) agreed reasonably well with each other and with the experimental data obtained.
Noticeably missing from the experimental data collected by Jackson and James are data for high porosity hydrogels. Our laboratory provided the first experimental values for the permeability of agarose gels (Johnson and Deen, 1996). In these experiments, thin gel membranes were cast onto a rectangular polyester mesh approximately 70 gm thick in order to give them enough rigidity to withstand significant pressure drops. Using a commercial ultrafiltration cell, the permeabilities of gels ranging in concentration from 2% to 8% were measured. It was found that Eq. 1-3
significantly underpredicted the Darcy permeabilities of agarose gels, especially at lower values of
0,.
media were calculated numerically by Clague and Phillips (1997). The authors calculated the hydrodynamic interactions between fibers by applying a numerical version of slender body theory to a collection of fibers in a cubic cell. Their model provided predictions for the Darcy
permeabilities of agarose that were higher than those obtained with Eq. 1-3. However, the numerical estimates for the permeabilities were still smaller than the experimental values of Johnson and Deen (1996), especially at lower gel concentrations.
1.3 Hindered Transport Theory
1.3.1 Overview
In porous or fibrous materials where the pore diameter or interfiber spacing is comparable to the dimensions of a protein or other macromolecule, the rates of diffusion or convection of the macromolecule tend to be lower than in bulk solution. This phenomenon, termed "hindered transport," is explained in large part by a combination of steric and hydrodynamic interactions between the permeating molecule and the medium (Deen, 1987). The local flux of solute through an isotropic medium (or through a medium in which fluxes are one-dimensional) can be written as
N = -KdD.VC + KevC (1-4)
where C is the macromolecule concentration averaged over a volume that is small compared to the dimensions of the medium but large compared to the pore diameter or interfiber spacing, D, is the free-solution diffusivity, and v is the superficial fluid velocity. The dimensionless coefficients Kd and K, describe hindrances to diffusion and convection, respectively. The diffusive hindrance coefficient equals D/D., where D is the apparent diffusivity within the porous or fibrous material. The convective hindrance coefficient may be interpreted as the ratio of the average solute velocity
For the case of one-dimensional transport across a membrane of thickness L, the macroscopic flux equation can be obtained by integrating Eq. 1-4 over the membrane thickness subject to boundary conditions at the surfaces. These boundary conditions are established by the external solute concentrations:
CO = C = (1-5)
CO C'I
where primes denote external solute concentrations and P is the equilibrium partition coefficient. The resulting expression is
[1
- (C'/C)e (1-6)N =WvC' [1-ePe
Pe = WvL (1-7)
HD.
where H = cPKd, W = PK,, and Pe is the membrane Peclet number. The limiting forms of Eq. 1-6 for the extremes of the PNclet number are:
N =
(CO'
- C') (Pe <<1) (1-8)L
N = WvCO' (Pe >> 1) (1-9)
The coefficients P, Kd, and K, are functions of solute size and charge, as well as the properties of the stationary medium. These coefficients are often expressed in terms of the "solute
a- = lim (1 - 9)=1- W (1-10)
Pe-+o
where 0 is the sieving coefficient (see Section 1.4 below). The filtration reflection coefficient can be interpreted as the fraction of solute "reflected" or rejected by the membrane when convection is
dominant (Pe -* oo).
1.3.2 Porous Media
The objective of research in hindered transport is to establish the relationships between the structural properties and the transport coefficients. Much of this research has focused on
theoretical or experimental models for transport through arrays of straight pores of regular cross section. The hydrodynamic theory for hindered transport is well developed for such situations, especially for spherical macromolecules in long, cylindrical pores (Deen, 1987). One example of such a theory which is applicable to the entire range of 0 ; A < 1, where A is the ratio of the solute
radius to the pore radius, is based on the hydrodynamic results of Bungay and Brenner (1973). These authors used singular perturbation techniques to solve the problem of flow around a sphere positioned eccentrically in a long cylindrical tube. The authors obtained asymptotic expansions for the torque, hydrodynamic force, and pressure drop for flow past a stationary sphere as well as for a sphere translating or rotating in a quiescent fluid. Using the results provided by these authors for the force on a sphere placed on the centerline of the tube, expressions for the coefficients H and W can be obtained (Deen, 1987). These results are shown in Figure 1.1. From these results the coefficients Kd and K, are obtained by dividing H and W by 0, which in the case of cylindrical pores can be evaluated from geometry:
1= (1) A)2
1
0.8
0.6
0.4 0.20
0
FIGURE 1.1: 0.20.4
k
0.6
0.8
1
Results of Deen (1987) for W = OK, and H = PKd in cylindrical pores as functions of A = r/rp. The solid and dotted lines are coefficients governing convection and diffusion, respectively.
1.5
1
0.5
00
FIGURE 1.2: 0.2 0.4x
0.6
0.8
1
Results for hindered transport coefficients Kd and K, in cylindrical pores as
functions of X = r/rP. Curves were obtained by dividing the results of Deen (1987) (Figure 1.1) by Eq. 1-11. The solid and dotted lines are coefficients governing convection and diffusion, respectively.
K
d
a solute is always hindered (Kd < 1) due to hydrodynamic interactions between the solute and the pore wall. However, the convective hindrance coefficient, K,, is always greater than one. This is due to steric interactions which prevent the solute from sampling the regions of lowest fluid velocity near the pore walls.
The filtration reflection coefficient, o, for cylindrical pores can be evaluated by using the result for W (Figure 1.1) in Eq. 1-10. The result is shown graphically in Figure 1.3, where Ojris plotted as a function of A. Also shown in this figure is the Anderson and Malone (1974) result for
the osmotic reflection coefficient, o,, for cylindrical pores. This reflection coefficient describes the reduction in the osmotic contribution to flow across a membrane separating two solutions of
different concentration caused by only partial exclusion of solute by the membrane. The volume flux, J,, across such a "leaky" membrane is given by
J, = LP(AP. - cAJ) (1-12)
where L is the hydraulic permeability of the membrane, P and H are pressure and osmotic pressure, respectively, and the subscript oo denotes bulk solution conditions on each side of the
membrane. Anderson and Malone (1974) found that for the case of rigid, spherical molecules and a membrane consisting of long, cylindrical pores
CO = (1- _ )2 (1-13)
Anderson (1981) found that for such a system Eq. 1-13 provided a good approximation for the filtration reflection coefficient as well. As can be seen in Figure 1.3, the two expressions (Eqs.
1
0.8
0.6
0.4
0.2
0
0
FIGURE 1.3:0.2
0.4x
0.6
0.81
Filtration and osmotic reflection coefficients for membranes consisting of long, cylindrical pores. Values for afwere calculated by using the result for
W (Figure 1.1) in Eq. 1-10. Values for a, were calculated from Eq. 1-13. ,
1.3.3 Fibrous Media
Although hydrodynamic theory developed for straight, cylindrical pores has been successful in many cases in correlating transport data in membranes, this theory provides little insight into the structure-function relationships for fibrous materials, such as crosslinked, polymeric gels. As stated in Section 1.1, hydrogels are widely used in chromatographic
separations and in therapeutic devices, and a number of body tissues (e.g., capillary basement membranes) have gel-like properties. Thus, there is ample motivation to develop a better understanding of hindered transport in gels.
Ogston (1958) was among the first to suggest that a solution of linear polymers, or the polymeric component of a gel, might be represented as a randomly oriented array of straight cylindrical fibers. The parameters which characterize the fiber array in this model are the fiber radius, r. and the volume fraction of fibers,
4.
This concept is the basis for much of the theoretical work on hindered transport in gels, which has focused mainly on equilibriumpartitioning and diffusion. Ogston (1958) predicted partition coefficients for macromolecules in fiber arrays by determining probability distributions of interfiber spacings. His result is given by
0 = exp[-O(1 + A)] exp(-f) (1-14)
where for the case of fibrous media A = r/jr, Stochastic-jump arguments were used later to derive an expression for the diffusivity within a fibrous medium (Ogston et al., 1973). These and other results was adapted by Curry and co-workers for the modeling of microvascular permeability properties (Curry and Michel, 1980; Curry, 1984). The diffusion theory of Ogston does not include solute-fiber hydrodynamic interactions, which will reduce the mobility of a permeating macromolecule. Hydrodynamic interactions were considered by Phillips et al. (1989; 1990), who used Stokesian dynamics and generalized Taylor dispersion theory to compute the apparent
cylinders. Those authors proposed that diffusivities could be estimated for other fiber
arrangements by treating the fiber array as a homogeneous medium characterized by its Darcy permeability, K. An extension of that idea to account for steric restrictions was described by
Johnson et al. (1996). Their expression for Kd took the form:
Kd = F(r/ F) (1-15)
where F describes the effect of hydrodynamic interactions and S is a steric or tortuosity factor (see Section 2.3.3). Clague and Phillips (1996) calculated hydrodynamic interactions for the case of a spherical solute moving through a random array of cylinders by representing the sphere as a collection of point singularities and accounting for the fibers using a numerical version of slender-body theory. There are as yet no theoretical results for convection of macromolecules through random arrays of fibers.
Several methods have been used to measure hindered diffusivities of proteins and other macromolecules in polymer solutions and gels. Recent work has taken advantage of such
techniques as pulsed-field-gradient NMR (Gibbs et al., 1992), holographic interferometry (Kosar and Phillips, 1995), and fluorescence recovery after photobleaching (FRAP) (Johnson et al., 1995;
1996). In contrast, very little is known about convective hindrance factors. In what appears to be
the only relevant study to date, Kapur et al. (1997) studied diffusive and convective transport of two proteins, ribonuclease A and bovine serum albumin (BSA) through poly(vinylidine fluoride) membranes whose pores were filled with polyacrylamide gel.
1.4
Summary of Thesis Work
The primary purpose of this thesis work was to provide experimental values of Kc as a function of solute size and gel concentration. To complement previous results for Kd from our laboratory (Johnson et al., 1995; 1996), globular proteins and Ficoll, a crosslinked copolymer of
sucrose and epichlorohydrin, were employed with agarose gels. The advantage of agarose, beyond its ready availability, is that it possesses fibers (consisting of aggregates of x-helical polysaccharide chains) that exhibit undetectable Brownian motion (Mackie et al., 1978) and have
little net charge. Thus, agarose gels appear to approximate the structural assumptions of the aforementioned fiber-matrix theories. Values of K, were determined experimentally by measuring the sieving coefficients (0, the ratio of the filtrate to retentate concentration) of several
macromolecules in agarose gel membranes. The rationale behind the experimental design is seen
by rearranging Eq. 1-6. Given that
N = vCL (1-14)
and defining the sieving coefficient (0) as
9 = CL (1-15)
CO'
the sieving coefficient is found to be related to the hindrance factors by
S= Kc (1-16)
1- (1- OKc)exp(-Pe)
Pe = (PKc)vL (1-17)
(4Kd )D.
Equations 1-16 and 1-17 show that sieving coefficients can be used to determine Kc, provided that
P and Kd can be determined independently. Values for Kd were estimated from previous data
(Johnson et al., 1996), whereas the model of Ogston (1958) was used to calculate (P. The sieving experiments and the results for the convective hindrance coefficient are discussed in detail in Chapter 2.
In order to correctly interpret experimental sieving results, it was necessary to correct these results for the effect of "concentration polarization," or the tendency of retained solutes to
accumulate near the upstream surface of the membrane (see Section 3.1). In other words, experimentally what is measured is an "apparent" sieving coefficient:
el= Cf (1-18)
Cb
where C is the concentration of the solute in the filtrate and Cb is the molecule concentration in the bulk retentate solution. However, what is needed in Eq. 1-16 is the "true" sieving coefficient:
C
e = /(1-19)
C,
where Cm is the concentration of the solute at the upstream surface of the membrane. In order to correct experimental sieving results for the concentration polarization phenomenon, a model was developed in which laminar boundary layer theory was used to describe polarization in stirred ultrafiltration cells. The flow in the cell was approximated as a rigid-body rotation above a stationary surface (B6dewadt flow), with a filtration velocity that depended on the osmotic pressure of the retained solute, and therefore varied with radial position on the surface. The resulting axisymmetric convective-diffusion problem was solved using a finite difference method. The development of this model is discussed in Chapter 3. The results from the model are
compared with the predictions of a stagnant film model in which the apparent and true sieving coefficients are related by
0'
9 = (1-20)
(1- 0')exp(vf /kf) + 0'
usefulness of the stagnant film model, several methods were used to determine k First, the quantities in Eq. 1-20 were taken to be area averages and the area-averaged mass transfer
coefficient calculated using the boundary layer model was used, in the limit of vanishing filtration rate. In other words, as might be attempted in practice, ksf was obtained using mass transfer data from the same system in the absence of filtration. Second, a "hybrid" model was developed in which Eq. 1-20 was assumed to be valid locally, and local mass transfer coefficients were
calculated by the boundary layer model, again in the absence of filtration. Finally, again taking the quantities in Eq. 1-20 to be area averages, the area-averaged ks was determined experimentally by measuring the reduction in filtration rate that occurred across commercial regenerated cellulose membranes when a concentrated amount of protein was added to an initially protein-free buffer. Comparisons between these results and those from the rigorous boundary layer model are presented in Chapter 3.
CHAPTER 2
Experimental Determination of
Convective Hindrances in Gels
2.1
Introduction
The primary purpose of this thesis work was to provide the experimental data for the convective hindrance coefficient, Kc, for particular gel/solute combinations. To complement previous results for Kd from our laboratory (Johnson et al., 1995; 1996), globular proteins and
Ficoll, a crosslinked copolymer of sucrose and epichlorohydrin, were employed with agarose gels. It was desired to determine the dependence of K, on solute size and on gel concentration.
2.2 Methods
2.2.1 Macromolecules
Four globular proteins, bovine immunoglobulin G (IgG), bovine serum albumin (BSA), ovalbumin, and lactalbumin and a polydisperse preparation of Ficoll with a weight-average molecular weight of 70,000 (Type 70) were obtained from Sigma (St. Louis, MO) and used without further purification. The Ficoll was labelled with 5-([4,6-dichlorotriazin-2-yl]amino) fluorescein (DTAF) (Sigma) using the procedure described by De Belder and Granath (1973). Unreacted DTAF was removed by elution through 10 ml disposable desalting columns (Econo-Pac® 10 DG, Bio-Rad, Hercules, CA). Labelled Ficoll was concentrated in a 200 ml ultrafiltration cell (Model 8200, Amicon, Beverly, MA) with a 5 kD molecular weight cutoff regenerated
cellulose membrane (PLCC 062 10, Millipore, Bedford, MA). Concentrated samples were freeze-dried until usage.
consisting of 0.01 M sodium phosphate and 0.1 M KCl at pH 7.0. The solute concentration in all solutions was 2 mg/mL, and solutions were filtered using a 0.22 jIm syringe filter (Millex®-GV Filter Unit, Millipore) prior to use in sieving experiments. All four proteins are anionic at neutral
pH, but it was confirmed for three of these proteins (BSA, ovalbumin, and lactalbumin) that at this
ionic strength their diffusivities are not significantly affected by electrostatic interactions, even in
highly charged, sulfated agarose gels (Johnson et al., 1995). Thus, molecular charge was not
expected to be a factor. To confirm this, sieving experiments using ovalbumin were performed in phosphate buffer containing 1.0 M KCl. The sieving coefficients measured in these experiments were not significantly different from those measured in buffer containing 0.1 M KCl.
2.2.2 Gel Membranes
Agarose membranes were prepared on polyester mesh supports, as done previously (Johnson et al., 1996). Slurries were produced by dissolving a measured amount of agarose powder (Type VI: high gelling temperature, Sigma, St. Louis, MO) in 10 ml 0.01 M sodium phosphate buffer containing 0.1 M KCl. They were then heated in a 90'C oven for 4.5 to 5.5 hours and shaken by hand periodically to ensure adequate mixing; an extra hour was needed for the most concentrated solutions to allow all air bubbles to escape. Membranes were cast by placing a
25 mm-diameter piece of polyester mesh (Spectra/Mesh Polyester Filters, Spectrum Medical
Industries, Inc., Houston, TX) on a glass plate (also heated to 90'C) and pouring the hot agarose slurry onto it. The dimensions of the polyester mesh are shown in Figure 2.1. A second hot glass plate was placed on top, and any air was squeezed out. The plates were clamped together, placed in buffer, and stored overnight at 4'C. Membranes were prepared with agarose concentrations of 4, 6, and 8% (w/v). The volume fraction of agarose was obtained by dividing the mass fraction by
I
25 mm
70
gm
40 m
Tf
53 m
2.2.3 Darcy Permeability Measurements
The Darcy permeability of each agarose sample was determined by measuring the hydraulic permeability of the mesh-supported membrane. Membranes were mounted in a 10 mL
ultrafiltration cell (Model 8010, Amicon, Beverly, MA) which was filled with the sodium phosphate/KCl buffer. The transmembrane pressure, applied using compressed nitrogen, was chosen to yield similar filtration rates for all experiments (vf = 10- cm/s). The pressure drop was monitored using a pressure transducer (Model DP15, Validyne Engineering, Northridge, CA), and corrections were made to account for hydrostatic pressure. The flow rate of solution through the membrane was determined by weighing the filtrate. To minimize transient effects, collections were
started 10 to 30 minutes after the application of pressure. The thickness of each hydrated membrane (L) was measured using a micrometer, by placing the membrane between two glass microslides of known thickness. These measurements indicated that thicknesses were not significantly different from that of the polyester supports used (70 Rm). The Darcy permeability was calculated as
4QL (2-1)
PA AP
where y is the viscosity of the buffer,
Q
is the volumetric flow rate of buffer through the membrane,P
is a factor that accounts for the presence of the polyester mesh (Johnson et al.,1996), A is the exposed membrane area, and AP is the pressure drop across the membrane.
The value of
P
for the polyester mesh supports used in this work was calculated by solving Laplace's equation for the pressure field in the gel (Johnson and Deen, 1996):V2P=o (2-2)
- - - - - -.d - *. D4.L -- . -m
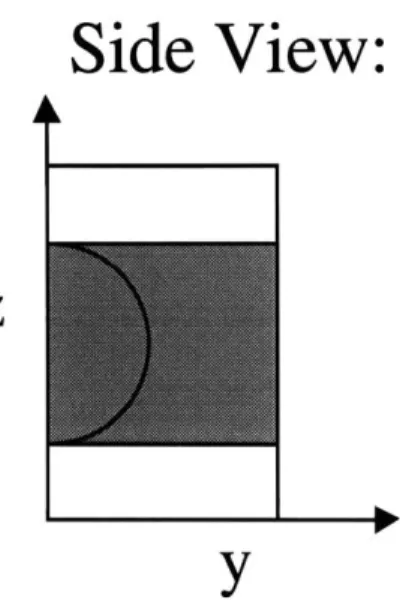
Top View:
Side View:
Z
Ir
FIGURE 2.2: Model idealization of polyester mesh.
polyester mesh was modeled as a square array of intersecting cylinders 40 Rm in diameter, and the total thickness of the model membrane was brought to 70 gm by adding additional "gel" above and below the mesh fibers. It was found previously (Johnson and Deen, 1996) that the value of
P
that is calculated is insensitive to whether this extra thickness of gel is placed above or below the mesh or distributed on either side. One quarter of the mesh opening was modeled due to symmetry, and the boundary conditions used were:n -VP = 0 (on fiber surfaces and symmetry planes) (2-3)
P = AP (on top membrane surface) (2-4)
P =0 (on bottom membrane surface) (2-5)
Calculations were performed on a Silicon Graphics Indy workstation using FIDAP, a commercial finite element package (Fluent, Inc., Evanston, IL), and were based on the Galerkin method using quadratic basis functions. The FIDAP code used is located in Appendix A. Using 7,290 mesh elements it was found that P3= 0.510, with an estimated error of < 0.1%.
2.2.4 Sieving Measurements
Following the determination of Darcy permeability for a particular membrane, the
ultrafiltration cell was emptied and refilled with sodium phosphate/KCl buffer containing 2 mg/mL solute. The stirring rate, calibrated using a strobe, was set at 220 rpm and pressure was applied again. Pressures were chosen to provide filtration rates that would result in membrane Peclet numbers of order unity for solutes (see Eq. 1-17). After a delay of 30 to 60 minutes to minimize transient effects and purge the collection line, the filtrate was collected for an additional 30 to 60 minutes. The retentate was then removed from the cell, which was rinsed and again filled with protein-free buffer. A second measurement of Darcy permeability was performed following the sieving experiment, and data from an experiment were retained only if the hydraulic permeability
changed by < 5 %. Each membrane was used only for a single sieving experiment using either one protein or the polydisperse Ficoll preparation.
For the protein experiments, solute concentrations were measured in the initial and final retentates and in the filtrate by absorbance at 280 nm with a UV spectrophotometer (Shimadzu, Columbia, MD). Retentate and filtrate samples from Ficoll experiments were analyzed using gel
filtration chromatography. The column (XK 16, Pharmacia, Piscataway, NJ) was packed with an agarose/dextran composite gel (Superdex® 200, Pharmacia) and fed at 90 mI/h with a high
precision pump (P-500, Pharmacia). The eluent was analyzed with a spectrofluorometric detector (RF-55 1, Shimadzu). Molecular size of Ficolls was related to elution time by calibrating the gel
chromatography column with four narrow fractions of Ficoll (2.97, 3.77, 4.64, and 5.87 nm) obtained by special order from Pharmacia. The apparent sieving coefficient for all solutes was calculated as
0' Cf (2-6)
Cb
where Cf and Cb are the protein concentrations of the filtrate and the bulk retentate, respectively. The value of Cb was calculated as the arithmetic average of the initial and final retentate
concentrations, which differed by an average of 9.4% for all sieving experiments.
Analysis of Ficoll samples yielded a sieving curve for a continuous range of Ficoll sizes. Figure 2.3 shows example chromatograms of an initial solution, final retentate and filtrate from a sieving experiment with a 6% gel membrane. Shown in this figure is the fluorescence intensity as a function of elution time. Using the calibration information obtained from the narrow fractions of Ficoll, the same data is plotted in Figure 2.4 as a function of Ficoll size. To determine the size range over which reliable sieving coefficients could be calculated, elution profiles for each experiment were shifted by the standard deviation in the pump flow rate. The standard deviation (0.4% at 90 ml/h) was determined by pumping solute-free buffer through the column and
30
40
50
t (min)
60
70
80
FIGURE 2.3: Example chromatograms from a Ficoll sieving experiment with a 6% agarose gel. Plotted is the fluorescence intensity in arbitrary units as a function of elution time in minutes.
600
500
400
300
200
1000
20
---filtrate , , , , , ,e ,, - - -retentate (final) ~ initial solutiona")
600
500
400
300
200
1000
0 FIGURE 2.4:2
4
6
8
10
r (nm)
SExample chromatograms from a Ficoll sieving experiment with a 6% agarose gel. Plotted is the fluorescence intensity in arbitrary units as a function of Ficoll Stokes-Einstein radius (nm).
---filtrate
, ,, j -- retentate (final) initial solution
repeatedly collecting and weighing the eluent. To maximize the effect of this deviation on the measured sieving coefficient, filtrate samples were shifted in one direction by this amount and
initial solutions and retentates were shifted in the opposite direction. The effect of these shifts on the resulting values of the measured sieving coefficient were calculated. The percentage change in 0' caused by these shifts for all experiments with 6% gels are shown in Figure 2.5 as a function of Ficoll molecular size. From this it was determined that for the size range of approximately 2.5 to 7 nm the uncertainty in the pump flow rate resulted in a change in the measured sieving coefficient of 5% or less. Sieving coefficients were calculated only for this range of molecular sizes.
Concentration polarization caused the protein concentration at the membrane surface (C.) to exceed that in the bulk retentate. As stated in Section 1.4, true sieving coefficients (0= C/C,) were calculated using several methods. First, a model was developed from laminar boundary layer theory to quantify concentration polarization in stirred ultrafiltration cells. In this model the fluid
flow in the cell is approximated as a rigid-body rotation above a stationary surface (B6dewadt flow), and the axisymmetric convection-diffusion problem is solved using a finite difference method. It was assumed that solutions were sufficiently dilute so that the effect of osmotic pressure on the filtration velocity at the surface was negligible. The validity of this assumption is addressed below. Given this, the filtration rate (and therefore the sieving coefficient; see Eqs. 1-16 and 1-17) used in the model was uniform over the surface of the membrane. To calculate true sieving coefficients, Cb was set equal to its measured value and 0 was varied until the mixing cup average of the filtration concentration calculated by the model was equal to the measured value of Cf
In another approach, values for the stagnant film mass transfer coefficient, kP were determined experimentally for the stirred cells and used in Eq. 1-20. True sieving coefficients calculated in this way for BSA, ovalbumin, and lactalbumin were reported in Johnston and Deen
15 , , , I 10 100 M~ 00
5 -0
*
0 o0
0 0-2
3
4
5
6
78
r (nm)
SFIGURE 2.5: The percentage change in measured sieving coefficient caused by shifting experimental results by the uncertainty in the pump flow rate for all Ficoll experiments with 6% agarose gels. Results are plotted as a function of Ficoll molecular size.
(1999).1 As seen in this paper and in Section 3.3.5, the experimentally measured stagnant film
mass transfer coefficient was found to be a strong function of the filtration rate. It was found that if kf in Eq. 1-20 was corrected for the different diffusivities of the solutes and allowed to vary
with the filtration rate, the stagnant film values for 1 calculated from Eq. 1-20 differed from those computed by the laminar boundary layer model by an average of only 0.9% and a maximum of
2.7%. Values of K, calculated from these sieving coefficients were also reported in Johnston and
Deen (1999).2 It was found that these stagnant film values for K, differed from those computed by the laminar boundary layer model by an average of only 1.2% and a maximum of 4.8%. Because of these findings and for the sake of clarity, all of the results presented here for the true sieving coefficients and for the convective hindrance factors are those obtained from the full 2-D laminar boundary layer model.
To confirm the validity of the sieving coefficient results, the mass balances for the solutes were checked. These balances were found to close to within an average of 2.2% for all nine
solutes in all three gel concentrations. To verify that charge effects were absent, sieving
measurements using ovalbumin and 6% agarose were also carried out in a buffer containing 1.0 M KCl. There was no significant difference between the results with 1.0 and 0.1 M KCl, indicating that electrostatic interactions were negligible. The validity omitting the effect of osmotic pressure on filtration rate in the laminar boundary layer model was tested using experiments with BSA, where the relationship between solution concentration and osmotic pressure has been reported (Vilker et al., 1981). Experiments in which sieving coefficients were lowest (0 = 0.078) were
considered in order to maximize the influence of osmotic pressure. The osmotic pressure
1 In Johnston and Deen (1999), the apparent and true sieving coefficients for ovalbumin in 8% agarose are incorrectly given as 0.60 and 0.55, respectively. The correct values are 0.62 and 0.57. Standard deviations are reported correctly.
2 In Johnston and Deen (1999), the K, value for ovalbumin in 8% agarose is incorrectly given as
difference across membranes was calculated for these experiments and compared to the applied transmembrane pressure. The concentration at the membrane surface calculated by the model (and therefore the contribution of osmotic pressure) was greatest in the center of the ultrafiltration cell
(see Section 3.3.2). It was determined that the local transmembrane osmotic pressure difference never exceeded 0.6% of the applied transmembrane pressure, indicating that omitting its effect was justified.
2.3 Results and Discussion
2.3.1 Darcy Permeability
The average pressures used and the resulting filtration rates for all permeability
measurements are listed in Table 2.1. The Darcy permeabilities of the agarose gels (calculated using Eq. 2-1) are listed in this table and shown graphically as a function of agarose volume
fraction in Figure 2.6. For the range of volume fractions examined (0.039 0 0.078), K varied
by more than a factor of ten. Plotted in Figure 2.6 for comparison are the results of Johnson and
Deen (1996), which are seen to be in excellent agreement with the present data. As reported in this previous paper, substantial variations in permeability were observed between nominally identical membranes, including those from the same agarose solution. Permeabilities of 4% gels ranged from 71.5 to 121.5 nm2. Permeabilities of 6% gels ranged from 10.8 to 30.1 nm2, while permeabilities of 8% gels ranged from 4.2 to 9.0 nm2.
The effect of the applied transmembrane pressure on the Darcy permeabilities of the gels was investigated. This was done by preparing 4 additional membranes of each gel concentration (4, 6, and 8%) and measuring the Darcy permeabilities of these gels at five different pressures ranging from approximately 2 to 20 kPa. The results of these experiments are presented graphically in Figure 2.7. The present results indicate less of a dependence of i on the applied pressure than suggested by Johnson and Deen (1996). In this previous study, the results of a
TABLE 2.1: Darcy permeabilities of agarose gels. Values are given as mean ± SE for 25
measurements, except for those marked with * (n = 23).
AP (kPa) 1.94 ± 0.05 5.15 ± 0.04 14.55 ± 0.19 v (10-5 cm/s) 14.20 0.50 8.07 0.35 6.41 0.26 0.039 0.059 0.078 i (nm2) 95.1 ± 2.8 20.3 ± 0.9 5.7 ± 0.2
0 Present data
n Johnson andi
m-Deen
(1996)-FIGURE 2.6: Darcy permeability of agarose gels, ic, as a function of the volume fraction of fibers,
4.
Symbols show the mean ± SE (n = 5 for the data of Johnson and Deen, for present data n = 25 for 6% and 8% gels, n = 23 for 4% gels). 1000 100x
(nm2) 10 0.01 0.1 -I I I I I II I I
100 C (nm2) 1
1
FIGURE 2.7: D tra sy0
5
10AP (kPa)
15
20
ircy permeability of agarose gels, ic, as a function of the applied nsmembrane pressure, AP. Open symbols represent 4% gels, gray mbols are 6% gels, and black symbols are 8% gels.
0 0J 0 0
0- 0 00
single gel at each of four different values of 0 were presented. Darcy permeabilities for each gel were measured at five different pressures in the range stated above. It was found that for each gel the permeability varied roughly linearly with the applied pressure. The slopes of the fitted lines (in
nm2/kPa) were given as -1.59, -1.35, and -0.488 for 0 = 0.038, 0.055, and 0.072, respectively.
In the present study these slopes (given as mean ± SE, also in nm2/kPa) were calculated as -0.46
0.18, -0.21 ± 0.09, and -0.08 ± 0.02 for 0 = 0.039, 0.059, and 0.078, respectively. One
explanation for the difference in these results is the fact that in the previous study (Johnson, 1995), it was stated that the thickness of gel membranes (prepared on the same 70 rm mesh as in the present study) was as much as 100 gm. This indicates the presence of an additional gel layer either above or below (or on both sides) of the polyester mesh. It is possible that this extra gel is more easily compressed by applied pressure than the gel within the polyester mesh. As stated in Section
2.2.3, the thickness of gel membranes prepared in this study was not found to be significantly
more than the 70 gm mesh thickness.
2.3.2 Sieving Coefficient
The sieving data for the four globular proteins are summarized in Table 2.2. Sieving data for five selected sizes of Ficoll are summarized in Table 2.3. The Stokes-Einstein radii (ri) of
BSA, ovalbumin, and lactalbumin are those determined by Johnson et al. (1996) from
measurements of D0, by FRAP. The Stokes-Einstein radius of IgG is taken from Potschka (1986). Molecular sizes of Ficoll were calculated from elution time as described in Section 2.2.4. All of the true sieving coefficients presented here were calculated from the full numerical laminar boundary layer model (see Chapter 3) as described above in Section 2.2.4.
As expected, the apparent sieving coefficient (6') and true sieving coefficient (9) both decreased with increasing r, or increasing
4.
The correction for concentration polarization was modest for most gel/solute combinations, such that 0' exceeded 9 by an average of only 11%. The difference between measured and true sieving coefficients increased with increasing solute sizeSieving coefficient results for proteins. Sieving coefficients are given as mean ± SE for 5 measurements, except for * (n = 3).
Protein rs (nm) 0' 9 0.039 1.01 ± 0.002 * 1.00 ± 0.003 * lactalbumin 2.1 0.059 0.95 ± 0.005 0.93 ± 0.006 0.078 0.81 ± 0.014 0.79 ± 0.014 0.039 0.97 ± 0.002 0.95 ± 0.002 ovalbumin 3.0 0.059 0.83 ±0.011 0.80 ±0.010 0.078 0.62 ± 0.023 0.58 ± 0.023 0.039 0.94 ± 0.005 0.90 ± 0.007 BSA 3.6 0.059 0.68 ± 0.018 0.63 ± 0.018 0.078 0.44 ± 0.032 0.40 ± 0.028 0.039 0.85 ± 0.008 0.77 ± 0.010 IgG 5.2 0.059 0.41 ± 0.026 0.36 ± 0.021 0.078 0.28 ± 0.016 0.22 ± 0.013 TABLE 2.2:
Sieving coefficient results for selected Ficolls. Sieving coefficients are given as mean ± SE for 5 measurements.
r, (nm) 0 e' e 0.039 0.96 ± 0.009 0.94 ± 0.012 3.0 0.059 0.80 ± 0.023 0.76 ± 0.022 0.078 0.68 ± 0.017 0.63 ± 0.012 0.039 0.92 ± 0.008 0.88 ± 0.011 4.0 0.059 0.67 ± 0.031 0.62 ± 0.028 0.078 0.49 ± 0.022 0.43 ± 0.014 0.039 0.88 ± 0.012 0.82 ± 0.016 5.0 0.059 0.55 ± 0.037 0.49 ± 0.032 0.078 0.33 ± 0.025 0.28 ± 0.015 0.039 0.83 ± 0.012 0.74 ± 0.014 6.0 0.059 0.43 ± 0.040 0.37 ± 0.033 0.078 0.21 ± 0.022 0.17 ± 0.012 0.039 0.77 ± 0.012 0.65 ± 0.013 7.0 0.059 0.32 ± 0.038 0.26 ± 0.028 0.078 0.13 ± 0.016 0.09 ± 0.008 TABLE 2.3: