HAL Id: hal-02903767
https://hal.archives-ouvertes.fr/hal-02903767
Submitted on 22 Jul 2020
HAL is a multi-disciplinary open access
archive for the deposit and dissemination of
sci-entific research documents, whether they are
pub-lished or not. The documents may come from
teaching and research institutions in France or
abroad, or from public or private research centers.
L’archive ouverte pluridisciplinaire HAL, est
destinée au dépôt et à la diffusion de documents
scientifiques de niveau recherche, publiés ou non,
émanant des établissements d’enseignement et de
recherche français ou étrangers, des laboratoires
publics ou privés.
Investigation on the coloring and bleaching processes of
WO3–x photochromic thin films
Marie Bourdin, Guillaume Salek, Alexandre Fargues, Sandra Messaddeq,
Younes Messaddeq, Thierry Cardinal, Manuel Gaudon
To cite this version:
Marie Bourdin, Guillaume Salek, Alexandre Fargues, Sandra Messaddeq, Younes Messaddeq, et al..
In-vestigation on the coloring and bleaching processes of WO3–x photochromic thin films. Journal of
Ma-terials Chemistry C, Royal Society of Chemistry, 2020, 8 (27), pp.9410-9421. �10.1039/D0TC02170A�.
�hal-02903767�
ARTICLE
Please do not adjust margins
Investigation on the coloring and bleaching processes of WO3-x
photochromic thin films
Marie Bourdin,a,b Guillaume Salek,b Alexandre Fargues,a Sandra Messaddeq,b Younes Messaddeq,b Thierry Cardinal,a Manuel Gaudon,*a
WO3-x (oxygen deficient tungsten oxide) thin films and WO3-x / Ta2O5 (tantalum oxide) composite films exhibit a huge
photochromic effect with 60% of near-infrared transmission modulation, in comparison to literature reviews. The colouring efficiency of such film results from both the stoichiometry of the particles (oxygen/tungsten deficient ratio) and the quality of the films (films are thin, homogeneous, constituted of nanoparticles about 5 nm diameter and so with low scattering). Additionally, the high colouring efficiency obtained with a low fluence ultraviolet (UV) lamp, is followed by a nearly complete bleaching phenomenon after few hours in dark. Beyond the attractiveness of our films toward multiple applications, and especially as films able to regulate the solar flow through smart windows, the optical properties and the
colouring and bleaching kinetics were deeply investigated. Whatever the WO3-x thin films or the WO3-x / Ta2O5 composite
films, colouring under irradiation as well as bleaching under dark, are phenomena which both proceed with a complex kinetic combining ultra-fast process (from charge transfers, with characteristic time about the minute) and slower process (linked to ionic diffusion, with characteristic time about the hour or even longer).
1. Introduction
Photochromism is the ability for a material to change its coloration in a reversible way under light irradiation. The photochromic materials can be divided into two main groups: organic materials, such as spiropyrans, azobenzenes or diarylethenes1–4, and inorganic
materials such as transition metal oxides, metal halides or rare earth complexes5–8. Several chemical processes, induced by
irradiation, can lead to the color change of the compound. For inorganic materials, photochromic phenomena are essentially linked to a photo-induced redox process.
Inorganic photochromic materials are generally transition metal oxides. These oxides are large gap semiconductors (between 2.5 and 3.5 eV) like the molybdenum, niobium, vanadium or tungsten compounds: MoO36,9–12, Nb2O513,14, V2O515,16 or WO35,17–21.
Regarding more particularly the tungsten oxide, Deb was the first to highlight the photochromic properties of the WO3 thin films, in
19735. Although WO
3 is not the preferred material for working on
photochromism, compared to MoO3, which exhibits better
photochromic effect in terms of contrast and kinetic. Indeed, despite of the weak optical contrast between colored and bleached states as well as its very slow and incomplete bleaching process (lack of adequate reversibility for many applications), WO3 oxide is
more and more studied. Indeed, from the optimization of crystallite morphologies, recent studies have been carried out showing a particular interest for producing photosensitive and reprintable inks22,23 based on WO
3 as nanoparticles.
The mechanisms governing photochromism in transition metal oxides are complex and are not fully understood yet, at least they remain a subject to controversies. However, the literature reports
agreed on the fact that the photochromism mechanism is induced for irradiation wavelengths allowing the transfer through the semi-conductor forbidden band with the creation of an exciton, i.e. for light energy in UV range for WO3 oxide since the gap between
valence and conduction band is located at the border between UV and visible range for this oxide. In 19735, Deb has proposed a
complete model explaining the photochromic effect in WO3 films
under UV irradiation. Deb proposed that the photochromism is linked to the creation of colored centers during the preparation of the film. These colored centers would trap the photo-induced free electrons leading to the coloration of the material. Several studies were carried out20-24, it is now well established that the blue color in
WO3 issued from the photo-reduction of the material is based on
the transfer of electrons between tungsten ions having different valence states (W6+, W5+) via an intervalence charge transfer (IVCT).
The photo-redox process follows the next steps. When the WO3 film
is irradiated with UV light, electrons (e-) and holes (h+) are
generated (excitons). Then, sufficiently slow charge depletion occurs, allowing separate reactions of the initiated electrons and holes, additionally to photo-excitons recombination which remains the main. Thus, few electrons are then trapped by some tungsten ions, leading to W5+ ion formation, so IVCT phenomenon and blue
coloration. IVCT is associated with the creation of an absorption site with energy corresponding to the frontier between visible range and near infrared, and with the blue coloration of the material20,24In
literature, it is often suggested that the holes would then react with the water adsorbed on the WO3 film surface to form the H+ ions
(water oxidation); these protons would then diffuse into the material, thus creating a tungsten bronze with HxWO3 chemical
2 |
fraction of the W6+ ions into W5+ ions thanks to their association
with the integration of protons inside the WO3 crystalline network.
Nonetheless, the latter model is in default to explain the bleaching process while maintaining the material in dark, which runs like the reverse redox equation and so implies the deprotonation. Although most of the studies devoted to the photochromism of WO3 agree
and re-propose the Deb’s process, all the parameters necessary to see the appearance of photochromism are not certain. For illustration, recent studies have shown that photochromism only appears if the WO3 oxide previously exhibits oxygen vacancies25,26.
Gérard et al. have shown that perfectly stoichiometric WO3 films
have a very weak photochromic effect compared to films that are slightly deficient in oxygen27. Other authors have shown that water
must be initially chemisorbed on the film’ s surface 28 or even
directly incorporated as crystalline water groups into the material such as in the WO3,0.33H2O29 to observe efficient photochromism.
With the aim to determine which parameters could lead to an improvement in the photochromic performances of WO3, a new
generation of studies have focused the effort on the evaluation of many factors which can influence photochromic behavior, such as heat treatment, the presence of doping ions30 or adsorbed
water28,31. The different film preparation techniques can also lead
to slight modification on the forbidden band energy, the chemical compositions and the film microstructures, thus leading to different photochromic performances. It has also been shown that particle size plays a predominant role on the photochromism intensity. Indeed, particles of small sizes and therefore having a large specific surface are shown to be more photo-reactive32. The impact of the
WO3 particle shape has also been studied: nanosheets or
nanoflocons, with large specific surfaces, have a good photoreactivity with faster coloration process22,33. The comparison
of photochromic contrast obtained from the different available crystal structures for WO3 oxide: cubic, hexagonal, monoclinic
systems31,34, have shown that the optical contrast is linked to the
structural feature.
In this article, we propose to study the photochromic properties of thin films of WO3 obtained by dip-coating from suspended
nano-particles in ethanol. In the first part, the discussion focuses on the film elaboration. In a second part, the photochromic behavior of two types of film is compared and deeply analyzed: on the one hand a WO3 pristine film, and on the other hand a sandwich film
constituted by a WO3 sub-layer covered with a Ta2O5 top-layer.
Finally, the last section is devoted to the reversibility aspect of the photochromism of the two previous films.
2. Experimental
2.1. Synthetic proceduresWO3-x film elaboration. Chemical reagents were purchased from
Sigma Aldrich and used as received. Tungsten (VI) chloride was used as tungsten source and diethylene glycol (DEG) as solvent. WCl6 (7,2g) was added to 100mL of DEG and 20mL of
distilled water. The mixture was heated at 180°C with continuous stirring and refluxed for 3h. At the end of the reaction, a deep blue precipitate was obtained. The precipitate was washed and centrifuged several times with ethanol to remove any trace of solvent and dried in an oven at 80°C and
then was washed in HCL solution (1 mol.L-1) for surface
functionalization with protons. The functionalized WO3-x
nano-particles (NPs) were then dispersed in ethanol to prepare the suspensions (weight content in NPs is 86 g.L-1) which are
dip-coated on standard glass substrate to obtain pristine WO3-x
thin films. The dip-coating parameters are (i) the dip-coating speed: 133mm.min-1 and (ii) for multilayers, successive dip
coating steps are operated with between two steps 30 min drying in an oven (90°C).
Ta2O5 and film elaboration. Chemical reagents were purchased
from Sigma Aldrich and used as received. Tantalum ethoxide was used as Ta source and anhydrous ethanol as solvent. The sol is obtained from tantalum ethoxide, anhydrous ethanol, 37% hydrochloric acid and distilled water. The protocol consists in preparing two separate solutions before mixing to obtain a stable sol. In solution A, 1 g of tantalum ethoxide is added to 4.92 ml of anhydrous ethanol, and stirred for 10 min. In solution B, 2.46 mL of ethanol is mixed with 0.0664 mL of distilled water and 0.01 mL of hydrochloric acid. After mixing, by adding solution B, drop by drop, into solution A, the as-prepared sol is stirred for 1 hr. Once the sol was as-prepared, films were made by dip-coating with a deposition rate fixed at 133 mm.min-1. The layers are dried after each deposition for
30 min. at 90 ° C. Deposition of one to four successive layers have been made.
Ta2O5 / WO3-x composite film elaboration. “sandwich design” with
WO3-x film covered by a Ta2O5 as top-layer are discussed.
2.2. Characterization techniques
Chemical, structural and morphological characterizations.
WO3-x chemical composition of the as-prepared powder can be
determined thanks to chemical titration. The chemical titration was made after dissolution of the powder in NaOH aqueous solution within presence of KMnO4 and KI salt dissolved in
large excess in regard of the tungsten trioxide concentration. Redox process between MnO4- and W5+ ions and then between
the rest of MnO4- and I- lead to the formation of I2 species
which can be titrated by Na2S2O3 solution in order to get W5+
concentration, and then to deduce the oxygen sub-stoichiometry in WO3-x compounds (x equals half time the W5+
concentration).
Zeta potential, which corresponds to the potential of the particles located at the sliding plane between the layer of Stern and the diffuse layer, is measured basing on the electrophoretic mobility of the particles in aqueous solution with different pH values with a Zetasizer NanoZS (Malvern). With the same apparatus, Dynamic light scattering (DLS) was used to determine the size distribution profile of the WO3-x
particles in the suspensions used for dip-coating process. The NPs and the film structures were characterized by X-ray diffraction analysis (PANanalytical X’Pert Pro instrument Cu K1 = 1.54056 Å, K2 = 1.54439 Å and 2θ range from 8° to 80°).
The morphology of the as-prepared films was studied using Scanning electron microscopy (SEM) (Quanta 3D FEG) working
| 3
at 5 kV acceleration voltage. Film thickness was measured using an optical profilometer WYCO NT1100 (Veeco).
Irradiation condition. Irradiations were performed using a UV
Hg-lamp (Vilbert Lourmat 8.LC) at a monochromatic wavelength of 365 nm. The sample is placed at 10 cm from 8 W tubes: the power per surface unit received by the sample is equal to 5.6 W/m2, i.e. irradiance close to the UV-daylight
irradiance in London. The use of such low fluence is to be near the real condition, in regard of life-conditions the smart windows or smart textiles are exposed.
Optical characterization. Film transmission spectra were
recorded at room temperature from 200 to 2500 nm on a Cary 5000 spectrophotometer using an integration sphere (spectral resolution: 1 nm and band width: 2 nm).
3. Results and Discussion
3.1. Film elaborationWO3-x suspensions. The WO3-x nanoparticles, with a pale blue
color, were already described in terms of morphology, structure and chemical composition in our previous paper devoted to the comparison of the photochromic efficiency of various WO3-type powders35. The amount of W5+ within the
raw material, was determined using an iodometric titration. The tests have given an average x value of 0.018, leading to the formula of the raw powder W6+
0.982W5+0.036O2.982. The
structure was shown to be pseudo-cubic with a unit-cell parameter about 3.80 Å. The particle sizes exhibit a narrow distribution centred around 4-5 nm diameter.
Preliminary works to obtain some stable WO3-x NPs
suspensions are firstly conducted (Fig.1).
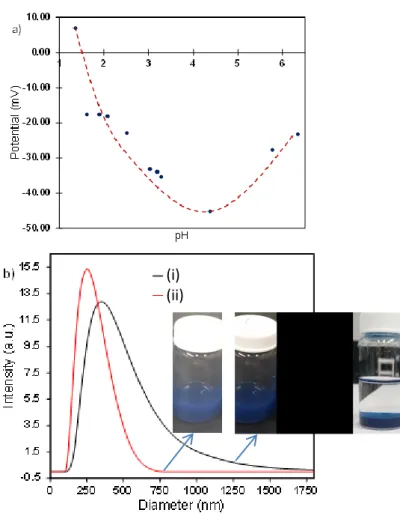
The suspension obtained with the particles extracted from the precipitation medium (DEG) with simple washing with ethanol were sedimenting very quickly. It was necessary to develop a strategy for the preparation a more stable suspension. First, the determination of the isoelectric point of the WO3-x
particles, was performed. Zeta potential values of the particles obtained as a function of the pH of the aqueous solution are shown in Fig. 1a. The isoelectric point of our particles is at a very acidic pH of 1.5 as already listed in the literature36,37. Note
that this can be interpreted as characteristic of a particle surface very rich in cations (W6+, W5+), the surface therefore
has a very clear tendency for hydroxylation at the expense of protonation. Cation-rich surfaces are in good agreement with the WO3-x oxygen-deficient stoichiometry: a segregation of the
oxygen vacancies at the surface may also be considered. Furthermore, zeta measurements show that the particles sediment easily for suspensions of pH between 1 and 2.2 (generally a suspension is said to be stable when the potential, in absolute value, is greater than 20 mV); suspension is stable for pH between 2.2 and 6. In this range, the particles exhibit negatively-charged surfaces due to the formation of pending bonds between the surface tungsten ions and OH- hydroxyl
groups. For pH values higher than 5-6 the particles are gradually dissolved since the paradoxical rise in surface potential between pH between 4 and 6 (the surface charge
becomes less negative) can be seen as a sign precursor to dissolution, with transformation of the nature of the dispersed particles: transition from tungsten oxides to tungsten hydroxides. This measurement in aqueous solution allowed us to develop a protocol for stabilization of our particle suspensions in ethanol. Once the ethanol washes carried out, the particles were washed two additional times in distilled water, the goal being to negatively charge the surface of our particles (hydroxyl group fixation). The particles were subsequently re-suspended in ethanol. The final suspension obtained is blue and much more stable against sedimentation, even over long periods of time (more than 4 weeks). In order to illustrate the influence of such an hydroxyl functionalization of the WO3-x NPs surfaces on the particles, a quasi-elastic light
scattering (DLS) measurement was performed on two suspensions, respectively with particles which are water-washed and not water-water-washed (results reported in Fig. 1b).
Figure 1: a) Evolution of the zeta potential of the WO3-x particles
according to the pH. b) Size distribution of WO3-x particles in
suspension with (ii) or without (i) hydroxyl group fixation.
WO3-x film elaboration. The WO3-x films are prepared from 86
g.L-1 suspension with hydroxylated particles. The photographs
and transmission spectra show that the films from the modified suspension present a good visible transmission with a low scattering coefficient (Fig. 2a). In the near infrared, the
(i)
(ii)
4 |
transmission at 1200 nm varies from 80% for 1-layer film to 62% for 6-layer film (1-, 2-, 3-, 4-, 5- and 6- layer films were studied). From the 3-layer film, a distinct absorption band appears centred at 1200 nm; this absorption band is linked to the presence of W5+ ions due to the intervalence charge
transfer (IVCT) between W5+ and W6+ ions in the structural
network of the WO3-x particles. As the photochromism is
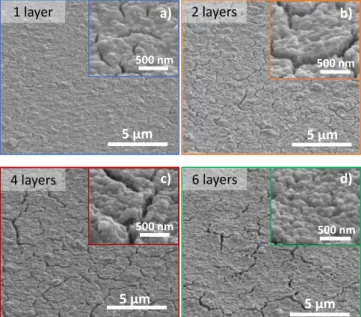
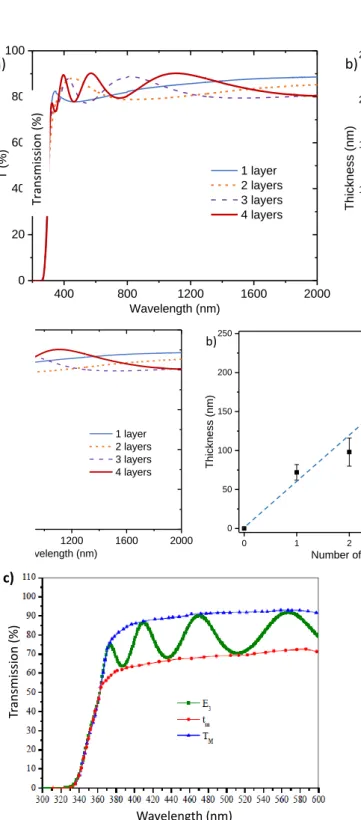
related to the increase of these IVCT charge transfer band, the thickness reached from the 3-layer coating is enough to carry out photochromism studies. The thickness measurements performed with optical profilometer allow assessing the thickness evolution of the films versus the number of successive coatings. The thickness variation is nearly linear with the number of deposited layers (Fig. 2b). The SEM images of our coatings (top views), reported in Fig. 3, show that the surface of the films has an adequate density; however, the presence of cracks, in particular on films for the 6 layers film, is evidenced.
Figure 1: a) Transmission spectra and photographs of WO3-x films, b)
evolution of the thickness of the films according to the number of layers.
Figure 2: SEM pictures of the films.
Ta2O5 film elaboration. The films obtained from 1 to 4
successive coating in Ta2O5 sols were characterized with the
same procedure as the WO3-x films i.e. by transmission spectra,
photographs, thickness measurements and SEM (top views) images. X-ray diffraction shows no diffraction peaks, the Ta2O5
films are amorphous.
The transmission spectra (Fig. 4a) show that the four films studied are transparent with a transmission in the visible range of more than 80%; even with the increase the number of successive deposits. In addition, the appearance of interference fringes, (with a single very wide fringe for films from one or two successive deposits and two clearly visible fringes for films from three or four deposits) is also a sign that the surface of the films is very smooth and the film thicknesses are very regular. Indeed, the interference fringes only appear when the film roughness is low, and the thickness is enough regular to allow consistent interference between the multiple reflections appearing at the different film / air interfaces. The thickness evolution versus the number of successive deposits is roughly linear (Fig. 4b), and SEM images resolution is not sufficiently to evidence any defects (cracks or roughness): films are smooth and crack-free.
From these data and using the method proposed by Swanepoel38 (illustration figure 4c) it is possible to estimate
the value of the refractive index of the film of Ta2O5 from the
envelope which includes the interference fringes, i.e. from the tm minimal and TM maximal transmission values in the
interference regime and the substrate index from equations: 𝑛 = (N+(N2−𝑛𝑠2)1/2)1/2 (n
S = 1.52)
with N = 2×ns×(TM-tm)/(TM×tm)+(ns2+1)/2.
Thus, the effective refractive index of the Ta2O5 film can be
estimated to 1.9 (at a wavelength of 600 nm). In regard of the theoretical refractive index of tantalum oxide: 2.2339, the
estimated effective refractive index indicates that quite dense films are obtained, with about 15-20% of porosity (considering that the effective index can be calculated as a mixing law of porosity and Ta2O5 particle linear susceptibilities).
1 layer 2 layers 4 layers 6 layers 500 nm 5 µm 500 nm 5 µm 500 nm 5 µm 500 nm 5 µm a) b) c) d) 0 1 2 3 4 5 0 50 100 150 200 250 300 350 400 Th ickness (n m) Number of layer Thickness (nm) % (3,@LG) a) b) 400 800 1200 1600 2000 0 20 40 60 80 100 T (%) Wavelength (nm) 1 layer 2 layers 4 layers 6 layers 1 layer 2 layers 4 layers 6 layers 400 800 1200 1600 2000 0 20 40 60 80 100 T (%) Wavelength (nm) 1 layer 2 layers 4 layers 6 layers 0 1 2 3 4 5 0 50 100 150 200 250 300 350 400 Th ickness (n m) Number of layer Thickness (nm) % (3,@LG) a) b) 400 800 1200 1600 2000 0 20 40 60 80 100 T (%) Wavelength (nm) 1 layer 2 layers 4 layers 6 layers 1 layer 2 layers 4 layers 6 layers 400 800 1200 1600 2000 0 20 40 60 80 100 T (%) Wavelength (nm) 1 layer 2 layers 4 layers 6 layers Transm iss ion (%)
| 5
Figure 4: a) Transmission spectra and photographs of Ta2O3-x films,
b) evolution of the thickness of the films according to the number of layers, c) Illustration of the Swanepoel plot for the evaluation of the refractive index.
WO3-x / Ta2O5 composite film elaboration. The method chosen
to make composite films is to prepare “sandwich-type” films, i.e. on a 1 to 6-layer WO3-x film, a single top-layer of Ta2O5 is
then coated. The idea is to fill surface defects of the WO3-x
films with the Ta2O5 additional layer, in order to limit the film
scattering phenomenon thanks to the proximity of the refractive indices of these two compounds. In addition, the top layer of tantalum oxide also constitutes a protective layer of
the film of tungsten oxide particles (particularly regarding oxidative attack: hydration, from the outside medium). From the transmission spectra (Fig. 5a), several elements deserve discussion. The good transparency in the visible area of films, already demonstrated by the photographs of these films, is confirmed by the transmission spectra. The appearance of interference fringes, implying multireflection effect within the film, indicates that the optical quality (roughness) of the film surface is greatly improved by adding the Ta2O5 layer. Moreover, the absorption band relative to the
presence of W5+ ions (IVCT), centred at 1200 nm, is now visible
for films made of successive deposition steps greater than 3 layers. Analysis of the surface of the films by scanning electron microscopy (Fig. 5b), also shows that the surface roughness of the films is improved by the additional layer of Ta2O5 oxide.
Figure 5: a) Transmission spectra and photographs of WO3-x /
Ta2O5 composite films, and b) SEM pictures of the films. Nonetheless, a significant roughness and small cracks linked to the tungsten oxide bottom layer (especially visible on high magnification images) remain visible. For less than 2 successive coatings of tungsten oxide, the cracks are no longer visible. On the other side, there is also deadhesion of the films from the substrate for films issued from 5 and 6 successive coatings of tungsten oxide. This delamination phenomenon can be linked to a higher chemical affinity of the WO3-x layer with Ta2O5 than
with the silica glass substrate. Constraints created during gelation of the of Ta2O5 top-layer (during the sol-gel
transition), can spread to the interface between the WO3-x film
and the substrate. Recent studies performed in our laboratory
400 800 1200 1600 2000 0 20 40 60 80 100 T (%) Wavelength (nm) 1 layer 2 layers 3 layers 4 layers 0 1 2 3 4 0 50 100 150 200 250 Th ickness (n m) Number of layer Thickness (nm) % (3,@LG)
a)
b)
400 800 1200 1600 2000 0 20 40 60 80 100 T (%) Wavelength (nm) 1 layer 2 layers 3 layers 4 layers 0 1 2 3 4 0 50 100 150 200 250 Th ickness (n m) Number of layer Thickness (nm) % (3,@LG) a) b)b)
6 layers 500 nm 50 µm 5 µm 1 layer 500 nm 50 µm 5 µm 400 800 1200 1600 2000 0 20 40 60 80 100 T (%) Wavelength (nm) 1 layer 2 layers 4 layers 6 layers 1 layer 2 layers 4 layers 6 layers 400 800 1200 1600 2000 0 20 40 60 80 100 T (%) Wavelength (nm) 1 layer 2 layers 4 layers 6 layersa)
b)
6 layers 500 nm 50 µm 5 µm 1 layer 500 nm 50 µm 5 µm 400 800 1200 1600 2000 0 20 40 60 80 100 T (%) Wavelength (nm) 1 layer 2 layers 4 layers 6 layers 1 layer 2 layers 4 layers 6 layers 400 800 1200 1600 2000 0 20 40 60 80 100 T (%) Wavelength (nm) 1 layer 2 layers 4 layers 6 layersa)
b)
6 layers 500 nm 50 µm 5 µm 1 layer 500 nm 50 µm 5 µm 400 800 1200 1600 2000 0 20 40 60 80 100 T (%) Wavelength (nm) 1 layer 2 layers 4 layers 6 layers 1 layer 2 layers 4 layers 6 layers 400 800 1200 1600 2000 0 20 40 60 80 100 T (%) Wavelength (nm) 1 layer 2 layers 4 layers 6 layersa)
c)
Tr ans mission (% ) Wavelength (nm) Transm iss ion (%) Transm iss ion (%)6 |
have shown that this delamination can be cancelled by depositing as a first primer, a layer of Ta2O5. Such Ta2O5 /
WO3-x / Ta2O5 architecture is in prospect. In the following, the
4-layer WO3-x recovered with Ta2O5 top-layer, representing a
good compromise between a strong IVCT absorption and low scattering will be studied.
3.2. Photochromic properties
Photo-induced colouring of WO3-x film. The photochromic
study has firstly focused on the 4-layer WO3-x pristine film for
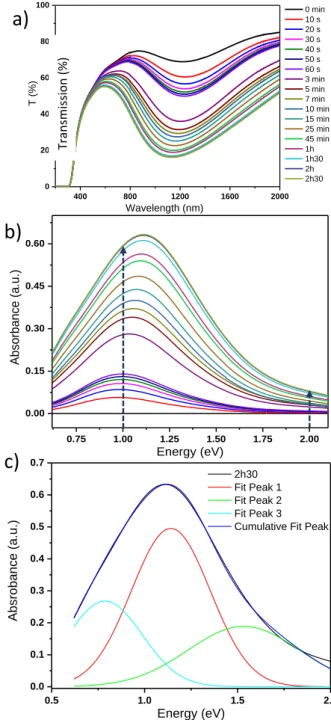
which the IVCT in the near infrared region is already visible before irradiation. The film was submitted to different irradiation durations (cumulated) (Fig. 6a).
We notice firstly that the irradiation makes the film "reacting" in the visible and near-infrared ranges with higher reactivity in the near-infrared region. Nevertheless, the absorption of a part of the red light under irradiation produces a pale blue coloration of the films. This well suggests a significant increase of W5+ ions. The photo-redox process is herein the origin of a
“huge photochromic phenomenon” for such a thin film in regard of the literature devoted to WO3 photochromism.
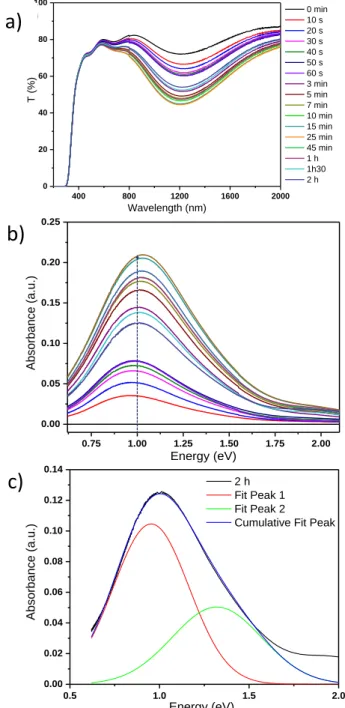
Indeed, an important increase of the absorption at 1200 nm (1 eV) with a loss of more than 8% of transmission after only 10 seconds of irradiation is observed (when this decrease is only 0.25% at 600 nm (2 eV), showing a poor photochromism in the visible range). Similarly, after 2.5 hours of irradiation, the transmission decreased by 62% at 1200 nm.
Considering that the initial absorbance of the film as the reference, the transmission curves were converted in relative gained absorption of the WO3-x film (Fig. 6b). This conversion
of the transmission of the film-substrate sandwich into the selective absorption of the film allows a de-summation in Gaussian peak of the large absorption IVCT band (Fig. 6c). To try to assign each phenomenon to a specific region of the spectrum we have de-summed the spectra with Gaussians to determine the number of phenomena involved in the photochromism of WO3-x oxide films. For this de-summation,
data are plotted vs energy, then treated between 0.62 eV and 2 eV (2000 nm - 620 nm) to include the whole part of the spectrum reacting to UV radiation. The absorption bands are simulated by Gaussian according to the following relation: 𝑦 = 𝐴 × exp {−½ × [(𝑥 − 𝑥𝑐)/𝑤]2},
with y is the absorbance, A is the magnitude of a Gaussian contribution in absorbance unit, x the energy in eV, xc the position of the Gaussian curve in energy, w the width of Gaussian curve in energy. To obtain satisfying simulation, i.e. a fit of the experimental absorbance envelope with low reliability factor, three Gaussian curves, partially convoluted, must be used. The 3 Gaussians have the following positions (see Table 1): the main one (Gaussian curve #1) is centred on 1.14 eV (1090 nm); this main peak is surrounded by two satellite signals, located respectively at lower energy, around 0.78 eV (1600 nm), and at higher energy, around 1.53 eV (810 nm). The hypothesis put forward to justify the consideration of 3 Gaussians is difficult to definitively establish. As far as we know, none report of such deep investigation can be found in the literature. The partial convolution of three absorption
bands means three different absorption phenomena. The absorption can come from polaronic transfers (IVCT band), but also from the formation of an electronic gas (plasmonic band linked to Drude’s theory). Here, the appearance of the high energy component (band located on1.5 eV), potentially could be attributed to plasmonic effect related to the appearance of free electrons. The existence of the other two sub-bands can be attributed to two different polaronic transfers. One may propose that these two bands correspond respectively to bulk and surface polaronic transfers (nonetheless, it can be also related to a polaronic transfer involving W5+ ion neighbouring
oxygen vacancies get a specific energy).
Figure 6: Evolution of a) the transmission of the WO3-x film coated
on glass substrate and b) the absorbance of the WO3-x film during
irradiation. c)De-summation of the WO3-x film absorbance spectrum
by three Gaussian curves (for 2h30 of irradiation).
400 800 1200 1600 2000 0 20 40 60 80 100 T (% ) Wavelength (nm) 0 min 10 s 20 s 30 s 40 s 50 s 60 s 3 min 5 min 7 min 10 min 15 min 25 min 45 min 1h 1h30 2h 2h30 0.75 1.00 1.25 1.50 1.75 2.00 0.00 0.15 0.30 0.45 0.60 Abso rbance (a. u.) Energy (eV) 0 min 10 s 20 s 30 s 40 s 50 s 60 s 3 min 5 min 7 min 10 min 15 min 25 min 45 min 1h 1h30 2h 2h30 0.5 1.0 1.5 2.0 0.0 0.1 0.2 0.3 0.4 0.5 0.6 0.7 Absroba nce (a. u.) Energy (eV) 2h30 Fit Peak 1 Fit Peak 2 Fit Peak 3 Cumulative Fit Peak
a)
b)
c)
Transm iss ion (%)| 7
Table 1: Results of the fit of the absorbance of the WO3-x film with
three Gaussian curves.
2h30 irr. Gauss 1 Gauss 2 Gauss 3
Abs. (A) (a.u.) 0.49 0.19 0.27
Width (w) (eV) 0.21 0.3 0.2
Position (xc) (eV) 1.14 1.53 0.78
The magnitude A of these bands roughly evolves versus irradiation time with quite the same kinetics. Nonetheless, some slight differences, especially the Gaussian curve #3 evolves with a lower kinetic than the two other ones, explain the slight blue shift of the maximum of the absorption envelop versus the irradiation time. Thereafter the plot of the evolution of the absorbance at 1 eV (1200 nm), i.e. corresponding to the central position of the complex absorption phenomenon appearing under irradiation is used to investigate more accurately the photo-redox kinetic. It can be noted that for all the kinetic studies that will follow, the choice to work on absorbance spectra rather than transmission spectra is justified by the fact that the absorbance phenomenon is directly related to the concentrations of chromophore species.
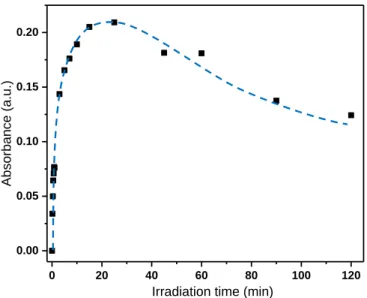
Overall, absorbance seems to be changing rapidly in the first minutes of irradiation, then seems to slow down after a few tens of minutes until almost no longer evolve after 2 hours. From a macroscopic point of view, the evolution in term of amplitude of the photo-induced absorbance signal shows an asymptotic evolution. To go further, the absorbance evolution at 1 eV versus the irradiation time is depicted on Figure 7. The experimental plot has been fitted by trend curves (considering a combination of two 1st order kinetic laws), according to the
equation: 𝑦 = 𝐴1 × [1 - exp (-𝑡/𝑘1)] + 𝐴2 × [1 - exp (-𝑡/𝑘2)],
With two characteristic times (k1 and k2) associated to the phenomena with each their own amplitude (A1 and A2). Table 2 summarizes the four working parameters (A1, k1, A2,
k2). The evolution is composed of a fast-kinetic answer (k2 is about the minute), and a slow-kinetic answer (k1, of predominant impact for long irradiation times, is about the hour). The fast and the slow phenomena get roughly the same amplitude (A1 and A2 are around 0.3 in absorbance unit). For the energy considered (1 eV) the k2 parameter monitors mainly the answer of the material during the first minutes of irradiation and is significantly smaller than the parameter k1. The independent plot of each fast-kinetic and slow-kinetic exponential contribution allows the schematization of this complex kinetics: the pink curve is associated with (A2, k2)
exponential, it increases very quickly in the first seconds and then stabilizes after a while 5-10 minutes of irradiation. Blue plot for (A1, k1) exponential continues to increase even for long-time irradiation; this 2nd phenomenon has not reached
saturation (asymptotic value) even after 150 hours.
These two different evolutions (fast- and slow-kinetics) can be associated to two different photochromic phenomena : during the first minutes a very pronounced reaction from the surface of the film (the charge transfer being the rate-limiting step)
and with for longer times, a reaction rate-limited by the cationic renewal of the WO3 particle surfaces (kinetics of a
diffusional nature). Indeed, the quick photo-reduction of surface cationic species (photo-reduction from W6+ to W5+
ions) would saturate with the increase of the W5+ surface
concentration ; to go further, the surface must "desaturate" by ionic diffusion of the W5+ surface ions towards the bulk, which
leads to slower reaction speed. The photoredox reaction so proceeds with two reaction speeds is depicted in Figure 8.
Figure 7: Absorbance evolution at 1eV (1200nm) during irradiation
Table 2: Kinetic parameters extracted from the fit of the absorbance evolution during irradiation at 1eV
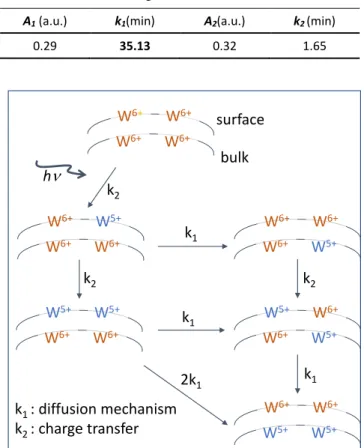
A1 (a.u.) k1(min) A2(a.u.) k2 (min)
0.29 35.13 0.32 1.65
Figure 8: Simplified scheme of the photoreduction of tungsten ions associated with photochromism.
1 eV 0 20 40 60 80 100 120 140 0.0 0.1 0.2 0.3 0.4 0.5 0.6 Abso rbance (a. u.)
Irradiation time (min)
Experimental Sum Exp 1 Exp 2 0 20 40 60 80 100 120 140 0.0 0.1 0.2 0.3 0.4 0.5 0.6 Abso rbance (a. u.)
Irradiation time (min)
Experimental Sum Exp 1 Exp 2
W
6+W
6+W
6+W
6+W
6+W
5+W
6+W
6+W
5+W
5+W
6+W
6+W
6+W
6+W
6+W
5+W
5+W
6+W
6+W
5+W
6+W
6+W
5+W
5+k
2k
2k
2k
1k
1k
12k
1k
1: diffusion mechanism
k
2: charge transfer
surface
bulk
h
8 |
It can be seen that taking into account a very simplified model with two cations on surface and two cations in material bulk, different phenomena can occur during the irradiation to produce a photo-redox reaction with the reduction of the two W6+ ions and charge migration to the bulk. Finally, the
observation of equivalent amplitudes for the two phenomena (fast and slow), palpitates for the bulk and surface attribution. Indeed, particles of 5 nm of diameter like those constituting the as-prepared films get roughly 50% of ions located on surface.
Photo-induced colouring of WO3-x / Ta2O5 composite film. The
photochromic study has then focused on the 4-layer WO3-x
recovered by a Ta2O5 top-coat to evaluate the impact of the
tantalum oxide top-layer on the photochromic effect. Indeed, this quite dense and glassy film could act like a barrier and avoid the participation of the atmospheric water molecules to the photo-redox reaction associated to the photochromism. Using same irradiation conditions and source, the same investigations than for the WO3-x pristine films were carried out on the composite films, transmission versus irradiation, absorbance versus irradiation time and de-summation of the absorbance bands are reported in Figure 9.
We notice that the composite film reacts in the near infrared but less markedly than for the WO3-x pristine film. In fact, after
2 hours of irradiation, the maximal decrease in transmission at 1200 nm is only 28% as compared to the 62% drop observed in the case of the WO3-x film alone. Similarly, the film reacts truly
little in the range of visible, the film is not coloured by the radiation. It seems that the phenomenon at high energy (which was attributed to the creation of an electronic gas: plasmonic: Gaussian curve #3) is not observed by adding the Ta2O5 top layer. Such phenomenon is probably causally linked
to the lower amplitude of the photochromic effect: the concentration of free carriers (or W5+ ions) remains probably
insufficient to produce the creation of free electron gas. As previously made for the WO3-x pristine film, the spectra were
de-summed up in the range 2000 nm - 620 nm (0.62 eV - 2 eV). The de-summation of the transmission spectra allows the determination of the number of convoluted Gaussians and therefore the number of photo-induced chromophores occurring in the composite film for the sandwich configuration. Two Gaussian curves are only necessary; the Gaussian curve parameters are reported in the table 3.
Adding a layer of Ta2O5 on the surface of the WO3-x film well
limits the amount of photo-reduced tungsten VI ions. The Ta2O5 film being transparent to the irradiation lengths, it has, a
priori, none effect on the creation of the concentration of exciton pairs in the tungsten oxide semi-conductor. Therefore, the addition of a Ta2O5 surface film could limit the charge
depletion (between valence band h+ holes and conductive
band free e-) and acts in favour of the exciton rapid
recombination (thus, the photochromic effect is decreased). The photo-reduction of W6+ to W5+ ions on one side, and/or
the oxidation which is necessary to loop the redox process on the other side, are partially impeded. We believe that the top-layer contribution acts on this latter oxidation step: either in avoiding holes recombination with air water molecules (basing
on Deb’s mechanism), or in avoiding the surface O2- anions
departure in the form of dioxygen (what we assume to be the half-oxidation to compensate for tungsten photo-reduction, tests have shown that the humidity of the surrounding atmosphere is of a negligible impact).
Figure 9: Evolution of a) the transmission of the WO3-x / Ta2O5 film
coated on glass substrate and b) the absorbance of the film during irradiation. c) De-summation of the film absorbance spectrum by three Gaussian curves (for 2h30 of irradiation).
Table 3: Results of the fit of the absorbance of the WO3-x / Ta2O5
film with two Gaussian curves.
2h30 irr. Gauss 1 Gauss 2
Abs. (A) (a.u.) 0.10 0.05 Width (w) (eV) 0.21 0.25 Position (xc) (eV) 0.95 1.32 400 800 1200 1600 2000 0 20 40 60 80 100 T (% ) Wavelength (nm) 0 min 10 s 20 s 30 s 40 s 50 s 60 s 3 min 5 min 7 min 10 min 15 min 25 min 45 min 1 h 1h30 2 h 0.75 1.00 1.25 1.50 1.75 2.00 0.00 0.05 0.10 0.15 0.20 0.25 Abso rbance (a. u.) Energy (eV) 0 min 10 s 20 s 30 s 40 s 50 s 60 s 3 min 5 min 7 min 10 min 15 min 25 min 45 min 1 h 1h30 2 h a) b) 400 800 1200 1600 2000 0 20 40 60 80 100 T (% ) Wavelength (nm) 0 min 10 s 20 s 30 s 40 s 50 s 60 s 3 min 5 min 7 min 10 min 15 min 25 min 45 min 1 h 1h30 2 h 0.75 1.00 1.25 1.50 1.75 2.00 0.00 0.05 0.10 0.15 0.20 0.25 Abso rbance (a. u.) Energy (eV) 0 min 10 s 20 s 30 s 40 s 50 s 60 s 3 min 5 min 7 min 10 min 15 min 25 min 45 min 1 h 1h30 2 h a)
b)
b) 0.5 1.0 1.5 2.0 0.000 0.005 0.010 0.015 0.020 0.025 0.030 0.035 0.040 Abso rbance (a. u.) Energy (eV) 10 s Fit Peak 1 Fit Peak 2 Cumulative Fit PeakModel GaussAmp Equation y=y0+A*exp(-0.5*((x-xc)/w)^2) Plot Peak1(10 s) y0 0 ± 0 xc 0.94419 ± 0.00447 w 0.20403 ± 0.00201 A 0.03232 ± 8.14872 Reduced Chi-S 7.05369E-7 R-Square(CO 0.99403 Adj. R-Square 0.994 0.5 1.0 1.5 2.0 0.00 0.02 0.04 0.06 0.08 0.10 0.12 0.14 Abso rbance (a. u.) Energy (eV) 2 h Fit Peak 1 Fit Peak 2 Cumulative Fit Peak
Model GaussAmp Equation y=y0+A*exp(-0.5*((x-xc)/w)^2) Plot Peak1(2 h) y0 0 ± 0 xc 0.95345 ± 0.001 w 0.21113 ± 0.00113 A 0.10455 ± 6.1609E-Reduced Chi-Sqr 2.83156E-5 R-Square(COD) 0.9787 Adj. R-Square 0.97862
10 s Gauss 1 Gauss 2 Absorbance (A) (a.u.) 0.03 0.01 Width (w) (eV) 0.20 0.25 Position (xc) (eV) 0.94 1.36
2h30 Gauss 1 Gauss 2 Absorbance (A) (a.u.) 0.10 0.05 Width (w) (eV) 0.21 0.25 Position (xc) (eV) 0.95 1.32
a) b)
a)
| 9
Moreover, the kinetics of the photochromic phenomenon was also investigated; the absorbance evolution at 1 eV versus the irradiation duration is depicted on Figure 10.
Figure 10: Absorbance evolution of WO3-x / Ta2O5 film during
irradiation at 1eV (1200nm)
As compared to the previous results obtained on WO3-x
pristine films, the main new phenomenon to note for the WO3-x / Ta2O5 composite films is the increase of the absorption
up to 25 minutes of irradiation followed by its gradual decrease after 45 minutes. This overly complex kinetic cannot be fitted considering standard exponential law. The bleaching effect occurring for long irradiation time, acting as a “negative photochromic effect”, was never reported, as far as we know, in literature devoted to inorganic oxide’s photochromism. This negative photochromism can be explained by the re-oxidation of the tungsten ions (W5+ to W6+ oxidation) from an anionic
diffusion coming from the Ta2O5 film. Indeed, Ta2O5 would
behave as a potential source of O2- anions which facilitates the
reoxidation of WO3-x films.
Bleaching and cycling. After studying the colouring behaviour
of the film as a function of duration of irradiation, we investigated its reversibility. Data from the literature report that the reversibility kinetics are very slow when the product is only left in a dark environment to relax and it is often necessary to heat the film at 80°C-100°C in air or under ozone to obtain a complete relaxation20,22,40. Herein, the pristine or
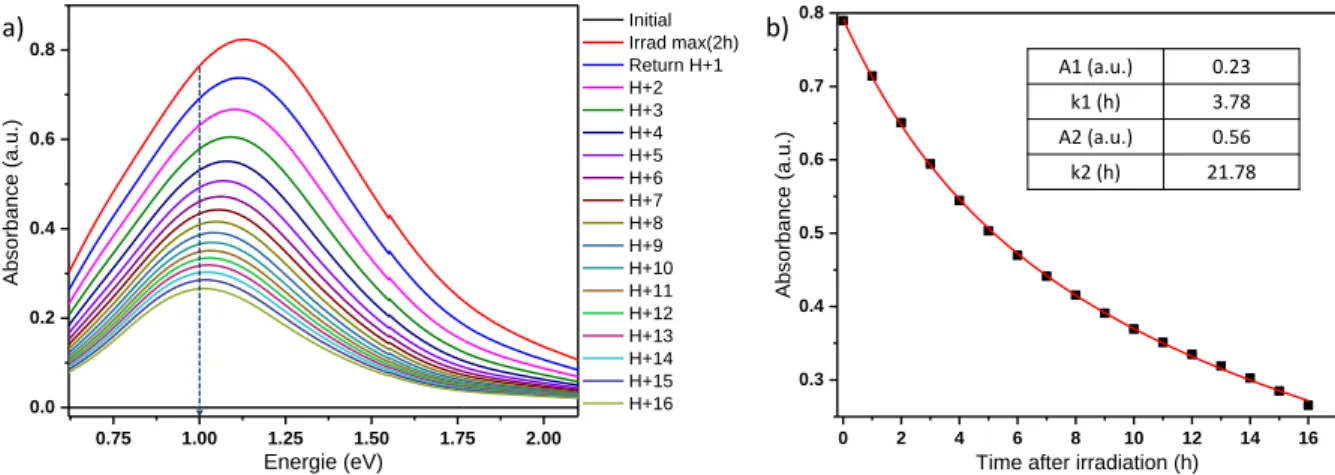
composite films were previously irradiated for 2 hours (slightly beyond saturation time) at room temperature and let in dark for self-bleaching, directly in the spectrometer chamber in order to record the evolution of the transmission spectra: an analysis is automatically performed every hour. The calculated absorbance spectra are shown in Figure 11 and Figure 12, respectively for the WO3-x pristine film and the WO3-x / Ta2O5
composite film.
The time necessary for a total return seems very long (out of the investigated time domain), the gap between the spectrum
obtained after 16 hours darkening and the spectrum of the initial state is still important: the maximal absorption after 16 hours darkening being respectively around 1200 nm equal to about 0.3 and 0.2 for WO3-x pristine film and the WO3-x / Ta2O5
composite film, respectively. The absorbance evolution at 1 eV (1200 nm) versus darkening time are plotted in Figure 11b and The variation of the absorbance has been simulated using the following equation: 𝑦 = 𝐴1’ × exp (-𝑡/ 𝑘1’) + 𝐴2’ × exp (-𝑡/𝑘2’),
i.e. considering as for the colouring effect under irradiation, a double kinetic (slow- vs fast-process) for the bleaching process. Fitting parameters are reported in Table 4.
Table 4: Kinetic parameters extracted from the fit of the self-bleaching evolution at 1eV after 2h irradiation.
WO3-x pristine film
A1' (a.u.) k1' (min) A2' (a.u.) k2' (min)
0.56 21.78 0.23 3.78
WO3-x / Ta2O5 composite film
A1' (a.u.) k1' (min) A2' (a.u.) k2' (min)
0.37 20.57 0.11 4.82
The trends of the two plots and so for the extracted kinetic parameters for WO3-x pristine film and the WO3-x / Ta2O5
composite film are nearly similar. Indeed, for both films, the parameters k2’ and k1’corresponding to the relaxation rates of the fast- and slow-bleaching processes are about 3-5 hours for the fast relaxation and of the order of the day (20-22 hours) for the slow phenomenon. Also, the ratio between fast and slow phenomenon amplitude: the A2’/A1‘ ratio, is about 1/3 in both cases. Time necessary for the film to return to its initial state is however very long, but the quality of the fit with a bleaching equation as a convolution of two decreasing exponential terms, show that 100% bleaching is predicted (i.e. no positive value as final asymptotic point has to be taken into consideration in our kinetic equation). The phenomenon of re-oxidation of W5+ to W6+ by the oxygen in the air is therefore
very slow (k times about few hours) compared to photo-reduction of W6+ to W5+ under UV irradiation (k times of few
minutes). Furthermore, the occurrence of slow and fast-colouring processes has been previously interpreted by a fast charge transfer circumscribed to the film surface followed by surface renewal from ionic diffusion (slow process). Logically, the re-oxidation should follow the same pathways with a rapid process involving the W5+ ions located on the film surface
followed by a slow process dealing with W5+ species initially
located in bulk progressively diffusing to the surface before to be re-oxidized.
Finally, cycling test were carried out on n the WO3-x pristine
film design (Figure 13). Several irradiation steps were applied (2 hours irradiation, allowing the colouring process saturation), with sufficient time in dark in between two successive irradiation steps to let the compound fully self-bleached (allowing the film to return to its “initial” state between each irradiation step). The relaxation time between the first and the second cycle is so fixed to 72 h, and 120 h was necessary between the second and the third irradiation.
0 20 40 60 80 100 120 0.00 0.05 0.10 0.15 0.20 Absor ba nce (a .u. )
Irradiation time (min)
Absorbance
Model NewFunction7 (Us er)
Equation
A1*(1-exp(-x*k1)) + A2*(1-ex p(-x*k2))+ A3*exp(-x*k3)+A4*
exp(-x*k4) Plot Abs orbance A1 0.1476 ± 618014.81245 k1 0.40525 ± 5816.89985 A2 0.0136 ± 618014.81085 k2 0.406 ± 28991.27572 A3 0.01495 ± 438054.76746 k3 0.01807 ± 1168.77181 A4 0.01495 ± 438054.76744 k4 0.01806 ± 1488.49965 Reduced Chi-Sqr 5.58074E-4 R-Square(COD) 0.92774 Adj. R-Square 0.87153
Model NewFunction10 (Us er) Equation A1*(1-exp(-x*k1)) + A2*(1-ex
p(-x*k2))+ A3*exp(-x*k3) Plot Abs orbance
A1 0.099 ± 0 k1 0.66 ± 0 A2 0.089 ± 0 k2 0.138 ± 0 A3 0.02524 ± 0.00849 k3 0.03874 ± 0.05502 Reduced Chi-Sqr 5.47696E-4 R-Square(COD) 0.8818 Adj. R-Square 0.87392
10 |
Figure 3: a) Bleaching of the WO3-x pristine film versus time in dark and b) corresponding absorbance evolution at 1eV
Figure 4: a) Bleaching of the WO3-x /Ta2O5composite film versus time in dark and b) corresponding absorbance evolution at 1eV
Figure 13: Absorbance variation at 1 eV after several hours without irradiation, study completed on 3 different cycles.
For the 3 first cycles, the absorbance at 1 eV (1200 nm) was recorded during the 12 hours following the colouring saturation under irradiation only. The cycling study demonstrates
that the shapes of the bleaching curves of the first, the second, as well as the third cycle are all almost identical. These results tend to show the good performance, in terms of stability of the film under successive cycles (colouring under irradiation+ bleaching under dark).
Conclusions
Huge photochromic properties of WO3-x films obtained by
dip-coating from suspended non-stoichiometric tungsten oxide nanopowder synthetized by a polyol chemical route have been investigated. The kinetic of the photochromism was studied. Several phenomena are responsible for two distinct kinetics of photochromism, the photoreduction of W6+ ions at the particle
surface leading to intervalence charge transfer and the diffusion of the W5+ species within the bulk of the particles.
The deposition of a layer of tantalum oxide on the WO3-x films
is decreasing the photochromic effect. In this later case, the top layer is proposed to limit the holes recombination with air water molecules or the surface O2- anions departure. Cycling
effect has been also demonstrated. This study opens the door to possible applications of non-stoichiometric tungsten oxide as smart windows or in smart textiles, which could progressively coloured during the day due to day-light
0 2 4 6 8 10 12 14 16 0.3 0.4 0.5 0.6 0.7 0.8 Absor ba nce (a .u. )
Time after irradiation (h)
325 nm
NewFunction14 (User) Fit of Sheet1 E"Absorbance 1200 nm"
Model NewFunction14 (Us er) Equation A1*exp(-x/k1)+A2*exp(-x/k2) Plot Abs orbance 1200 nm A1 0.23298 ± 0.02865 k1 3.78845 ± 0.41885 A2 0.55894 ± 0.02952 k2 21.78604 ± 1.50657 Reduced Chi-Sqr 8.54089E-6 R-Square(COD) 0.99972 Adj. R-Square 0.99965 0.75 1.00 1.25 1.50 1.75 2.00 0.0 0.2 0.4 0.6 0.8 Absor ba nce (u .a. ) Energie (eV) Initial Irrad max(2h) Return H+1 H+2 H+3 H+4 H+5 H+6 H+7 H+8 H+9 H+10 H+11 H+12 H+13 H+14 H+15 H+16 0 2 4 6 8 10 12 14 16 0.3 0.4 0.5 0.6 0.7 0.8 Absor ba nce (a .u. )
Time after irradiation (h)
325 nm
NewFunction14 (User) Fit of Sheet1 E"Absorbance 1200 nm"
Model NewFunction14 (Us er) Equation A1*exp(-x/k1)+A2*exp(-x/k2) Plot Abs orbance 1200 nm A1 0.23298 ± 0.02865 k1 3.78845 ± 0.41885 A2 0.55894 ± 0.02952 k2 21.78604 ± 1.50657 Reduced Chi-Sqr 8.54089E-6 R-Square(COD) 0.99972 Adj. R-Square 0.99965 A1 (a.u.) 0.23 k1 (h) 3.78 A2 (a.u.) 0.56 k2 (h) 21.78 a) b) 0 2 4 6 8 10 12 14 0.2 0.3 0.4 0.5 Absor ba nce (a .u. )
Time after irradiation (h)
Model NewFunction3 (Us er) Equation A1*exp(-x*k1) + A2*exp(-x*k2) + y0 Plot Abs orbance (u.a.)
y0 0 ± 0
A1 0.10867 ± 0.01479 k1 0.20748 ± 0.01868 A2 0.36611 ± 0.015 k2 0.04861 ± 0.0021 Reduced Chi-Sqr 3.61502E-7 R-Square(COD) 0.99997 Adj. R-Square 0.99996 0.75 1.00 1.25 1.50 1.75 2.00 0.00 0.15 0.30 0.45 Absor ba nce (a .u. ) Energy (eV) Initial Irrad max (1h30) Retour H+1 H+2 H+3 H+4 H+5 H+6 H+7 H+8 H+9 H+10 H+11 H+12 H+13 H+14 H+15 0.75 1.00 1.25 1.50 1.75 2.00 0.0 0.2 0.4 0.6 0.8 Absor ba nce (u .a. ) Energie (eV) Initial Irrad max(2h) Return H+1 H+2 H+3 H+4 H+5 H+6 H+7 H+8 H+9 H+10 H+11 H+12 H+13 H+14 H+15 H+16 (1h30) A1 (a.u.) 0.11 k1 (h) 4.82 A2 (a.u.) 0.37 k2 (h) 20.57 a) b)
| 11
irradiation and self-bleached during nights or during a certain rest period in our cupboards.
Conflicts of interest
There are no conflicts to declare.
Acknowledgements
The Ph.D. grant of M. Bourdin was supported by idex of Bordeaux, the support of the LUMAQ International Associate Laboratory (LIA) between the universities of Laval and BordeauxThe authors are also grateful to the Natural Sciences and Engineering Research Council of Canada (NSERC), the ANR (ANR-17-CE08-0042-01), the Rise FunGlass and the French Region Nouvelle Aquitaine for the financial support.
The authors would like to thank Sonia Buffière for SEM images.
References
1 M. Irie, Chem. Rev., 2000, 100, 1685–1716.
2 O. Pieroni, A. Fissi and G. Popova, Progress in Polymer
Science, 1998, 23, 81–123.
3 T. Kumpulainen, B. Lang, A. Rosspeintner and E. Vauthey,
Chemical Review, 2017, 117, 10826–10939.
4 T. Tsuruoka, R. Hayakawa, K. Kobashi, K. Higashiguchi, K. Matsuda and Y. Wakayama, Nano Letters., 2016, 16, 7474– 7480.
5 S. K. Deb, Philosophical Magazine, 1973, 27, 801–822. 6 J. N. Yao, K. Hashimoto and A. Fujishima, Nature, 1992, 355,
624.
7 G. Ju, Y. Hu, L. Chen and X. Wang, Journal of Photochemistry
and Photobiology A: Chemistry, 2013, 251, 100–105.
8 8 W. Chen, H. Shen, X. Zhu, Z. Xing and S. Zhang, Ceramics
International, 2015, 41, 12638–12643.
9 9 T. C. Arnoldussen, J. Electrochem. Soc., 1976, 123, 527– 531.
10 J. Scarminio, A. Lourenço and A. Gorenstein, Thin Solid Films, 1997, 302, 66–70.
11 M. Rouhani, J. Hobley, G. S. Subramanian, I. Y. Phang, Y. L. Foo and S. Gorelik, Solar Energy Materials and Solar Cells, 2014, 126, 26–35.
12 N. Li, Y. Li, G. Sun, Y. Zhou, S. Ji, H. Yao, X. Cao, S. Bao and P. Jin, Nanoscale, 2017, 9, 8298–8304.
13 C. Nico, T. Monteiro and M. P. F. Graça, Progress in Materials
Science, 2016, 80, 1–37.
14 L. Pan, Y. Wang, X. Wang, H. Qu, J. Zhao, Y. Li and A. Gavrilyuk, Physical Chemistry and Chemical Physic, 2014, 16, 20828–20833.
15 R. J. Colton, A. M. Guzman and J. W. Rabalais, Accounts of
Chemical Research, 1978, 11, 170–176.
16 S. Nishio and M. Kakihana, Chemistry of Materials, 2002, 14, 3730–3733.
17 K. Bange, Solar Energy Materials and Solar Cells, 1999, 58, 1– 131.
18 S. Cong, F. Geng and Z. Zhao, Advanced Materials, 2016, 28, 10518–10528.
19 J. Scarminio, Solar Energy Materials and Solar Cells, 2003, 79, 357–368.
20 S. Wang, W. Fan, Z. Liu, A. Yu and X. Jiang, Journal of
Materials Chemistry C, 2018, 6, 191–212.
21 T. He and J. Yao, Journal of Materials Chemistry, 2007, 17, 4547.
22 J. Wei, X. Jiao, T. Wang and D. Chen, Journal of Materials
Chemistry C, 2015, 3, 7597–7603.
23 J. Wei, X. Jiao, T. Wang and D. Chen, ACS Applied Material
Interfaces, 2016, 8, 29713–29720.
24 A. I. Gavrilyuk, Electrochimica Acta, 1999, 44, 3027–3037. 25 C. Bechinger, G. Oefinger, S. Herminghaus and P. Leiderer,
Journal of Applied Physics, 1993, 74, 4527–4533.
26 C. Bechinger, M. S. Burdis and J.-G. Zhang, Solid State
Communications, 1997, 101, 753–756.
27 P. Gérard, A. Deneuville and R. Courths, Thin Solid Films, 1980, 71, 221–236.
28 A. I. Gavrilyuk, Applied Surface Science, 2016, 364, 498–504. 29 B. Liu, J. Wang, J. Wu, H. Li, H. Wang, Z. Li, M. Zhou and T.
Zuo, Materials Letters, 2013, 91, 334–337.
30 C. O. Avellaneda and L. O. S. Bulhões, Solid State Ionics, 2003,
165, 117–121.
31 M. Hočevar and U. Opara Krašovec, Solar Energy Materials
and Solar Cells, 2016, 154, 57–64.
32 Y. He, Z. Wu, L. Fu, C. Li, Y. Miao, L. Cao, H. Fan and B. Zou,
Chemistry of Materials, 2003, 15, 4039–4045.
33 W. Li, P. Da, Y. Zhang, Y. Wang, X. Lin, X. Gong and G. Zheng,
ACS Nano, 2014, 8, 11770–11777.
34 Y. Shen, D. Ding, Y. Yang, Z. Li and L. Zhao, Materials
Research Bulletin, 2013, 48, 2317–2324.
35 M. Bourdin, M. Gaudon, F. Weill, M. Duttine, M. Gayot, Y. Messaddeq and T. Cardinal, Nanomaterials, 2019, 9, 1555. 36 A.V. Aleksandrov, N.N. Gavrilova and V.V. Nazarov, Colloid
Journal, 2017, 79, 303-309.
37 M. Anik and T. Cansizoglu, Journal of Applied Electrochemistry, 2006, 36, 603-608.
38 R. Swanepoel, Journal of Physics E: Scientific Instruments, 1983, 16, 1214-1222.
39 G.A. Al-Jumaily and S.M. Edlou, Thin Solid Films, 1992, 209, 223-29.
40 Y. Zhou, A. Huang, S. Ji, H. Zhou, P. Jin and R. Li, Chemistry -