HAL Id: hal-00685908
https://hal.archives-ouvertes.fr/hal-00685908
Submitted on 6 Apr 2012
HAL is a multi-disciplinary open access
archive for the deposit and dissemination of
sci-entific research documents, whether they are
pub-lished or not. The documents may come from
teaching and research institutions in France or
abroad, or from public or private research centers.
L’archive ouverte pluridisciplinaire HAL, est
destinée au dépôt et à la diffusion de documents
scientifiques de niveau recherche, publiés ou non,
émanant des établissements d’enseignement et de
recherche français ou étrangers, des laboratoires
publics ou privés.
Low-temperature structure of magnetite studied using
resonant x-ray scattering
Yves Joly, José-Emilio Lorenzo, Elena Nazarenko, Jean-Louis Hodeau, Danny
Mannix, C. Marin
To cite this version:
Yves Joly, José-Emilio Lorenzo, Elena Nazarenko, Jean-Louis Hodeau, Danny Mannix, et al..
Low-temperature structure of magnetite studied using resonant x-ray scattering. Physical Review B:
Condensed Matter and Materials Physics (1998-2015), American Physical Society, 2008, pp.134110.
�10.1103/PhysRevB.78.134110�. �hal-00685908�
Low-temperature structure of magnetite studied using resonant x-ray scattering
Y. Joly,1J. E. Lorenzo,1E. Nazarenko,2 J.-L. Hodeau,1 D. Mannix,1,3and C. Marin4 1Institut Néel, CNRS and Université Joseph Fourier, BP 166, F-38042 Grenoble Cedex 9, France
2Institute of Physics, South Federal University, Rostov-on-Don 344090, Russia 3XMaS CRG, European Synchrotron Radiation Facility, F-38043 Grenoble Cedex, France
4DRFMC/SPSMS/Groupe Matériaux, CEA, F-38054 Grenoble, France
共Received 1 August 2008; revised manuscript received 11 September 2008; published 29 October 2008兲
We propose a model for the Fe atomic displacements in the low-temperature phase of magnetite共Fe3O4兲,
based on the analysis of the photon energy dependence of the scattered intensity of selected reflections in a resonant x-ray scattering experiment. The symmetry of the displacement pattern is forced to be consistent with the Cc space group, long time claimed to be the actual symmetry of the low-temperature phase. Fe positions at octahedral sites and the corresponding charges are accounted for by a fitting procedure comparing simula-tions and experiment. We found a pattern of small distorsimula-tions in the a-b plane. An independent sensitivity to the charge occupancy permits to refine the model of charge ordering previously proposed. Finally we have com-puted the electric moment of the combined charge displacements to be 1.5 C/cm2.
DOI:10.1103/PhysRevB.78.134110 PACS number共s兲: 61.05.cc, 71.30.⫹h
I. INTRODUCTION
Magnetite共Fe3O4兲 is the archetype compound of a num-ber of physical properties and applications. An accurate de-scription of this compound is thus mandatory for the under-standing of its own properties as well as a reference for similar effects in related materials. Particularly, the magnetic and magnetoelectric properties of magnetite exhibit an
anomaly at TV= 121 K that still defies complete
understanding.1First suggested by Verwey2 and expected in
many oxides,3,4the low-temperature phase transition in
mag-netite has been associated to a charge disproportion on the metal atom sites. Theoretical predictions5,6 have recently
supported Verwey’s scheme of the localization of the charge on a more complex pattern, and nuclear magnetic resonance7
and Mössbauer8 experiments are compatible with different
oxidation states of the octahedral iron sites. In a recent paper we have directly confirmed the occurrence of charge ordering9 using resonant x-ray scattering 共RXS兲 at the K edge of iron. The results of our work are in agreement with the Goff et al.10 analysis but are apparently in contradiction
with the Subías and García et al. papers.11,12In this last case
the supposed contradiction was more a matter of terminology 共When the charge ordering is not with the formal, ionic charges 2 +/3+ can we really speak of charge ordering?兲 and sensitivity共the Bragg reflections measured in their paper are hardly sensitive to the charge ordering found by us兲 than a problem of validity. Strictly speaking when two sites are not symmetry equivalent, the corresponding charges cannot be exactly equal. Since then RXS investigations at the L2,3Fe edges13or at the K oxygen edge14have confirmed our result.
At this edge the photoelectrons probe the d orbitals which are supposed to be charge but also orbitally ordered. In these experiments, the charge ordering occurrence reposes on the measurement of the symmetry breaking 共0,0,12兲 reflection, the sole diffraction peak available at these low photon ener-gies. The origin of the Verwey transition remains a matter of debate as it can be seen in the large number of contributions that have recently appeared in the literature15–19 and any
progress in the structure and charge determination of this canonical compound is welcomed.
The determination of the atomic positions issued from the metal-insulator transition challenges the scientific commu-nity ever since Verwey’s seminal work. Magnetite still re-mains as a difficult problem for conventional crystallography and the low-temperature low symmetry complete structure is not perfectly known yet. The use of traditional x-ray or neutron-diffraction crystallography is especially challenging due to the enormous number of parameters to be accounted for. The actual best refinement has been recently performed in the Pmca space group by Wright et al.20 in a combined x-ray and neutron powder diffraction work. Complexity is greatly reduced in this structure model, where there are six nonequivalent iron atoms, two in tetrahedral sites and four in octahedral sites共Fe1, Fe2, Fe3 and Fe4兲.
In this paper we go a step further toward the complete resolution of the geometric and electronic configuration of the low-temperature structure of magnetite. We noticed in our previous paper that among the iron octahedral sites, the so-called Fe1 and Fe2 sites are especially sensitive to the magnitude of the charge ordering parameter. On the contrary the uncertainty on the Fe3and Fe4iron sites remained impor-tant and, as we concluded, more investigation is necessary to refine these sites. The uncertainty follows from the choice to analyze the data within the Pmca space group, as has been done in conventional crystallography.20 In addition we have
observed peaks indexed on a 共2⫻2兲 superstructure in the 共a,b兲 plane, a proof that Pmca space group needs to be revisited and that a larger unit cell has to be introduced. Indeed detailed neutron-diffraction studies have proposed Cc symmetry in this supercell. This space group is also compat-ible with the occurrence of an electric moment found by Miyamoto and Shindo21 for which a noncentrosymmetric
space group is required.
The goal of this paper is thus to provide a successful attempt to solve this structure in the Cc space group. A key feature of our work is the simultaneous refinement of struc-ture as well as of the charge disproportion. This paper is organized as follows. In Sec. II we present a brief summary
of the theory, and of the necessary tools to solve such a problem. Then the new experiments showing the different reflections measured around the iron K edge are presented. In Secs. VI and VII we explain the strategy to fit the different parameters and we give the results we have been able to reach for magnetite.
II. RESONANT X-RAY SCATTERING AS A TOOL TO SOLVE A STRUCTURE
The atomic scattering factors become complex at energies around the absorption edge of the resonant atom in a given material.22As a consequence, diffraction near the edges vio-lates Friedel’s law 关I共Qជ兲⫽I共−Qជ兲兴 and can be used, for in-stance, to identify enantiomorphs. Moreover it permits to highlight a specific atom from the rest of the atoms in a given structure, which is especially useful when the crystal-lized molecule contains a large number of atoms.23It is also useful to stress the contrast between elements of close atomic number. The multiple-wavelength anomalous diffraction 共MAD兲 is a technique where complete sets of diffraction peaks are collected at a number of photon energies around the resonant共s兲 atom and simultaneously refined. This method is extensively used in the crystallography of biologi-cal materials, and especially of proteins. Our technique, RXS, is different. We record the energy dependence of the intensity of many diffracted peaks in a relatively small en-ergy range around the edge where the atomic scattering am-plitude is highly sensitive to the electric and geometrical local environment of the absorbing atoms. In the specialized literature this technique is also called diffraction anomalous near edge structure 共DANES兲.
A. Theory
Resonant x-ray scattering is a technique where both the power of site selective diffraction and the power of local absorption spectroscopy regarding atomic species are com-bined to the best.24Reflections are recorded over some tens
of eV around the absorption edge of the elements present in the material, where they show strong energy and angular dependencies. This phenomenon is due to the virtual photon absorption-emission associated with the resonant transition of an electron from a core level to some intermediate state above the Fermi level. By virtue of the dependence on the core level state energy and the three-dimensional electronic structure of the intermediate state, this technique is espe-cially suited to study charge,25,26 orbital27,28 or spin
orderings29and associated geometrical distortions.30,31
Core resonant spectroscopies depend on the transition ma-trix elements of matter-radiation interaction:
Mng,ji共o兲=具n兩Oˆi共o兲兩g,j典, 共1兲
where g,j and n are, respectively, the core ground state
centered around the jth atom and the photoexcited state. In the x-ray range, the operator Oˆ is written through the multi-polar expansion of the photon field up to electric dipole共E1兲 and quadrupole共E2兲 terms:
Oˆi共o兲=⑀ជi共o兲· rជ
冉
1 +1
2ikជi共o兲· rជ
冊
, 共2兲 where rជis the electron position measured from the absorbing ion,⑀ជi共o兲is the polarization of the incoming共outgoing兲pho-ton, and kជi共o兲 is its corresponding wave vector. The sign in
front of the imaginary part reveals the use of the negative time arrow. The resonant term, f
⬘
j+ if⬙
j= fj, entering in thetotal atomic structure factor is related to these previous equa-tions. Its complex conjugate is given by the following expression:32 fⴱj共兲 = − me ប2
兺
n,g 共En− Eg,j兲2Mng,j oⴱ Mng,ji ប−共En− Eg,j兲 + i ⌫n 2 , 共3兲whereបis the photon energy, meis the electron mass, Eg,j
is the ground-state energy, En is the energy of the excited
states, and⌫nis the sum of the inverse lifetime of the excited
states and of the core hole. The sum in the equation is ex-tended over all the excited states of the system. The complex conjugate permits to make the link between the physical vention where the time arrow is negative and the usual con-vention in crystallography where f
⬘
共兲 is negative, f⬙
共兲 is positive, and the time arrow is positive. When the incoming and outgoing polarizations are parallel, f⬙
共兲 is proportional to共兲⫻ប, where 共兲 is the absorption cross section.In RXS the global process of photon absorption, virtual photoelectron excitation, and photon re-emission is coherent throughout the crystal, thus the incident and diffracted x-ray beams give rise to the usual Bragg diffraction condition. In-cluding the anomalous共or resonant兲 part, the structure factor is written as
F共Qជ,兲 =
兺
j
eiQជ·Rជj关f
0j+ fj
⬘
共兲 + ifj⬙
共兲兴. 共4兲Rជj stands for the position of the scattering ion j, Qជ is the
diffraction vector, and f0is the usual Thomson factor. We can notice from Eq. 共4兲 that geometrical parameters
共the positions of the iron atoms兲 influence the spectra in two ways. The first one is in the energy dependence of the atomic 共but embedded in its neighborhood兲 scattering factor, fj共兲,
and the second one is in the Bragg phase factor as in con-ventional x-ray diffraction.
By its dependency on the incident and outgoing polariza-tions and wave vectors, the anomalous scattering amplitude becomes highly anisotropic. This phenomenon is usually de-scribed using either Cartesian or spherical tensor algebra. The advantage of the latter set is that each tensor component can be related to a physical feature of the resonant specie, for example, the magnetic moment, the electric moment and so on.33The best manifestation of this anisotropy is the
occur-rence of scattering at the so-called forbidden Bragg peaks, for example, the 共0,0,2兲, 共0,0,6兲 or 共−4,4,2兲 reflections in the Fd3¯m magnetite. The intensity of these peaks is nearly extinct off-resonance by the nonsymmorphic elements of the space group, glide planes and/or screw axis. In this study we found that the shape of the spectra is only weakly dependent on these angles共but their global intensity yes兲. For this
rea-son we do not further develop this aspect which is neverthe-less present in the simulations; no approximation has been used on this anisotropy.
B. Sensitivity to the charge ordering
Equation 共4兲 explains the sensitivity of resonant
diffrac-tion to charge ordering. Indeed atoms with closely related site symmetries but with barely different charges exhibit resonances at slightly different energies. For some reflections the Bragg factor makes the atomic structure factor from these slightly different atoms nearly subtract. Such reflections, usually weak in intensity, are consequently sensitive to tiny differences between the charge state of the resonant specie. In addition, the influence of the often associated geometrical distortions has to be disentangled from pure charge effect.
The ab initio calculation of the resonant part of the struc-ture factor关given in Eq. 共4兲兴 is a delicate task. This is
espe-cially true when multielectronic phenomena govern the elec-tronic properties of the material, for example, the charge disproportion or when there is a strong interaction between the core-hole and the intermediate states. A RXS experiment at the K edge covers a range of about 100 eV around the resonance and therefore calculations have to be performed in this broad energy range. The structures appearing just above the Fermi level 共also called preedge features兲 are rich in in-formation but sometimes difficult to simulate due to the pres-ence of correlated electrons. At the absorption K edges, fj共兲
are dominated by the main E1-E1 共dipole-dipole兲 contribu-tion probing the empty p states and not by the so-called preedge features and therefore the contribution of correlated electrons can be discarded in the calculations. This assump-tion is not valid at the L edges and the ab initio procedure should include the multiplet effects and the electron correla-tions.
The shape of these edges is a signature of the geometrical structure around the absorbing atoms. To illustrate this we show in Fig. 1 typical atomic anomalous scattering ampli-tudes for the Fe in magnetite in two different symmetries, tetrahedral and octahedral. They have different shapes and
the main edge is not exactly at the same energy. The stronger preedge at 7.115 keV for the tetrahedral site is a signature of the lack of inversion center symmetry at these sites.
The valence state of the resonant atom is seen through the energy shift of its main absorption edge. The energy shift,⌬, of the core state 关Eg,j in Eq. 共3兲兴 is directly related to the
variation of the atomic electronic occupancy rate, ␦, with respect to a nominal value. In the case of magnetite we al-ready noted9 that a ⌬= +0.8 eV shift corresponds to ␦
= −0.1 electron difference and this relation is roughly linear. Such linear relation is valid because the local octahedral structure is hardly modified through the phase transition. Once summed over the different sites, this simple shift of the atomic scattering factors can give rise to specific features in the spectra which are a signature of charge disproportion. Suppose a phase transition giving, for each site j, a displace-ment ␦Rជj and a shift ⌬j. A new peak resulting from this
transition can be expressed as
F共Qជ,兲 =
兺
j
eiQជ·共Rជj+␦Rជj兲关f0j+ f
j共ប+⌬j兲兴. 共5兲
Using a Taylor expansion in␦Rជjand⌬jand keeping only
the first order, one gets
F共Qជ,兲 ⬇
兺
j eiQជ·Rជj⫻再
iQជ·␦Rជ j关f0j+ fj共兲兴 + fj共兲 ⌬j冎
. 共6兲 The zero order of the expansion, not shown here, corre-sponds to the Bragg reflections of the underlying undistorted structure. This equation has two terms. The first one is re-lated to the atomic displacements. The second term is pro-portional to the energy shift共and thus to the number of elec-trons兲. It is responsible for the “charge ordering features” of the Bragg reflections and is proportional to the derivative of the scattering factor. Peaks sensitive to charge disproportion will be such that the atoms of the same charge共same sign in ⌬j兲 are out of phase with respect to the atoms with a differentcharge. Most often both terms contribute to the structure fac-tor, sometimes they add, sometimes they subtract. The im-portance of a given Bragg reflection to charge ordering is directly related to the weight of the first term with respect to the second. The maximum of this derivative is going to be at the resonance edge, more than 8 eV above the Fermi level and a monoelectronic calculation generally suffices. The price to pay is that calculations have to be carried out on a large cluster because the final states are highly not localized. Perhaps the most striking example that evidences the power of RXS on analyzing charge structures is the under-standing of the charge order in the low-temperature phase of NaV2O5.34 The phase transition occurring at TC= 34 K
makes the high-temperature unit cell共containing a single V, with charge +4.5兲 become expanded in a 2a⫻2b⫻4c with up to 64 V atoms. By using the second term in Eq.共6兲 alone,
the charge ordering part, and with the help of only three reflections, the whole charge ordering pattern and domains have been uncovered. Refinement of the charge ordered has been undertaken in different charge ordering problems as in
FIG. 1. 共Color online兲 Calculated energy variation of the isotro-pic part of the E1-E1 atomic anomalous scattering amplitude for the iron in magnetite, top is f⬙and down f⬘. On the left the tetrahedral site is shown and the octahedral one on the right. Calculations have been performed for a 7 Å cluster. Shapes are very different.
the BaVS3,35 Fe
3O4,9 and NaV2O5.26 In this latter case the charge disproportion was found to be very small 共⫾0.045 electron兲.
C. Comparison between experiment and simulation
The comparison between measured and simulated spectra is not yet a standard procedure in RXS and to the best of our knowledge the simultaneous fit of geometrical and electronic parameters has never been attempted before. Up to now, most studies in this field use simulations to check the origin of specific reflections or of peculiar features in one or several diffracted peaks.
The large number of parameters to refine makes the use of objective confidence factors to compare experiment and theory necessary. The spectra analyzed in RXS and in low-energy electron diffraction 共LEED兲 share some similitudes: same energy range for the共photo兲 electron, analogous num-ber of reflection, and finally the same level of certitude. Thus it is natural to use the confidence factors already used in LEED in the analysis of our RXS data.
The first criterion is called D1 共Ref.36兲 and is given by
D1共Ihkl e ,Ihkl t 兲 = 50
冕
Emin Emax 兩Ihkl e 共E兲 − I hkl t 共E兲兩dE, 共7兲where Ihklt共e兲stand for the normalized reflection theoretical 共ex-perimental兲 intensity such that
冕
Emin EmaxIhkl
e 共E兲dE = 1. 共8兲
E stands for the energy and关Emin, Emax兴 is the energy range. For a set of reflections, the total D1is just the average of the individual D1. Note that D1is a metric distance and is given in percent. A value of D1= 12% means a pretty good agree-ment when the set is large. Smaller value共down to 5%兲 can be obtained when all the spectra are of the same family.
Note that within the D1 metric the information on the relative intensity between the different reflections is lost due to renormalization. Other criteria, which keep a unique nor-malization coefficient between experiment and theory, proved to be unsuccessful as it is explained in the next chap-ter. A second confidence factor, a R factor called Rx by Horsky et al.,37was used as well. Its main difference with D
1 is that the latter is related to the square of the difference between the spectra. When both convergence criteria concur to the same model, the degree of confidence results is en-hanced.
In classical x-ray diffraction on monocrystal one com-pares peak intensities; in the powder case one comcom-pares rather simple peak profiles. Here we compare sets of simu-lated spectra with sets of experimental curves. It is thus very difficult to give an objective value for the standard deviation. Because of the numerical aspect, our technique is closer to LEED and we also use the technique employed in this field to give a value for the uncertainty. We simply define it for each parameter as the necessary value of its deviation to get an increase in the metric distance of 2%.
D. Simulations
Simulations and fit of the experimental data have been carried out by using theFDMNEScode.FDMNES共Ref.38兲 is a
monoelectronic code using either the full multiple-scattering theory 共MST兲 or, alternatively, the finite difference method 共FDM兲. Calculations can be classical, magnetic, or fully rela-tivistic including the spin orbit. Different options for the exchange-correlation potential are possible, but most often the Hedin and Lundqvist39 energy-dependent approach is
preferred. The code does not use the three-dimensional peri-odicity to calculate the final states. It solves the Dyson equa-tion in a cluster centered around the different absorbing at-oms. Then it calculates the energy dependence of the anomalous scattering factors of the corresponding elements. From these, following Eq. 共4兲, the structure factor is
calcu-lated using eventually the space group symmetry operations. The intensity of the different peaks is then calculated. In the same code, the simulations can be performed by varying dif-ferent crystallographic or electronic parameters along a mul-tidimensional grid of parameters. They are compared with experimental spectra using the criteria D1 or Rx; the mini-mum value corresponds to the better set of parameters.
FDMNES is thus specially adapted to quantify the charge ordering as revealed in RXS experiments. For this problem the so-called non-muffin-tin effect is not very important, and the MST which is faster than the FDM has been chosen. Indeed simulations are rather time consuming 关typically a MST calculation to get the atomic scattering factors 共ASF兲 lasts a day on a cluster of ten processors兴, because they have to be performed in all the nonequivalent absorbing atoms. For each of them relatively big clusters 共up to a radius of 7 Å, containing around 150 atoms兲 were used. To compare experiment and simulation we use a simple multidimensional grid of parameter. Fortunately the time-consuming part of the job, which is the evaluation of the ASF, is performed only one time. As it has been checked, the effect of the atomic displacements and charge disproportion is nearly contained in the Bragg factor and in the energy shift of the ASF. For each model, the calculation of the structure factors, of the Bragg reflection spectra, and finally of the confidence factors is very fast 共around 1 s兲. This makes a complete fit of the different parameters possible.
III. DESCRIPTION OF THE STRUCTURE
At room temperature magnetite displays a cubic structure of space group Fd3¯m and lattice parameters ac= 8.394 Å. It
has two nonequivalent iron sites, one in a slightly distorted octahedral environment 共Wyckoff site 16d, point group 3¯m兲 and the other in a tetrahedral coordination共Wyckoff site 8a, point group 4¯3m兲. In a pure ionic description the octahedral iron is in a +2.5 charge state; the tetrahedral one is +3. The Verwey transition leads to a lowering of the symmetry of the unit cell, at least down to Cc but there are hints that it is probably triclinic.40Despite numerous efforts and attempts in
the past to refine the low-temperature structure only an ap-proximate structure in a smaller unit cell has been com-pletely refined. Until now the Pmca space group is supposed
to give the best agreement20 with experiment. The new unit
cell is rotated by 45°, 共Fd3¯m→ Pmca, and ac⫻ac⫻ac
→ ⬇ac/
冑
2⫻ac/冑
2⫻2ac兲 which generates sixnonequiva-lent iron sites, four of them possessing a distorted octahedral environment. Each site possesses a multiplicity equal to 4. Note that Wright et al.20 found = 90.2363° that makes
monoclinic P2/c a better description of the unit cell. Under this symmetry lowering the two first octahedral iron sites split into four nonequivalent positions of multiplicity 2.
In the present study we have measured peaks not allowed in the Pmca 共or P2/c兲 and are compatible with the four times larger unit cell corresponding to the Cc space group. From the Pmca unit cell, the Cc unit cell has its a and
b cell parameters doubled. Consequently the new unit
cell parameters are a = 11.888814 Å, b = 11.849402 Å, c = 16.775150 Å, ␣= 90°, = 90.2363°, and ␥= 90° with 24 nonequivalent iron atoms of multiplicity 4 共see TableI兲.
The relation between the cubic and the Cc and Pmca reflection index is given by
hCc= 2hPmca= h + k,
kCc= 2kPmca= − h + k,
lCc= lPmca= 2l, 共9兲
where hCc, kCcand lCcare the Cc indices, hPmca, kPmca and
lPmcaare the Pmca indices, and h, k and l the cubic ones. In
agreement with most published studies the cubic indices no-tation will be kept throughout this paper. Reflections such that h + k = odd do not exist in the Pmca unit cell and are thus pure Cc reflections. We shall call them in the following as the “Cc reflections.”
IV. EXPERIMENT
RXS experiments were carried out at the U.K. CRG beamline 共XMaS兲 in the European Synchrotron Radiation Facility 共Grenoble兲 operating at photon energies between 7.060 and 7.220 eV. The x-ray beam wavelength was se-lected by a Si共111兲 double crystal monochromator with an energy resolution of 0.8 eV at the photon energies of the experiment. After scattering an analyzer crystal was used to filter out background coming from the sample共mostly fluo-rescence兲. The two samples used have been prepared using the vertical floating zone technique, with the help of an op-tical furnace 共Crystal System Inc. FZ-T-10000-H-VI-P-G兲. The Fe3O4feed rods were prepared from high purity powder 共Alfa Aesar 99.997%兲, compacted into cylindrical shape un-der isostatic press 共up to 1200 bars兲. The Verwey transition was characterized by magnetic susceptibility measurements using SQUID and results have been given by Delille et al.41
The as-grown crystals exhibit a sharp bulk Verwey transition with TV= 121 K. The scattering experiment was carried out
in reflexion mode, off a兵110其 surface for both samples and at 50 K.
RXS experiments must be performed on a single crystal, if a good signal-to-noise ratio is required. Traditionally one of the major difficulties of crystallographic work on magne-tite has been to overcome a very strong self-absorption, twin-ning, extinction, and the presence of multiple scattering. These issues can be mastered in RXS studies more easily than in conventional single-crystal diffraction experiments. Indeed, parameter refinement in the former is carried through the analysis of the energy dependence of the photons scat-tered within each of the measured Bragg reflections, the ab-solute scale being an unrefined proportionality constant. In order to minimize the number of crystallographic domains, a magnetic field of 0.3 T has been applied parallel to one of the 关001兴 directions that uniquely defines the c direction. In the previous work we found that all reflections can be indexed within a single domain. Multiple-scattering events are elimi-nated by the measurement of the energy spectra at different azimuths and crystal settings. The absorption correction is carefully performed by using the energy dependence of the intensities of several very strong Bragg reflections as a mea-sure of absorption. Three different strong reflections 关Iref共Qជ,兲兴, 共4,0,0兲, 共4,4,4兲 and 共2,2,0兲, have been used to extract a good measure of the absorption coefficient. The anomalous contribution of these reflections can easily be computed and reinjected back into the corresponding struc-ture factor to finally deduce the absorption: absorption共兲 ⬇Iref共Qជ,兲/兩F共Qជ,兲兩2. The data presented in this paper al-ready include the absorption correction.
TABLE I. Pmca iron atom positions given in the Cc cell. Sites 1–16 first are octahedral positions, where sites 17–24 are tetrahedral sites. The prime for the Pmca index is to show the formally in-equivalent sites due to the nonright angle. Their positions were nevertheless refined together as a unique parameter.
Cc index Pmca index x y z
1 1 0 0 0 2 1 0 0.5 0 3 1⬘ 0.25 0 0 4 1⬘ 0.75 0 0 5 2 0 0.7549 0.25 6 2 0 0.2548 0.25 7 2⬘ 0.25 0.7452 0.75 8 2⬘ 0.25 0.2452 0.75 9 3 0.125 0.88295 0.3801 10 3 0.375 0.11705 0.6199 11 3 0.625 0.126 0.3801 12 3 0.875 0.874 0.6199 13 4 0.125 0.126 0.37659 14 4 0.375 0.874 0.62341 15 4 0.625 0.2517 0.37659 16 4 0.875 0.2483 0.62341 17 5 0.125 0.2517 0.06366 18 5 0.375 0.2483 0.93634 19 5 0.625 0.2517 0.06366 20 5 0.875 0.2483 0.93634 21 6 0.125 0.00305 0.18867 22 6 0.375 0.99695 0.81133 23 6 0.625 0.00305 0.18867 24 6 0.875 0.99695 0.81133
V. DESCRIPTION OF THE DATA
In Fig. 2 we show the measured reflections with h + k = odd. These reflections have a null structure factor in the
Pmca space group and are indeed indexed in the Cc space
group. For comparison some of the reflections indexed within the Pmca space group共h+k=even兲 are shown in Fig.
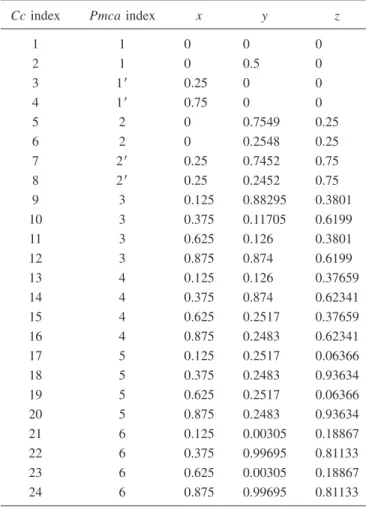
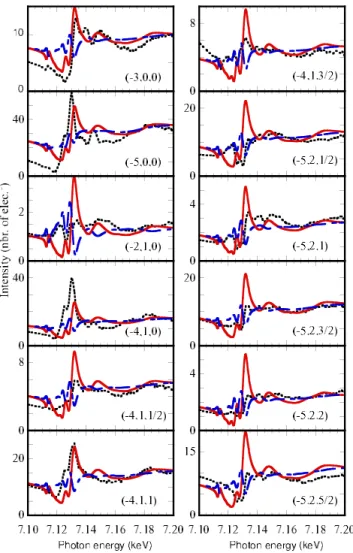
3. Both sets of reflections can be grouped into different fami-lies depending on their global shape. A very important point is that all h + k = odd reflections display the typical two-peak feature which has been acknowledged in the previous study9
as a signature of the charge ordering. These two features at 7.125 and 7.131 keV sometimes appear as peaks and some-times as hollows reflecting the fact that the coefficient affect-ing the derivative of the scatteraffect-ing factor 关Eq. 共6兲兴 can
change sign as a function of Qជ and consequently the charge ordering effect sometimes adds to the geometrical structure effect and sometimes subtracts to it. We can infer from this
result that the different supposedly equivalent iron atoms in the Pmca space group have in fact some charge dispropor-tions among them.
Some of the reflections were measured at different azi-muths. They have not revealed very strong angular depen-dencies of the shape of the spectra. On the contrary the av-erage intensity for some reflections displays an abrupt jump at some angle, and this without changes in the spectrum shape. This fact has no relation with the known azimuthal dependence of the Templeton30scattering and we concluded
it is the signature of the presence of microcrystallites. We cannot exclude that on turning the sample around 共or on changing the reflection兲 the photon beam jumps from one grain to another with the immediate consequence that the information on the absolute intensity becomes unreliable. We have not pursued further the study of the microstructure as it
FIG. 2. 共Color online兲 Energy variation of the intensities at the peak for a number of Bragg reflections observed only within the Cc space group共h+k=odd兲 around the Fe K edge and at T=50 K. In this figure and in the following, the reflections are indexed accord-ing to the Miller indices of the high-temperature cubic phase. The reflections are corrected from self-absorption. The vertical red lines show the position of the features supposed to be a signature of the charge ordering phenomena.
FIG. 3. 共Color online兲 Energy variation of the intensities at the peak for a number of Bragg reflections observed within the Pmca space group 共h+k=even兲 around the Fe K edge and at T=50 K. The reflections are corrected from the self-absorption. The red ver-tical lines show the position of the features supposed to be a signa-ture of the charge ordering phenomena. The main peaks for some reflections is directly related to the charge ordering process. For some other reflections like the 共−4,4,2兲, the main peak at 7.128 keV is due to the trigonal field at the octahedral sites and thus their anisotropy has nothing to do with charge ordering.
is another unsettled problem in Fe3O4 that we merely ac-knowledge. Thus the analysis with the metric distance is per-formed with individual coefficient for each reflection instead of using a global one for all reflections. The general trend for the intensities for the different families of reflections remains valid: Cc reflections are less intense than the Pmca ones and these are weaker than the cubic ones.
VI. STRATEGY AND SENSITIVITY A. First approximations
It is evident from the considerations above that the num-ber of parameters to fit is very large. Including the 32 oxygen atoms, one gets 56⫻3 position parameters, plus the charge of all these atoms. In the following we discuss the different approximations that we have to make in order to pursue the analysis of our data.
1. Oxygen contribution
The RXS experiments performed around the iron edge are especially sensitive to these sites. However, the oxygen atom positions and displacements contribute to the scattering cross section in two different ways. First, as shown in Eq.共6兲 they
participate to the scattering cross section with a constant fac-tor, different for each reflection. Second, they change slightly the anomalous scattering factors, as seen in the Pmca distor-tion of the cubic cell. Nevertheless Cc reflecdistor-tions are weaker than those indexed in the Pmca unit cell and therefore the concomitant atomic displacements ought to be smaller. We can safely conclude that the relative displacement of the oxy-gen atoms will not affect much the total scattering factor. This point has been verified to hold true and it is further discussed below. In a first approximation we have thus as-sumed this contribution to be very small and we have disre-garded it from the calculations. Only the known oxygen po-sitions in the Pmca unit cell have been kept in the simulations.
2. Tetrahedral iron
Charge ordering takes place at the octahedral sites. More-over the tetrahedral environment endorses less possibility for distortion and we can suppose a priori that these sites have very little influence on the intensity of the Cc reflections. The measured spectra共Figs.2 and3兲 show that the charge effect
is present with features at the same energies in the Cc reflec-tions and in the Pmca one. This contrasts with the position of the absorption edges of both sites共Fig.1兲 which disregards
the possibility for a charge effect occurring at the same en-ergy as in the octahedrally coordinated iron. We can con-clude that charge ordering at the tetrahedral site is negligible. RXS experiments at the Fe L edges have come up with the same conclusion.13 Despite these qualitative remarks, we
have made some tests which confirm these considerations as is shown in Sec. VIII.
3. Octahedral iron
In our previous paper on the charge disproportion9 we
obtained different results on the two pairs of octahedral iron
sites. The charge disproportion between the Fe1and Fe2sites was estimated with small error bar ⫿共0.12⫾0.025兲 around +2.5. A stronger uncertainty was found in the charge dispro-portion between the Fe3 and Fe4 sites. For this second pair the Cc unit cell was used in the refinement yielding a charge disproportion of ⫾共0.10⫾0.06兲 around +2.5. We explained this larger uncertainty as due to the different environment of the two pairs of octahedral irons. Whereas Fe1and Fe2are at the centers of their respective octahedron, Fe3 and Fe4 pos-sess a more distorted local environment; the iron atoms are slightly off center. Furthermore these position shifts are re-sponsible for the doubling of the cell along the c axis whereas the Fe1and Fe2ordering gives no effect on the cell doubling.
An improvement on the structure and charge determina-tion is expected from the analysis of the posidetermina-tion of these off-centered Fe sites and we shall focus our study on the analysis of these sites. This simplification along with that on the tetrahedral and on the oxygen sites makes the number of parameters decrease down to 32, which includes the charge and the position along the three directions of each of the eight Fe atoms at sites Fe3 and Fe4. If we additionally as-sume that Pmca is a good overall structure of the displace-ment pattern the number of free parameters can be further reduced. Implementing this assumption comes to consider that the sum of the atomic displacements of the atoms in positions 9–10–11–12 共that makes the Fe3 site in Pmca兲 must add to zero, and the same should hold for the subset 13–14–15–16 共that makes the Fe4 site in Pmca兲. Moreover the average disproportion among the eight atoms is kept to zero in order to maintain a global charge neutrality. At the end one remains with 23 independent parameters.
B. Sensitivity
Slight changes in position or charge of the Fensites, with
n running from 9 to 16, yield an important contribution to
reflections indexed in the Cc cell, as expected. Conversely, the h + k = even reflections display hardly any effect except at some very weak ones such as the共−4,2,12兲. The fit and the ensuing discussion will be performed only with the spectra at these Cc reflections.
As a first test we distort the Pmca symmetry to reach the
Cc by a simple displacement in opposite direction of two
previously equivalent atoms 共Fe9and Fe11兲 along a. The re-sult is that all the Cc reflections have very similar shapes; the difference is merely a multiplicative factor 共see Fig. 4兲. We
have checked that the same kind of spectra is obtained for any other pair of atoms. The agreement is not good when comparing with the experiment except for some reflections where the global shape could appear satisfactory.
A second test consists in setting a charge ordering on the same pair of atoms without any displacement. For this pur-pose a simple shift of ⫾0.2 eV of the structure factor is applied. From our calculations this corresponds to a⫾0.025 charge disproportion 共or ⫿0.025 in number of electrons兲. The two-peak feature already mentioned at 7.125 and 7.131 keV共Fig.4兲 is obtained but with almost no intensity outside
that of the measurements showing that charge disproportion ought to be accompanied with a Fe displacement. This con-clusion stems from the form of Eq.共6兲.
A third test consists in jointly performing the displace-ment along a and an energy shift. As it is shown in Fig.5the agreement is good for some reflections but bad for some others. Both effects seem to add for some reflections and to subtract for some others. Reversing the sign of the shift with-out inverting the sign of the atomic displacement produces a swap in the quality of the simulation. We have repeated this simulation on other pair of atoms and the result is always the same. The conclusion is that it is not possible to improve all the spectra with a single pair of atoms irrespectively of the atomic displacement direction, that is along a, b or c. The intensity of the spectra is roughly proportional to the square of the displacement in the energy range where this effect is dominant and proportional to the square of the charge dis-proportionation in the two-peak region as it was expected from formula 共6兲. By playing these tricks we reach a first
conclusion on the relative amplitude of the displacement and on the magnitude of the charge disproportionation required to obtain spectra in close agreement with the experiment. Roughly, a 0.025 electron charge disproportion must corre-spond to a 0.02 Å displacement. When fitting the charges and displacements for all the atoms, their values can vary in different ways. Nevertheless the average of the relative value of both parameters must remain of this order of magnitude.
It has been very difficult to find a pattern of charge and displacements which permits to improve all the measured spectra. We have also tried to use a simplified pattern for the charges and for the displacement direction, but we have not succeeded in this way. To get a reasonably good agreement with measurements we need to apply different displacements on the different pairs of iron atoms with different shifts.
A constraint that can be used to reduce further the number of possible models is the occurrence of a net electric moment along the a direction.21For this to occur charge disproportion
on the different pairs of iron sites共9–11兲, 共10–12兲, 共13–15兲, and 共14–16兲 has to be of opposite sign. Thus we keep this rule for all the parameters, charges and displacements are opposite on all these pairs of sites. We are left with 16 inde-pendent parameters; the most relevant feature is the relative way of displacement among the atoms. At this level of the discussion we have decided to keep the modulus of the
dis-FIG. 4. 共Color online兲 Energy variation of the simulated inten-sities of the Bragg reflections corresponding to the Cc space group around the Fe K edge. The spectra on the left side共a兲 are obtained with a displacement of ⫾0.002 cell unit along a for the Fe9 and
Fe11sites and no charge disproportion. They all have almost the same shape, the difference is mainly a multiplicative factor, no one shows the double feature at 7.125 and 7.131 keV. The spectra on the right side 共b兲 are obtained with a charge disproportion of ⫾0.025 electron for the Fe9 and Fe11sites but without any displacement from the Pmca positions. They all show almost only the double feature at 7.125 and 7.131 keV. Note that the relative amplitude between spectra is different with the relative amplitude of the spec-tra obtained with the sole displacement as shown in 共a兲. In this figure and in the following the intensity unit is the square of number of electron. Relative amplitudes can thus be compared.
FIG. 5. 共Color online兲 Energy variation of the simulated inten-sities and the corresponding experiment 共dotted兲 of Bragg reflec-tions existing in the Cc space group. These spectra are obtained with two opposite charge disproportions of respectively ⫾0.025 共full line兲 and ⫿0.025 共dashed line兲 and a same displacement of ⫾0.002 cell unit along a for the Fe9and Fe11sites. Some reflections
have a good shape but some others are worth that without charge disproportion. A multiplicative factor is applied on the experimental spectra to compare with the simulations.
placements constant for all the atoms, an approach that does not seem unnatural in view of the underlying cubic symme-try. The magnitude of the displacement can nevertheless be different along the three directions.
It is then possible to use a simple multidimensional grid of parameters, because there are only three values for each parameter that we can correlate, atom by atom, throughout the entire Cc cell. In addition we are sure to avoid the oc-currence of a local minimum of the metric distance and that another set of parameters gives a satisfactory account of the spectra.
The Cc reflections are sensitive to the absolute value of the displacement mostly only through a constant factor in the intensity; the shape of the spectra is not modified. Within our procedure of using normalized intensities, the absolute value of the displacements is not a critical parameter. Its magnitude can be quantified in some very weak Pmca reflections as the 共−4,4,2兲. Indeed the Thomson part of the amplitude is of the same order of magnitude as the anomalous Templeton part,30
and both contributions are not modified in the same way when displacing the atoms from their positions in the Pmca unit cell. Consequently, small changes in position are easy to detect at these reflections, and they can eventually permit the estimation of its maximum value.
In the first runs only the pattern of displacement along the three directions and the charge disproportions are refined us-ing only the Cc reflections. Then the magnitudes of atomic displacement and of the charge ordering of the Fe1-Fe2Pmca sites have been fitted within this pattern.
VII. RESULTS
Calculations and comparison with experiment have been performed on a wider energy range 共90 eV兲 than in the pre-vious study.9We got the very satisfactory result that the best
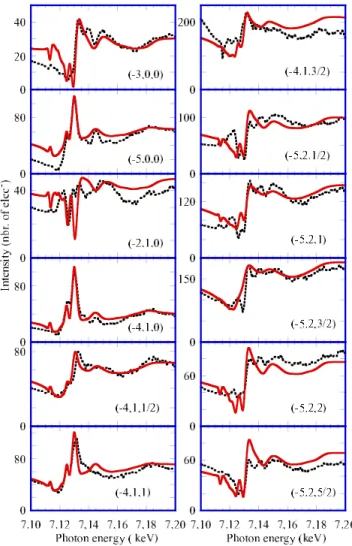
agreement given by the metric distance corresponds to a very good visual accord of all the different spectra. For all of them charge and displacement effects add or subtract conveniently. The best result is given in Fig.6 and the refined parameters 共position and charge of the atoms兲 are given in TableIIand Fig. 7. In these calculations atomic form factors are calcu-lated in the Pmca structure; the Cc displacements are taken into account only through the Bragg factor. In a second step new structure factors are calculated by using the so-refined
Cc unit cell, and the calculated spectra show no difference on
using the scattering form factors of either the Pmca or the
Cc structures. Again we are assuming that the displacements
of the oxygen atoms hardly affect the diffracted intensities, at least for the Cc reflections, and do not introduce subtle changes in the atomic form factors.
The charge ordering on the Fe1-Fe2sites remain at⫿0.10, very close to our previous results.9 The D
1 metric distance and the Rx confidence factor have reached the same result. This gives more confidence to the model that we have de-scribed here.
Following Goff et al.,10 we have considered a possible
charge disproportion between the Fe1 and Fe1⬘sites and the Fe2 and Fe2⬘ sites. We found a slightly better agreement when the charge disproportion is −0.125 and −0.075 for the
first pair and unchanged, +0.10, for the second pair. This variation is of the same order of magnitude than the esti-mated uncertainty and we can conclude that the variation of charge disproportion, if any, ought to be very small between these sites.
FIG. 6. 共Color online兲 Energy variation of the simulated inten-sities 共full line兲 and measured spectra at 50 K 共dotted兲 of Bragg reflections corresponding to the Cc space group around the Fe K edge. The simulation is performed with the structural and charge model given in TableII.
TABLE II. Fitted iron atom positions and charges given in the
Cc cell. They are defined in the same way as in TableI. The posi-tion, in cell units, is relative to the Pmca structure. The charge disproportion,␦charge, is relative to +2.5.
Cc index ␦x ␦y ␦z ␦charge 9 0.0020 0.0015 0.000 0.025 10 0.0020 0.0015 0.000 0.050 11 −0.0020 −0.0015 0.000 −0.025 12 −0.0020 −0.0015 0.000 −0.050 13 0.0020 0.0015 0.000 0.000 14 −0.0020 −0.0015 0.000 0.025 15 −0.0020 −0.0015 0.000 0.000 16 0.0020 0.0015 0.000 −0.025
VIII. DISCUSSION
In the previous paper we have found that the charge or-dering is very robust on the Fe1-Fe2sites and we confirm this result.9 The new result ⫾0.10 electrons, to compare with
⫾0.12 electrons in our previous work, is within the uncer-tainty 共⫾0.025 electron兲. Not surprisingly, we have found a more complex charge ordering pattern on the Fe3-Fe4 sites 共as noted in Pmca兲 once the Cc superstructure model is con-sidered. The average charge disproportion on these sites is smaller than in the previous study, around⫾0.025 electron to compare with ⫾0.10 electron but a rather large uncertainty 共⫾0.06 electron兲. The value of the charge disproportion seems small but the effect can nevertheless be quantified. Figure8shows some of the Cc reflections with and without the charge effect. It can be seen that the effect is important not only at the two double structure energy range but also at higher energies. This is due to the fact that these reflections are very weak.
The uncertainty in the Fe atomic displacement in the a-b plane is around ⫾0.001 in cell units, and probably larger along the c direction. We found the pattern of displacements very robust when both charge and displacement are consid-ered simultaneously. We think that such a pattern will be a useful starting point for future studies of magnetite. The small amplitude of the obtained displacements from the
Pmca structure makes also the results not in contradiction
with the Wright et al.20analysis. We show some of the Pmca
reflections with and without the Cc displacement. This is shown in Fig. 9.
To illustrate the sensitivity of the very weak 共−4,4,2兲 reflection on the amplitude of the displacements we show in Fig.10共a兲the effect of no displacement, 共b兲 the best model, and共c兲 a model with too large displacements 共three times the best for all the sites, which is up to 0.006 unit cell兲. We recall
that such reflection already present in the high-temperature phase has a very different origin than the Pmca and Cc re-flections. In this case, when pairs of equivalent atoms related by rotation symmetry have their Bragg factor opposite in sign, the anisotropy of the ASF makes the resulting structure factor not zero. This type of reflection is more difficult to fit, because all the complexities of the anisotropy and of the Cc symmetry breaking add up.
We come back to the a priori considerations concerning the possible influence of the other atoms on the diffracted Cc intensities. We already notice that the small displacements of the iron atoms in Cc do not change sufficiently their anoma-lous scattering factor to modify the calculated intensity. The same occurs for the surrounding oxygen atoms because the important parameter is the relative position of both species. The constant factor resulting from the Thomson part must be smaller than the one due to the iron atoms. It is difficult to
FIG. 7. 共Color online兲 Pattern of displacements of the iron at-oms corresponding to TableII. Only the atoms close to the planes
z = 3/8 and z=5/8 are shown. Each site corresponds to four
equiva-lent positions, two in each plane obtained by共x,y,z兲→共x+1/2,y + 1/2,z兲; the two other atoms are at z⬇1/8 and z⬇7/8 and the displacement pattern can be obtained by the symmetry operations 共x,y,z兲→共x,−y,z+1/2兲 and 共x+1/2,−y+1/2,z+1/2兲. The iron indexes correspond to the one used in the Cc unit cell. In brown and yellow are shown respectively the Fe3and Fe4as noted in Pmca; in red are the oxygen atoms. The arcs of circle give the direction of the main displacements from the cubic positions toward the Pmca ones. The arrows give the Cc displacement directions of the atoms from the Pmca positions. They are mainly toward one of the neighboring oxygen atoms in the plane. The four times smaller Pmca unit cell is also shown.
FIG. 8. 共Color online兲 Energy variation of the intensities at the peak for Bragg reflections corresponding to the Cc space group around the Fe K edge and at T = 50 K. Dotted lines are the experi-ment and full lines are the simulations using the Cc displaceexperi-ments. The effect of the charge is clearly seen; the curves closer to the experiment include the charge disproportion, the other ones do not. For some reflections as the 共−3,0,0兲, the charge order effect is specially strong.
FIG. 9. 共Color online兲 Energy variation of the intensities at the peak for a number of Bragg reflections corresponding to the Pmca space group around the Fe K edge and at T = 50 K. Dotted lines are the experiment and full line the simulations. There is almost no difference between the simulation including the Cc superstructure model and the pure Pmca model. Spectra corresponding to both models are very similar. The agreement remains less good for the very weak reflections.
imagine that adding a relatively small constant can change drastically the shape of the Cc spectra and thus the conclu-sion on the pattern and charge. In the same way as for the octahedral sites, we have carried out a simulation of the charges and of the displacements at the tetrahedral Fe sites. In this case, keeping the octahedral sites at their original
Pmca positions, we always found a poor agreement. Charge
ordering at these sites can be ruled out. Some displacements remain possible but the agreement is poorer than on consid-ering the octahedral site. We show in Fig.11the best agree-ment reached for two peaks; the spectra have mostly the same shape. Moreover it is not possible to get the peak at 7.125 keV. Some peaks as the 共−5,2,5/2兲 display a rela-tively good agreement, but the majority of them cannot re-produce the experiment. Thus small displacements on these
sites cannot be completely excluded, although their contribu-tion is not going to be sizable on the majority of the mea-sured peaks. Therefore the conclusion for the Fe9-Fe16 octa-hedral sites remains valid.
The case of the Fe1-Fe8octahedral iron sites because their atomic anomalous form factors are close to the Fe9-Fe16ones and a fit on their parameters could eventually give an artifi-cial good agreement. We did nevertheless simulations also at these sites to fit, their charges and displacements, keeping the other iron sites at their original Pmca positions. We found a surprisingly poor agreement, showing that charge dispropor-tions and displacements at these sites must also be smaller than at the Fe9-Fe16, as it was expected. To illustrate this, the metric distances for the best models obtained by the three fits on the three groups of iron sites are as follows: Fe17-Fe24and Fe1-Fe8 give, respectively, 6.16% and 5.87% to compare with 4.86% for the Fe9-Fe16 sites. Such a difference in the metric distance is a robust proof of our model. As for the tetrahedral iron sites, we cannot exclude that weaker charge disproportions and displacements exist on the Fe1-Fe8sites.
From all these simulations, we do not pretend having solved completely the Cc structure. A complete quantitative evaluation of all these parameters would need a concomitant fit of all of them, a situation that is not possible today. The points we think safe in our model are the following: 共1兲 the pattern of displacement of the Fe9-Fe16 sites with the corre-sponding charge disproportions, 共2兲 the absence of charge disproportion on the tetrahedral sites, 共3兲 the displacements of the Fe1-Fe8and Fe17-Fe24 sites and the charge dispropor-tions of the Fe1-Fe8 sites are smaller than the ones of the Fe9-Fe16sites. Starting from our best model, a fit of the pa-rameters of the other iron sites would lead to a model with uncertainties larger than their variation from the original
Pmca model.
An important unresolved issue is whether the charge or-dering in oxides is driven by electrostatic repulsions between the charges共Wigner crystallization兲 or by the strains arising from electron-lattice interactions共such as Jahn-Teller distor-tions兲 involving different localized electronic states. For magnetite we obtained different values of charge dispropor-tions for octahedral iron posidispropor-tions. These results agree with nuclear magnetic resonance7 and Mössbauer8 probes of the
iron hyperfine fields that revealed many distinct components below 120 K that are associated with more than two charge configurations, intermediate between Fe+2 and Fe+3. More-over the observed coupling effect of the CO and the geo-metrical distortions for positions of the types Fe3 and Fe4 is in agreement with the work of McQueeney et al.19They have
observed a large gap in the acoustic spin wave branch of magnetite below the Verwey transition. It was concluded that in the monoclinic phase, the spin wave would be affected by charge ordering and small crystalline distortions, because both these factors modify the superexchange.
Considering the charges and positions, we obtain a total electric polarization of 1.5 C/cm2 along the a direction. Previous studies have given the orientation of the moment, not its value. So we can just argue that the obtained value is reasonable as compared to known values in ferroelectric compounds.
FIG. 10.共Color online兲 Energy variation of the simulated inten-sities 共full line兲 and corresponding experiment 共dotted兲 of the 共−4,4,2兲 Bragg reflection present in the Pmca 共and also in the high-temperature cubic phase兲 space group around the Fe K edge. The three curves are the result of models共a兲 with no displacement, 共b兲 the best displacement model 共very close to the previous one兲 and共c兲 with a larger displacement model.
FIG. 11. 共Color online兲 Energy variation of the simulated inten-sities 共full line兲 and corresponding experiment 共dotted兲 for two Bragg reflections of the Cc space group. The two simulated curves result from the fit of the displacements and of the charge on the tetrahedral sites. No charge disproportion is found. The displace-ment permits to get a satisfactory agreedisplace-ment only for some reflec-tion as the共−5,2,5/2兲, but it is never possible to get a good agree-ment on the majority of the reflections.
IX. CONCLUSION
We have modeled the low-temperature structure of mag-netite within a Cc unit cell and compared our simulations with resonant x-ray scattering data, in an attempt to further pursue the complete resolution of the structure below the Verwey transition temperature. Starting from the structure proposed by Wright et al.,20 Pmca, we have inferred a
pat-tern of displacements that is in agreement with the Cc 2 ⫻2 larger unit cell. In addition, and by taking advantage of
the possibilities of RXS concerning the determination of the charge, we have completed the charge ordering pattern pre-viously initiated in Ref.9. Our work shows also that quanti-tative RXS is a useful complementary tool helping in the resolution of structures when classical x-ray and neutron dif-fraction are not able to reach alone the final solution. We have shown here that using all the spectra shape around the edge, we can give new pieces of information even for mate-rials having twinning, small crystallites and possessing a large number of nonequivalent atoms.
1F. Walz, J. Phys.: Condens. Matter 14, R285共2002兲.
2E. J. W. Verwey, Nature 共London兲 144, 327 共1939兲; E. J. W.
Verwey and P. W. Haayman, Physica 共Amsterdam兲 8, 979 共1941兲.
3M. Imada, A. Fujimori, and Y. Tokura, Rev. Mod. Phys. 70,
1039共1998兲.
4M. Coey, Nature共London兲 430, 155 共2004兲.
5I. Leonov, A. N. Yaresko, V. N. Antonov, M. A. Korotin, and V.
I. Anisimov, Phys. Rev. Lett. 93, 146404共2004兲; I. Leonov, A. N. Yaresko, V. N. Antonov, and V. I. Anisimov, Phys. Rev. B
74, 165117共2006兲.
6Horng-Tay Jeng, G. Y. Guo, and D. J. Huang, Phys. Rev. Lett.
93, 156403共2004兲; Phys. Rev. B 74, 195115 共2006兲.
7P. Novák, H. Stepánková, J. Englich, J. Kohout, and V. A. M.
Brabers, Phys. Rev. B 61, 1256共2000兲.
8F. J. Berry, S. Skinner, and M. F. Thomas, J. Phys.: Condens.
Matter 10, 215共1998兲.
9E. Nazarenko, J. E. Lorenzo, Y. Joly, J.-L. Hodeau, D. Mannix,
and C. Marin, Phys. Rev. Lett. 97, 056403共2006兲.
10R. J. Goff, J. P. Wright, J. P. Attfield, and P. G. Radaelli, J. Phys.:
Condens. Matter 17, 7633共2005兲.
11J. García, G. Subías, M. G. Proietti, J. Blasco, H. Renevier, J. L.
Hodeau, and Y. Joly, Phys. Rev. B 63, 054110共2001兲.
12G. Subías, J. García, J. Blasco, M. G. Grazia Proietti, H.
Renevier, and M. Concepción Sánchez, Phys. Rev. Lett. 93, 156408共2004兲.
13J. Schlappa, C. Schüssler-Langeheine, C. F. Chang, H. Ott, A.
Tanaka, Z. Hu, M. W. Haverkort, E. Schierle, E. Weschke, G. Kaindl, and L. H. Tjeng, Phys. Rev. Lett. 100, 026406共2008兲.
14D. J. Huang, H.-J. Lin, J. Okamoto, K. S. Chao, H.-T. Jeng, G. Y.
Guo, C.-H. Hsu, C.-M. Huang, D. C. Ling, W. B. Wu, C. S. Yang, and C. T. Chen, Phys. Rev. Lett. 96, 096401共2006兲.
15G. Kh. Rozenberg, M. P. Pasternak, W. M. Xu, Y. Amiel, M.
Hanfland, M. Amboage, R. D. Taylor, and R. Jeanloz, Phys. Rev. Lett. 96, 045705共2006兲.
16P. Piekarz, K. Parlinski, and A. M. Oleś, Phys. Rev. Lett. 97,
156402共2006兲; Phys. Rev. B 76, 165124 共2007兲.
17M. Bimbi, G. Allodi, R. De Renzi, C. Mazzoli, and H. Berger,
Phys. Rev. B 77, 045115共2008兲.
18L. Craco, M. S. Laad, and E. Müller-Hartmann, Phys. Rev. B 74,
064425共2006兲.
19R. J. McQueeney, M. Yethiraj, S. Chang, W. Montfrooij, T. G.
Perring, J. M. Honig, and P. Metcalf, Phys. Rev. Lett. 99, 246401 共2007兲; 100, 069901共E兲 共2008兲; R. J. McQueeney, M. Yethiraj, W. Montfrooij, J. S. Gardner, P. Metcalf, and J. M.
Honig, Phys. Rev. B 73, 174409共2006兲.
20J. P. Wright, J. P. Attfield, and P. G. Radaelli, Phys. Rev. Lett.
87, 266401共2001兲; Phys. Rev. B 66, 214422 共2002兲.
21Y. Miyamoto and M. Shindo, J. Phys. Soc. Jpn. 62, 1423共1993兲. 22J. M. Bijvoet, Proc. R. Acad. Sci. Amsterdam B52, 313共1949兲. 23W. A. Hendrickson, Science 254, 51共1991兲.
24J.-L. Hodeau, V. Favre-Nicolin, S. Bos, H. Renevier, E. Lorenzo,
and J.-F. Berar, Chem. Rev. 共Washington, D.C.兲 101, 1843 共2001兲.
25Y. Murakami, H. Kawada, H. Kawata, M. Tanaka, T. Arima, Y.
Moritomo, and Y. Tokura, Phys. Rev. Lett. 80, 1932共1998兲.
26Y. Joly, S. Grenier, and J. E. Lorenzo, Phys. Rev. B 68, 104412
共2003兲.
27M. v. Zimmermann, C. S. Nelson, J. P. Hill, Doon Gibbs, M.
Blume, D. Casa, B. Keimer, Y. Murakami, C.-C. Kao, C. Ven-kataraman, T. Gog, Y. Tomioka, and Y. Tokura, Phys. Rev. B 64, 195133共2001兲.
28S. B. Wilkins, P. D. Spencer, P. D. Hatton, S. P. Collins, M. D.
Roper, D. Prabhakaran, and A. T. Boothroyd, Phys. Rev. Lett.
91, 167205共2003兲.
29Doon Gibbs, D. R. Harshman, E. D. Isaacs, D. B. McWhan, D.
Mills, and C. Vettier, Phys. Rev. Lett. 61, 1241共1988兲.
30D. H. Templeton and L. K. Templeton, Acta Crystallogr., Sect.
A: Found. Crystallogr. 41, 365共1985兲.
31V. E. Dmitrienko, Acta Crystallogr., Sect. A: Found. Crystallogr.
39, 29共1983兲.
32M. Blume, in Resonant Anomalous X-Ray Scattering, edited by
G. Materlik, J. Sparks, and K. Fisher 共Elsevier, Amsterdam, 1994兲, p. 495.
33S. Di Matteo, Y. Joly, and C. R. Natoli, Phys. Rev. B 72, 144406
共2005兲.
34S. Grenier, A. Toader, J. E. Lorenzo, Y. Joly, B. Grenier, S.
Ravy, L. P. Regnault, H. Renevier, J. Y. Henry, J. Jegoudez, and A. Revcolevschi, Phys. Rev. B 65, 180101共R兲 共2002兲.
35S. Fagot, P. Foury-Leylekian, S. Ravy, J.-P. Pouget, E. Lorenzo,
Y. Joly, M. Greenblatt, M. V. Lobanov, and G. Popov, Phys. Rev. B 73, 033102共2006兲.
36J. Philip and J. Rundgren, in Proceedings of the Conference on
Determination of Surface Structure by LEED, Yorktown Heights, 1980, edited by P. M. Marcus 共Plenum, New York, 1984兲.
37T. N. Horsky, G. R. Brandes, K. F. Canter, C. B. Duke, A. Paton,
D. L. Lessor, A. Kahn, S. F. Horng, K. Stevens, K. Stiles, and A. P. Mills, Phys. Rev. B 46, 7011共1992兲.
38Y. Joly, Phys. Rev. B 63, 125120共2001兲; The code can be freely
downloaded at the web address www.neel.cnrs.fr/fdmnes
39L. Hedin and S. Lundqvist, J. Phys. C 4, 2064共1971兲. 40C. Medrano, M. Schlenker, J. Baruchel, J. Espeso, and Y.
Miya-moto, Phys. Rev. B 59, 1185共1999兲.
41F. Delille, B. Dieny, J.-B. Moussy, M.-J. Guittet, S. Gota, M.
Gautier-Soyer, and C. Marin, J. Magn. Magn. Mater. 294, 27 共2005兲.