HAL Id: hal-02354946
https://hal.archives-ouvertes.fr/hal-02354946
Submitted on 13 Nov 2019HAL is a multi-disciplinary open access
archive for the deposit and dissemination of sci-entific research documents, whether they are pub-lished or not. The documents may come from teaching and research institutions in France or abroad, or from public or private research centers.
L’archive ouverte pluridisciplinaire HAL, est destinée au dépôt et à la diffusion de documents scientifiques de niveau recherche, publiés ou non, émanant des établissements d’enseignement et de recherche français ou étrangers, des laboratoires publics ou privés.
A liquid contact line receding on a soft gel surface:
dip-coating geometry investigation
Tadashi Kajiya, Philippe Brunet, Laurent Royon, Adrian Daerr, Mathieu
Receveur, Laurent Limat
To cite this version:
Tadashi Kajiya, Philippe Brunet, Laurent Royon, Adrian Daerr, Mathieu Receveur, et al.. A liquid contact line receding on a soft gel surface: dip-coating geometry investigation. Soft Matter, Royal Society of Chemistry, 2014, 10 (44), pp.8888-8895. �10.1039/c4sm01609b�. �hal-02354946�
Liquid Contact Line Receding on a Soft Gel Surface: Dip-Coating
Geometry Investigation
Tadashi Kajiya(a,b), Philippe Brunet(a), Laurent Royon(a),
Adrian Daerr(a), Mathieu Receveur(a) and Laurent Limat(a) (a) Laboratoire Mati`ere et Syst`emes Complexes (MSC),
UMR 7057 CNRS, Universit´e Paris Diderot,
Bˆatiment Condorcet,
10 rue Alice Domon et L´eonie Duquet, 75205 Paris cedex 13, France
(b) Max Planck Institute for Polymer Research, Ackermannweg 10,
55128 Mainz, Germany
(Dated: September 7, 2014)
Abstract
We studied the dynamics of liquid contact line receding on a hydrophobic soft gel (SBS-paraffin). In order to realize a well-defined geometry with an accurate control of velocity, a dip-coating setup was implemented. Providing the elastic modulus is small enough, a significant deformation takes place near the contact-line, which in turn drastically influences the wetting behaviour. Depending on the translation velocity of the substrate, the contact line exhibits different regimes of motions. Continuous motions are observed at high and low velocities, meanwhile two types of stick-slip motion - periodic and erratic, appear at intermediate velocities. We suggest that the observed transitions could be explained in terms of the competition between different frequencies, i.e., the frequency of the strain field variation induced by the contact line motion and the crossover frequency of gel related to the material relaxation. Our results provide systematic views on how the wetting of liquid is modified by the rheological properties of a complex soft substrate.
I. INTRODUCTION
Gels are intriguing state of matter which consists of a three-dimensional cross-linked net-work expanded throughout its whole volume by a fluid [1–3]. Due to their unique mechanical and osmotic properties, gels have numerous applications ranging from medical science [4, 5] (e.g. soft contact lens, artificial cartilage) to pharmaceutical and food chemistry (e.g. drug delivery, food capsuling) [6–8]. For these applications, the key is the proper characterization and tuning of the gel interfaces, as they determine the friction [8, 9], adhesion [10], surface tension [11] and wetting [12]. Also, from a viewpoint of fundamental questions on wetting, gels are interesting model systems to study how singular the liquid wetting behaviour is, compared to that on infinitely hard solids [13, 14].
Wetting on a soft surface (of elastic modulus G smaller than 100 kPa) has been investi-gated for decades [15–18], and still presently it is attracting a great attention. In order to provide a clear view how the three phase contact line behaves on highly deformable surfaces, active investigations are carried out on various types of materials such as gels, elastomer, and thin polymer films [19–22]. Experiments on spreading [23], evaporation [24, 25], con-densation and icing [26, 27] of tiny sessile droplets on those surfaces have been realized. According to the primitive modelling by de Gennes and Shanahan [28], the “elasto-capillary deformation” plays an important role. The liquid surface tension γ pulls up the substrate, forming a surface ridge of typical spatial extent γ/G.
In the case of wetting on gel surfaces, their complex rheological properties largely affects the statics and dynamics of contact line [29]. Previously, we have studied the forced spread-ing of water sessile drops inflated at constant rate on hydrophobic poly(styrene-butadiene-styrene)(SBS) - paraffin gels [30]. Unlike the case of elastomer [31], we have observed that the contact line exhibits different regimes of motions depending on the spreading velocity: two types of continuous motions and a stick-slip motion. Therein, one of the transitions seems to depend on the crossover frequency fcross at which the gel mechanical response
changes from elastic to viscous. Similar stick-slip behaviour of the contact line was reported by Pu et al. in the situation of wetting on thin polymer films [22, 32].
Toward a general interpretation of the wetting dynamics, and especially of which length and time scales are associated with such transitions, it is necessary to develop an experiment in an well-defined geometry and with an accurate control of the contact line velocity over
a wide range. Spreading droplet is not an ideal situation for this, as the size of the system continuously changes and the mean contact line velocity is not easily set to a constant value. Furthermore, the strongly curved geometry of the droplet surface may influence the contact line behaviour in a complex way.
In the present article, we implemented a dip-coating experiment, in which the gel sub-strate is withdrawn from a water bath at a constant translation velocity. Similar to the experiment on spreading droplets, the contact line exhibits two continuous motions at high and low velocity and stick-slip motion at intermediate velocity. In addition, we found that the stick-slip motion is distinguished as two types; large and regular stick-slip motions oc-curring coherently in the entire part of the contact line, otherwise small and irregular ones triggered by localized pinning spots. We discuss how the transitions are determined by the parameters such as the frequency of the strain field near the moving contact line. Finally, we propose a qualitative modelling which predicts the existing range of the stick-slip regimes, in reasonable agreement with the experiments.
II. EXPERIMENTAL SECTION
A. Material
Poly(styrene-butadiene-styrene)(SBS)-paraffin gels were used for the gel substrates and distilled water (Milli-Q Integral; Millipore, USA) was used for the wetting liquid. SBS powders (G1682; Kraton Polymers, USA) were dissolved in paraffin (Norpar15; ExxonMobil, USA) being heated in a water bath at 90◦C. After SBS powders were completely dissolved, the solution was poured into a gel mold and was cooled down to ambient temperature. The gel mold consists of two glass plates separated by a rubber spacer. The dimension of gel plate was 60 mm in length, 20 mm in width and 2.5 ± 0.5 mm in thickness. In our previous publication [30], we have checked by an optical profiler that the typical roughness of the gel surface prepared by this procedure was of order 10 nm , which is far smaller than the typical length of the elasto-capillary deformation γ/G. The concentration of SBS polymer by mass cpol was varied from 8% to 25%.
The rheology of SBS-paraffin gels were measured by a strain-controlled rheometer (Phys-ica MCR 500; Anton Paar, Austria) with a stainless steel cone plate and flat sample cell.
The diameter of the plate is 50 mm, the cone angle is 1◦, and the gap between the cone and sample cell was set to 0.052 mm. A shear strain amplitude was set to 1%. The measure-ments were conducted at temperature 25 ± 0.2◦C and performed at frequencies from 10−4 Hz to 100 Hz.
In fig. 1, examples of the curves of storage modulus G’ and loss modulus G” of SBS-paraffin gels are plotted for two polymer mass concentrations: cpol = 10% and 12%. The
typical values of the storage modulus G’ at f = 1 Hz and crossover frequency fcross at which
G”/G’ = 1 are shown in tab. I for cSBS = 8, 10, 12 and 15%, respectively. Roughly speaking,
when our gel is probed at a frequency f < fcross, it behaves as a liquid, and as a solid for
f > fcross.
B. Dip-Coating Setup
The dip-coating setup illustrated in fig. 2, allows for the retraction of a straight contact-line over a typical width of 2 cm at constant and well-controlled velocity. The gel substrate, which is attached to a glass plate, was mounted on a translation stage (PI ref. PLS-85 2” SM 1 HLS), allowing for an accurate control of the velocity in a large range from 10−4 mm/s to 10 mm/s. Note that the gel surface is oriented upward. The substrate was dipped into a water bath contained in a parallelepiped glass container of dimension 100 × 100 × 50 mm. Then, it was withdrawn from the bath at a constant translation velocity v.
The front view of the contact line and the side view of the liquid meniscus was monitored by two CCD cameras (Model SLA1390 and PLA1000; Basler, Germany) with magnification lenses (CCTV lens; Avenir, France and Opto-zoom 70XL; Stemmer, France). To ease a clear visualization of the meniscus, the stage was inclined at α = 12◦ from the vertical axis. This inclination is small enough to not alter the observed behaviours compared to a vertical set up. The component of gravity tangent to the plate being only modified as the cosine of alpha, i.e. of less than α2/2 ≈ 3%. All measurements were conducted at room temperature
25 ± 1◦C and relative humidity 27 ± 8◦%.
We finally remark that the gel creeping under the action of gravity can be neglected during the dip-coating process. The typical value of the gel viscosity ηs is of order 100 kPas
(cpol = 10%). For the gel to sag away over the length scale of the liquid meniscus lsag(t) ≈ 2.5
estimated by the Reynolds thinning law [33]: lsag(t) ∼ ρge2t/ηs, where ρ is the density: 0.9
g/ml, g the gravity constant, e the gel thickness: 3 mm and t the required time).
III. EXPERIMENTAL RESULTS
A. Different contact line motions: stick-slip vs continuous
Figure 3 shows typical sequential pictures of the front view of the contact line and side view of the meniscus. The gel substrate is withdrawn from water bath at translation velocity v = 0.015 mm/s, and cpol = 10%. While the gel substrate moves up, the contact line of the
water meniscus exhibits a stick-slip behaviour. Firstly, the contact line is pinned at a certain position on the gel surface (stick phase). The meniscus goes up at a same velocity as v, meanwhile the contact angle θ continues decreasing. When θ reaches to a critical value close to 40◦, the contact line suddenly slips down over a length of order 1 mm (slip phase) and θ goes back to a value ≈ 75◦ before the onset of the stick phase. Successively, the contact line repeats this stick-slip motion.
In order to look at quantitatively, dip-coating experiments were conducted at different translation velocities v. From the sequential pictures, the position of the contact line z and the contact angle θ were measured as a function of time. (Note: As shown in fig. 2, the z axis is taken parallel to the substrate, which is slightly inclined α = 12◦ from the vertical axis. The actual height of the meniscus is thus z cos α.)
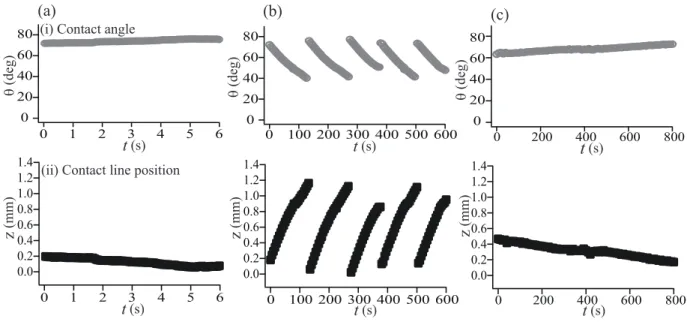
Figure 4 shows plots of z and θ on gels of cSBS = 10% at three different translation
velocities: (a) v = 3 mm/s, (b) 0.01 mm/s, and (c) 0.001 mm/s. The value z was obtained by tracing the position of contact line in several vertical sections in the front view of the meniscus, then by averaging the measured values. For a large meniscus raising to high z, the contact angle θ was measured directly from the picture. For a small meniscus in which one cannot directly measure θ, θ was derived from z by using the formula of meniscus profile on an inclined substrate [34],
sin(θ + α) = 1 − (z/√2lcap)2, (1)
where lcap=pρg/γ ≈ 2.5 mm is the capillary length of water and α = 12◦ is the inclination
The contact line remarkably changes its behaviour with the change of the translation velocity v:
• When the substrate moves up at a high velocity (e.g. v = 3 mm/s), the values of the contact line position z and of contact angle keep constant: z ≈ 2 mm, θr ≈ 75◦
(fig. 4(a)). It indicates that during the withdrawn process, the contact line recedes continuously on the moving gel surface at a constant receding angle. When we look at the gel surface after the dip-coating process, entirely removing the substrate from the bath, the surface looks flat and no visible trace remains.
• At an intermediate velocity (v = 0.01 mm/s), the contact line exhibits the stick-slip behaviour as it is explained previously (fig. 4(b)). After the dip-coating process, the gel surface shows a series of stripes of straight lines corresponding to the successive positions of the meniscus.
• At a low velocity (v = 0.001 mm/s), again the contact line recedes continuously (fig. 4(c)). While the contact line recedes, the contact angle keeps almost the same value θr. However, θr is slightly lower than that of continuous regime at high v. After the
dip-coating process, the meniscus leaves a single large ridge on the gel surface.
B. Two types of stick-slip motions at intermediate v
If we carefully look at the contact line behaviour at intermediate velocities (0.003 mm/s ≤ v ≤ 0.5 mm/s for gels of cpol = 10%), the stick-slip motion can be classified within two
types: regular and irregular. Figure 5 illustrates the major differences between these two stick-slip motions.
When the translation velocity is relatively slow (v = 0.03 mm/s: Figure 5(a)), the stick-slip motion is regular and periodic. The duration of one stick phase, the variation of the contact angle during the stick phase, and the length of the slip are rather similar for each repetitive event. In fig. 5(a) for instance, the contact angle varies from θr≈ 75◦ to θr0 ≈ 40◦
during the stick phase, then successively the contact line slips over a length of 1 mm. At this translation velocity, the stick-slip motions are also spatially correlative. When we compare the position of the contact line at different points (i) and (ii) which are separated by a 1 mm distance, it is observed that each stick and slip motions nearly occurs simultaneously (with
respect to the time between each jump). The slip motion on this sample rapidly propagates laterally along the contact line, and the contact line at point (ii) slightly lags from (i) to less than one second.
On the other hand, when the translation velocity is large enough (v = 0.06 mm/s: fig. 5(b)), the stick-slip motion becomes irregular. In this regime, the contact line exhibits small stick-slip motions, but the duration of the stick phase and the slippage length both vary largely in each jump. Also, no obvious strong spatial correlation between consecutive jumps could be noticed. Having a look at the sequential images in fig. 5(b), only a small area close to the point (ii) slips. Therefore, the slip motion does not reach up to the point (i). Nevertheless, comparing the contour of the plots, some correlation still remains, suggesting a local mechanism (possibly defect-induced). This effect is similar to the classical pinning transition that has been observed in the wetting process on rough solid surfaces [36, 37]. Here, the spatial range can extent to nearly 400 µm (hence much wider than the typical size of a gel surface roughness).
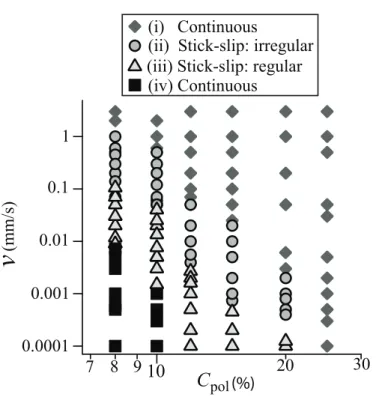
C. Classification of contact line motions against v and cpol
In order to clarify the transition between different regimes, the motions of the contact line were measured as a function of translation velocity v and of polymer concentration in the gel cpol, the latter ruling (among other mechanical properties) the elastic modulus and
crossover frequency fcross (see tab. 1). Figure 6 shows a diagram of the contact line motions
versus parameters v and cpol.
As the value of v shifts from high to low, the contact line exhibits the four regimes of motions. (i) Continuous motion at high v: The entire part of the contact line recedes smoothly. The contact line pinning by local defects is not observed within the resolution of the CCD camera. (ii) Irregular stick-slip motion: A part of the contact line is locally pinned. Then after certain duration, the pinning spot is released. Precisely, we determined the onset of the irregular stick-slip motion at which the local pinning spot appears with a scale larger than 10 pixels in the acquired image (30 µm in the real scale). (iii) Regular stick-slip motion: The pinning is not localized. The contact line is pinned over the entire width of the gel, then slips coherently. Looking at the temporal evolution, the stick-slip occurs periodically. (iv) Continuous motion at low v: The contact line behaviour is same as
that in regime (i).
Comparing the data for different polymer concentration, it is shown that the critical velocities largely depends on cpol: the softer the gel, the higher the velocity threshold for
the transition from continuous to stick-slip. For instance, the threshold between the regimes (i)/(ii) is v ≈ 0.5 mm/s for gels of cpol = 10% and v ≈ 1 mm/s for gels of cpol = 8%. However,
on a rigid gel of higher polymer concentration, the critical velocities for transition shift to a considerably small value, and can sometimes even not being measured. Especially in the case of cpol = 25%, the continuous motion covers the entire range of v in our experiments.
IV. DISCUSSION
In this section, we discuss the mechanism of different regimes of contact line motions by comparing two types of frequencies, then we give a simple modelling to predict the condition for stick-slip regime.
A. Interpretation by the characteristic frequency of strain field
As shown in tab. I, SBS-paraffin gel has a low elastic modulus of several kPa and is thus highly deformable. The gel surface is pulled up by the unbalanced Young’s force exerted in the vicinity of the contact-line normal to the substrate, resulting in the formation of a sharp ridge (fig. 7) [19–21]. By analogy with the wetting of drops on elastomer [28], the profile of the gel surface ridge is initially determined by the balance between the interfacial tensions and the elastic resistance of the gel. This was experimentally confirmed by the extraction of the deformation profile in our previous work, see fig. 6 in ref. [30]. However, when the contact line stays at the same position over a longer time, the elastic resistance gradually relaxes, storing a growing part of irreversible deformation [29]. The typical time for the material relaxation is determined as τgel = 1/fcross, where fcross is the crossover frequency
at which G”/G’ equals to 1.
In order to compare the contact line dynamics with mechanical response and deformation relaxation of the gel, we estimate the characteristic frequency of the deformation observed on the gel surface around the moving contact line. The characteristic frequency (or inverse time) associated to the contact-line motion over a ridge deformation of scale l is :
f = v/l. (2) As the surface ridge near the contact line is known to be logarithmic [17, 28], l could be the largest scale available in the experiment (fig. 7). For a micrometer or millimeter sized droplet like as in our previous experiments, l was naturally chosen as the radius of the droplet l ≈ R. In the dip-coating geometry where a large amount of liquid is in contact with the gel substrate, the most natural choice should be the scale of a liquid meniscus which is of order the capillary length l ≈ lcap =pρ/γ ≈ 2.5 mm.
From the data points in fig. 6, we calculated the characteristic frequency f = v/lcap.
Considering the ratio of f to the gel crossover frequency, a dimensionless number called Deborah number is calculated as,
De = f /fcross, (3)
and is plotted in fig. 8. Data for cpol = 8, 10, 12 and 15% are superimposed in the graph.
The value De quantifies to what extent the material relaxes in a given time of interest 1/f [35]. The four regimes of the contact line motions (i)-(iv) are clearly separated by De. The point De = 1, at which the two frequencies have similar values, is found just in the middle of the two continuous/stick-slip transitions (i)/(ii) and (iii)/(iv). It is also close to the critical point separating the two stick-slip regimes (ii)/(iii).
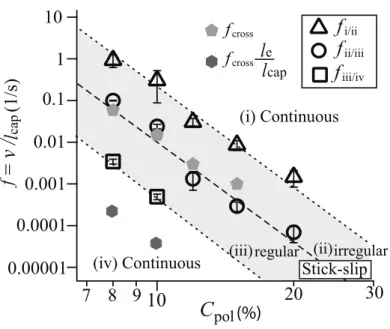
We built characteristic frequencies associated to the transitions between the different regimes - and corresponding to the different velocity thresholds : fi/ii, fii/iii and fiii/iv.
Figure 9 shows these characteristic frequencies as a function of cpol. It is observed that the
three frequencies decrease with increasing cpol. By comparing with the value of gel crossover
frequency fcross, all of them are proportional to fcross. This is the strong result of the present
experiments : fcross is the key factor that governs the three transitions observed here.
Based on the results shown in figs. 8 and 9, the appearance of the different contact line motions can be understood in terms of the competition between the frequencies f and fcross.
Figure 10(a) shows a schematic view of a possible mechanism in each regime.
• Regime (i): When the contact line moves very fast and its characteristic frequency is far larger than the gel crossover frequency (De 1), the gel mechanical response to the contact line motion is nearly that of an elastic solid. In this situation, the
ridge on the elastic surface follows exactly the motion of the contact line at which the pulling force is locally applied. The elastic deformation propagates up to a velocity of the elastic wave pG/ρ ∼ 1 m/s, which is much higher than the velocity prescribed in these experiments. As a result, the contact line moves continuously. This is also consistent with what is observed on the surface of purely elastic materials [31]. • Regimes (ii)-(iii): When the frequency of the contact line motion comes close to the
crossover frequency (De ≈ 1), the response of the gel surface is not purely elastic. While the contact line moves over a distance proportional to the scale of surface ridge lcap, the elastic stress starts to relax and a part of the surface deformation becomes
irreversible. The surface ridge behaves somewhat as a “surface defect”, which locally pins the contact line (stick phase), making it possible to reach apparent contact angles much lower than that on a infinitely stiff gel. The contact line has to jump over this defect for moving (slip phase), the slip phase corresponding to the time required for the contact-angle to recover a value close to the receding one on a flat surface.
Here, we notice that the typical size of the pinned region depends on the value of De. At De > 1, the relaxation process is not fast enough to pin the entire part of the contact line. As a result, the contact line exhibits local and irregular stick-slips. At De < 1, the irreversible deformation reaches a sufficiently large scale to pin the contact line entirely. Therefore, it induces the regular and coherent stick-slip motion over the whole line.
• Regime (iv): When the contact line moves very slowly and f is sufficiently low (De 1), the deformation of the gel surface totally relaxes until the contact line moves over a distance of order lcap. In this situation, the gel substrate behaves nearly like a film
of very viscous liquid. As the contact line moves, a flow is driven below the gel surface due to the position shift of the surface force. The ridge is transported by this capillary flow, following the motion of the contact line continuously.
B. Phenomenological modelling of the stick-slip regime window
In order to explain why the stick-slip regime appears within a finite range of f , we should take into account the fact that the spatial spectrum of the surface ridge k = 1/l does not
consist of a single mode, rather it has a continuous spectrum ranging over different length scales (fig. 10(b)).
In coherence with the previous section, we consider that the lower limit of the spectrum associated with the ridge is of order the scale of liquid meniscus kmin ∼ 1/lcap. To have
an idea of what could be the higher limit kmax, we refer to the recent theoretical studies of
wetting on soft surfaces [38–40]. There, the authors proposed that the small scale truncation of the surface deformation would be ruled by the surface tension of the substrate γs. When
γs and substrate/liquid interfacial tension γsl is taken into account, the logarithmic profile
of the surface ridge is still valid [40], but with a shift to a distance le which is a cut-off scale
for the divergence, connecting to the Neumann equilibrium generally observed in wetting of liquid on another liquid sheet,
~γ + ~γs+ ~γsl= ~0. (4)
The length le = γs/G is called the elasto-capillary length. For a SBS-paraffin gel, the
typical value of γsis 30 mN/m [41], giving the value of le ≈ 6 µm for G = 5 kPa for instance.
By introducing these two limits of the surface deformation spectrum, we expect that stick-slip motion is observed providing the gel crossover frequency is found between the two critical values
v/lcap < fcross < v/le. (5)
Equation 5 can be rewritten in terms of the characteristic inverse time (or frequency) of the surface deformation f = v/lcap, which yields the following condition for the stick-slip
appearance,
fcross
le
lcap
< f < fcross. (6)
Furthermore, we remark that the crossover frequency can be re-expressed as a ratio between the elastic modulus and viscosity of the gel: fcross = G/ηs. The lower limit in eq.
6 draws a condition on the capillary number of the substrate,
Cas =
ηsv
γs
It implies that the continuous/stick-slip transition at low f is determined by which force dominates the system, i.e., viscous forces in the substrate or capillary forces.
In order to check our theoretical prediction, we superposed the expected critical values for the boundaries of stick-slip regime fcrossle/lcap and fcross in fig. 9. As expected, the
domain of the regular stick-slip is entirely contained between the two limits.
The lower limit is higher than expected, which suggests that some prefactor should be considered in our analysis. One of the possibilities for this prefactor is the asymmetric profile of the surface ridge, as it was discussed by Bostwick et al. [42]. Since the receding contact angle on SBS-paraffin gel is smaller than 90◦ (fig. 4), the asymmetric profile of the elasto-capillary deformation and the unbalance between the interfacial tensions γs and γsl
could suggest a closer bound.
Finally, we mention that our qualitative interpretation is reminiscent of a theoretical analysis of wetting on visco-elastic substrate, recently reported by Karpitschka et al [43]. The same kind of continuous band of spatial mode is involved in the surface deformation, and a condition on the substrate capillary number is also found at the end. It would be interesting to compare both approaches for further theoretical development.
V. CONCLUSION
In this article, we have investigated the dynamics of a liquid contact line moving on a hydrophobic and visco-elastic (SBS-paraffin) gel substrate in a dip-coating geometry. De-pending on the translation velocity of the substrate v, the contact line exhibits different regimes of motions, i.e., continuous motion at high v, stick-slip motion at intermediate v and another continuous motion at low v. Furthermore, the stick-slip motion can be classified in two different kinds : large and periodic jumps occurring coherently in the entire part of the contact line, or irregular stick-slip by localized pinning spots.
We have conjectured that such transitions are determined by the competition between different frequencies, i.e., the frequency f of the surface deformation induced by the moving contact line and the gel crossover frequency fcross = 1/τgel related to the material relaxation.
In particular, we have found that all the threshold values of f between different regimes are proportional to fcross.
the stick-slip regimes. Therein, we considered the continuous spectrum associated with the surface deformation that ranges from the meniscus size lcap to the elasto-capillary length le:
1/lcap< k < 1/le. Our model grasps essential features of the observed phenomena.
Acknowledgement
The funding of this project has been covered by a grant from labex SEAM (Science and Engineering for Advanced Materials) with reference ANR-11-LABX-086 of the program “Future Investment” with reference ANR-11-IDEX-0005-02 administrated by the French National Agency for Research (ANR).
[1] A. Suzuki and T. Tanaka, Nature, 1990, 346, 345-347. [2] E. S. Matsuo and T. Tanaka, Nature, 1992, 358, 482-485. [3] T. Yamaue and M. Doi, J. Chem. Phys., 2005, 122, 084703.
[4] T. Bai, P. Zhang, Y Han, Y. Liu, W. Liu, X. Zhao and W. Lu, Soft Matter, 2011, 7, 2825-2831. [5] J. Yang, M. Yamato, C. Kohno, A. Nishimoto, H. Sekine, F. Fukai and T. Okano, Biomaterials,
2005, 26, 6415-6422.
[6] Y. Nonomura, Y. Morita, T. Hikima, E. Seino, S. Chida and H. Mayama, Langmuir, 2010, 26, 16150-16154.
[7] H. M. Shewan and J. R. Stokes, J. Food Eng., 2013, 119, 781-792.
[8] T. Baumberger, C. Caroli and O. Ronsin, Eur. Phys. J. E: Soft Matter Biol. Phys., 2003, 11, 85-93.
[9] T. Yamaguchi, S. Ohmata and M. Doi, J. Phys.: Condens. Matter, 2009, 21, 205105. [10] T. Baumberger, C. Caroli and D. Martina, Nature Mat., 2006, 5, 552-555.
[11] Y. Yoshitake, S. Mitani, K. Sakai and K. Takagi, Phys. Rev. E: Stat., Nonlinear, Soft Matter Phys., 2008, 78, 041405.
[12] D. Szab´o, S. Akiyoshi, T. Matsunaga, J. P. Gong, Y. Osada and M. Zrinyi, J. Chem. Phys., 2000, 113, 8253-8259.
[13] T. Kajiya, A. Daerr, T. Narita, L. Royon, F. Lequeux and L. Limat, Soft Matter, 2011, 7, 11425-11432.
[14] J. B. Bostwick and K. E. Daniels, Phys. Rev. E: Stat., Nonlinear, Soft Matter Phys., 2013, 88, 042410.
[15] A.I. Rusanov, Colloid. J. USSR, 1975, 37, 614-622.
[16] M. E. R. Shanahan, J. Phys. D: Appl. Phys., 1987, 20, 945-950.
[17] A. Carr´e, J. C. Gastel and M. E. R. Shanahan, Nature, 1996, 379, 432-434. [18] C. W. Extrand and Y. Kumagai, J. Colloid Interface Sci., 1996, 184, 191-200.
[19] R. P. C´amara, G. K. Auernhammer, K. Koynov, S. Lorenzoni, R. Raiteri, and E. Bonaccurso, Soft Matter, 2009, 5, 3611-3617.
[20] E. R. Jerison, Y. Xu, L. A. Wilen and E. R. Dufresne, Phys. Rev. Lett., 2011, 106, 186103. [21] S. J. Park, B. M. Weon, J. S. Lee, J. Lee, J. Kim and J. H. Je, Nature Commun., 2014, 5,
4369.
[22] G. Pu and S. J. Severtson, Langmuir, 2008, 24, 4685-4692.
[23] B. B. J. Stapelbroek, H. P. Jansen, E. S. Kooij, J. H. Snoeijer and A. Eddi, Soft Matter, 2014, 10, 2641-2648.
[24] M. C. Lopes and E. Bonaccurso, Soft Matter, 2012, 8, 7875-7881.
[25] C. Duprat, A. D. Bick, P. B. Warren and H. A. Stone, Langmuir, 2013, 29, 7857-7863. [26] M. Sokuler, G. K. Auernhammer, M. Roth, C. Liu, E. Bonacurrso and H. J. Butt, Langmuir,
2010, 26, 1544-1547.
[27] J. Petit and E. Bonaccurso, Langmuir, 2014, 30, 1160-1168.
[28] M. E. R. Shanahan and P. G. de Gennes, C. R. Acad. Sci. Paris, 1986, 302, Ser. II, 517-521. [29] D. Long, A. Ajdari and L. Leibler, Langmuir, 1996, 12, 1675-1680.
[30] T. Kajiya, A. Daerr, T. Narita, L. Royon, F. Lequeux and L. Limat, Soft Matter, 2013, 9, 454-461.
[31] L. Q. Chen, G. K. Auernhammer and E. Bonaccurso, Soft Matter, 2011, 7, 9084-9089. [32] G. Pu, J. Ai and S. J. Severtson, Langmuir, 2010, 26, 12696-12702.
[33] P. G. de Gennes, F. B. Wyart and D. Quere, Capillarity and Wetting Phenomena, Springer, 2003.
[34] J. C. Berg, An Introduction to Interfaces and Colloids: The Bridge to Nanoscience, World Scientific Publishing, 2010.
[35] R. G. Larson, The Structure and Rheology of Complex Fluids, Oxford University Press, 1998. [36] S. Moulinet, A. Rosso, W. Krauth and E. Rolley, Phys. Rev. E: Stat., Nonlinear, Soft Matter
Phys., 2004, 69, 035103.
[37] R. Golestanian and E. Rapha¨el, Phys. Rev. E: Stat., Nonlinear, Soft Matter Phys., 2003, 67, 031603.
[38] A. Marchand, S. Das, J. H. Snoeijer and B. Andreotti, Phys. Rev. Lett, 2012, 108, 094301. [39] R. W. Style and E. R. Dufresne, Soft Matter, 2012, 8, 7177-7184.
[40] L. Limat, Eur. Phys. J. E: Soft Matter Biol. Phys., 2012, 35, 134.
[41] M. Talreja, I. Kusaka and D. L. Tomasko, Fluid Phase Equilibr., 2012, 319, 67-76. [42] J. B. Bostwick, M. Shearer and K. E. Daniels, Soft Matter, 2014, 10, 7361-7369. [43] S. Karpitschka, S. Das, B. Andeotti and J, H. Snoeijier, arXiv:1406.5547.
101 102 103 104 0.001 0.01 0.1 1 10 f (1/s) M odul i (P a) 12 % =10 % cpol G’’ G’
FIG. 1: Storage G0 and loss G00 moduli of SBS-paraffin gels. Curves of two polymer mass concen-trations 10% and 12% are shown.
TABLE I: Values of storage modulus G’ at 10 Hz and crossover frequency fcross where G”/G’ = 1 for SBS-Paraffin gels of different polymer concentrations.
cpol (%) 8 10 12 15
G’ (kPa) 2.99 4.38 8.00 15.1
CCD
Translate
at constant v
Front view Side view Water bath CCD 12 Gelz
FIG. 2: A schematic of the setup for the dip-coating experiment. The substrate is fixed on a translation stage. After dipping into a liquid bath, the substrate is withdrawn at a constant velocity. The contact line was monitored by two CCD cameras; one looking from the front, the other from the side.
Stick Slip Translation upward 500 µm Contact line Contact line (a) (c) (b) Contact line 2 mm
G
e
l
G e l G e l G e l water gelFIG. 3: Sequential pictures of the contact line on a gel of cpol = 10% at translation velocity v = 0.015 mm/s. Front and side views are shown. While the gel substrate is withdrawn from the water bath, the contact line exhibits (b) stick and (c) slip motion.
800 600 400 200 0 80 60 40 20 0 θ (de g) t(s) 1.4 1.2 1.0 0.8 0.6 0.4 0.2 0.0 6 5 4 3 2 1 0 t(s) z (m m ) 600 500 400 300 200 100 0 80 60 40 20 0 t(s) θ (de g) 80 60 40 20 0 6 5 4 3 2 1 0 t(s) θ (de g) 1.4 1.2 1.0 0.8 0.6 0.4 0.2 0.0 800 600 400 200 0 t(s) z (m m ) 1.4 1.2 1.0 0.8 0.6 0.4 0.2 0.0 600 500 400 300 200 100 0 t(s) z (m m ) (a) (b) (c)
(i) Contact angle
(ii) Contact line position
FIG. 4: Plots of the contact angle θ and of position of the contact line z against time. The gel of cpol = 10% is used, and the data at three different translation velocities are shown. The velocities are (a): 3 mm/s, (b): 0.01 mm/s and (c): 0.001 mm/s, respectively.
60 50 40 30 20 10 0 t (s) z (m m ) 1.0 0.8 0.6 0.4 0.2 0.0 z (m m ) 60 50 40 30 20 10 0 t (s) 1.0 0.8 0.6 0.4 0.2 0.0 1.0 0.8 0.6 0.4 0.2 0.0 120 100 80 60 40 20 0 z (m m ) t (s) 1.0 0.8 0.6 0.4 0.2 0.0 120 100 80 60 40 20 0 z (m m ) t (s) (a) (b) i ii i ii (a-i) (a-ii) (b-i) (b-ii) 1 mm 1 mm Translation upward
FIG. 5: Two different types of stick-slip motions on gels of cpol = 10%. (a) Regular and periodic regime observed at v = 0.03 mm/s. The period of each stick-slip is almost constant. Looking at the contact line motions in different points i and ii (as shown in inset (a-i) and (a-ii)), they also show strong spatial correlation. The different points i and ii slip at almost the same time. (b) Irregular and erratic regime observed at v = 0.06 mm/s. The period and distance of each stick-slip are irregular. Comparing the motion at different points i and ii (inset (b-i) and (b-ii)), they have quite weak spatial correlation.
1 0.1 0.01 0.001 0.0001 10 20 30 7 8 9 (i) Continuous
(ii) Stick-slip: irregular (iii) Stick-slip: regular (iv) Continuous (%)
C
polv
(m m /s )FIG. 6: Phase diagram of the contact line motions as a function of the translation velocity v and of gel polymer concentration cpol. The contact line behaviour is distinguished by 4 different regimes. (i) continuous motion at high v, (ii) irregular stick-slip, (iii) regular stick-slip, and (iv) another continuous motion at low v.
v
l
G e l Waterf = v /
(b) (a)l
cap cap R f = v / Rv
FIG. 7: Qualitative comparison of our geometry with that of ref. [30]. In both cases, the typical scale of the gel deformation is the largest scale available: (a) The radius R for the droplet geometry. (b) The meniscus size ≈ lcap for the dip-coating geometry.
Cont
ac
t l
ine
re
gi
m
e
10
-210
-110
010
110
210
310
-310
4De = f / f
Continuous
regular St-sl irregular St-sl (i) Continuous (ii) (iii) (iv) crossFIG. 8: Replot of the diagram in fig. 6 as a function of Deborah number. De is defined as the ratio of two frequencies De = f /fcross, where f = v/lcap is the characteristic frequency of the strain field near the contact line and fcross the crossover frequency of the gel. Data of cpol= 8, 10, 12 and 15% are superposed.
1 0.1 0.01 0.001 0.0001
10
20 30 7 8 9 (%)C
pol (1/ s) 0.00001 10 f=
v
/
f
i/iif
ii/iiif
iii/iv fcross (i) Continuous(iv) Continuous (iii) regularStick-slip(ii)irregular fcross
l
el
capl
ca
p
FIG. 9: Threshold values of the characteristic frequencies f = v/lcapbetween the different regimes of contact line motions (i)-(iv). fi/ii, fii/iii and fiii/iv are plotted as a function of gel polymer concentration cpol. The values fcross and fcrossle/lcap are superposed as filled dots.
Deformation relaxes, (ii)-(iii)
(iv)
(i) Elastic Propagation
S ti ck Slip Viscous flow (a) (b) v G el lcap le Water γ γs γsl
pins contact line
FIG. 10: (a) Possible mechanism for the different regimes of contact line motions. The appearance of the contact line motions (i)-(iv) can be understood in terms of the competition between the frequencies f and fcross. (b) Length scales associated with the spectrum of gel surface ridge k = 1/l. The lower limit of the spectrum is determined by the meniscus size lcap, while the upper limit is determined by the elasto-capillary length le at which the logarithmic profile is truncated by the substrate surface tension γs.


![FIG. 7: Qualitative comparison of our geometry with that of ref. [30]. In both cases, the typical scale of the gel deformation is the largest scale available: (a) The radius R for the droplet geometry.](https://thumb-eu.123doks.com/thumbv2/123doknet/15003841.676361/23.892.370.542.105.388/qualitative-comparison-geometry-typical-deformation-largest-available-geometry.webp)