R E S E A R C H A R T I C L E
Open Access
The multiplicity of alternative splicing decisions in
Caenorhabditis elegans is linked to specific
intronic regulatory motifs and minisatellites
Dominique A Glauser
Abstract
Background: Alternative splicing diversifies the pool of messenger RNA molecules encoded by individual genes. This diversity is particularly high when multiple splicing decisions cause a combinatorial arrangement of several alternate exons. We know very little on how the multiple decisions occurring during the maturation of single transcripts are coordinated and whether specific sequence elements might be involved.
Results: Here, the Caenorhabditis elegans genome was surveyed in order to identify sequence elements that might play a specific role in the regulation of multiple splicing decisions. The introns flanking alternate exons in transcripts whose maturation involves multiple alternative splicing decisions were compared to those whose maturation involves a single decision. Fifty-eight penta-, hexa-, and hepta-meric elements, clustered in 17 groups, were significantly over-represented in genes subject to multiple alternative splicing decisions. Most of these motifs relate to known splicing regulatory elements and appear to be well conserved in the related species Caenorhabditis briggsae. The usage of specific motifs is not linked to the gene product function, but rather depends on the gene structure, since it is influenced by the distance separating the multiple splicing decision sites. Two of these motifs are part of the CeRep25B minisatellite, which is also over-represented at the vicinity of alternative splicing regions. Most of the
remaining motifs are not part of repeated sequence elements, but tend to occur in specific heterologous pairs in genes subject to multiple alternative splicing decisions.
Conclusions: The existence of specific intronic sequence elements linked to multiple alternative splicing decisions is intriguing and suggests that these elements might have some specialized regulatory role during splicing.
Keywords: Alternate splice sites, Coordination of multiple choices, Regulatory elements, Worm, IMMAD, MASS, SASS
Background
The process of splicing determines what part of each gene is included in mature messenger RNA molecules. Alterna-tive splicing allows the generation of more than one tran-script isoform from a single gene by the inclusion or exclusion of alternate exons during transcript maturation. Regulated splicing decisions largely depend on nucleotide sequences located in alternate exons or in neighboring in-trons that recruit specific splicing factors [1-7]. Alternative splicing is a very widespread process among eukaryotes [8]. In human, most multi-exon genes are subject to alter-native splicing [9].
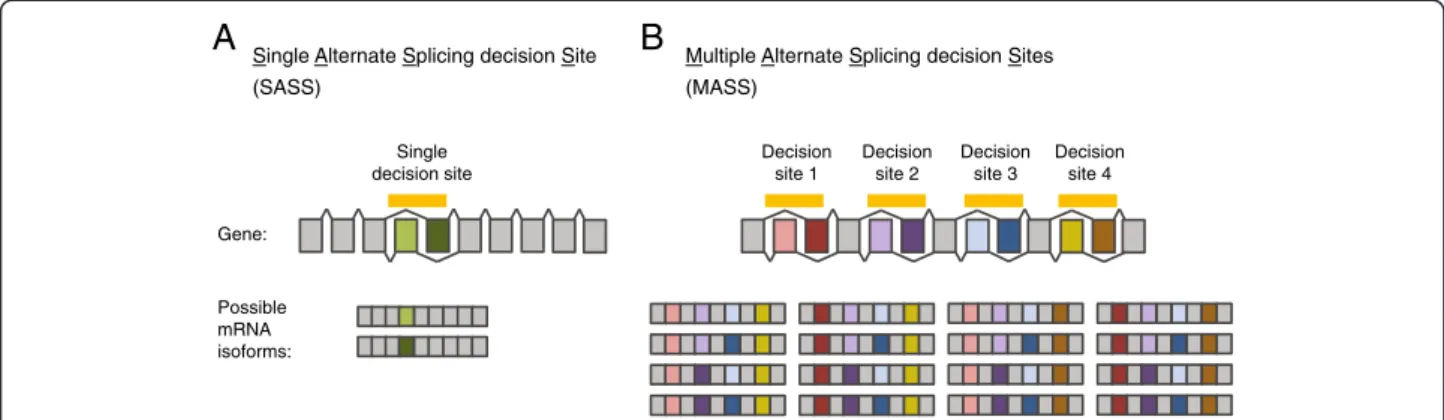
By swapping or skipping portions of transcribed genes, alternative splicing diversifies the repertoire of encoded proteins and its complexity, without requiring an extensive increase in genome size [10,11]. In genes with a Single Alternative Splicing decision Site (SASS), the number of isoforms is equal to the number of alternate exon defini-tions (see the illustration in Figure 1A). The number of possible isoforms can be much higher in genes with Mul-tiple Alternative Splicing decision Sites (MASS), due to the combinatorial arrangement of multiple alternate exons (see an example of MASS gene in Figure 1B). The overall physiological significance of the combinatorial complexity generated by alternative splicing is still a matter of debate. Indeed, in most instances, we know relatively little on the consequences of alternative splicing on protein functions, even less when several splicing decisions are combined.
Correspondence:[email protected]
Department of Biology, University of Fribourg, Chemin du Musée 10, 1700 Fribourg, Switzerland
© 2014 Glauser; licensee BioMed Central Ltd. This is an Open Access article distributed under the terms of the Creative Commons Attribution License (http://creativecommons.org/licenses/by/2.0), which permits unrestricted use, distribution, and reproduction in any medium, provided the original work is properly credited.
This combinatorial complexity also calls for coordinat-ing multiple spliccoordinat-ing decisions. Such coordination mecha-nisms are particularly important if specific combinations of alternate exons need to be selectively expressed, select-ively repressed, or spatially and temporally controlled. Sev-eral studies have provided direct or indirect evidence that the pattern of expressed isoforms for given genes might be generated from interdependent splicing decisions [12-15]. For example, a study by Fagnani and collaborators [13] has shown that, in mice, pairs of alternate exons in the same genes could be regulated in a coordinated manner in different tissues. Additionally, Fededa and collaborators [12] identified several genes with nonrandom distributions of mRNA isoforms combining two alternative regions and have suggested the existence of a polar mechanism by which upstream splicing events (in 5’) affect downstream splicing events (in 3’) during transcription.
Recent studies on one MASS gene, the Caenorhabditis elegans slo-1BK channel gene (involved in neurotransmis-sion), have provided insights on the nature of intragenic alternative splicing coordination mechanisms and demon-strated their functional significance in vivo [14,16]. Alter-native splicing decisions at three sites along slo-1 produce twelve possible mRNA isoforms: a reasonable complexity that was suitable for systematic and quantitative analyses of expression and function. Three major findings were re-ported. First, protein domains encoded by distant alternate exons functionally interact to influence the channel bio-physical properties [16]. In other words, the impact of sev-eral splicing decisions on the protein function is not simply the sum of the impact of each decision; rather, spe-cific isoforms gain unique properties. Thus, there are func-tional reasons for specific combinations of alternate exons to be selected during the maturation of slo-1 transcripts.
Second, the pattern of isoforms expressed in C. elegans can-not be accounted for by independent decisions across the three alternative splicing regions, demonstrating the inter-dependent nature of alternative splicing decisions in slo-1. Third, this coordination can be disrupted by a point muta-tion in a single intronic motif, which not only affects nearby splicing decisions, but also splicing decisions made at dis-tant sites [14]. The disruption of splicing coordination re-sults in physiological impairments, such as dysregulated neurotransmission. These findings highlight the functional significance of intragenic splicing coordination in vivo and suggest the existence of specific intronic motifs that are im-portant for coordinating intragenic splicing decisions.
The goal of the present study was to identify, at a gen-omic scale, intronic motifs that may specifically regulate multiple splicing decisions in C. elegans. Similarly to a study investigating splicing cis-regulatory motifs across Caenorhabditis species [17], the frequencies of penta-meric, hexapenta-meric, and heptameric sequence elements were compared between two groups of introns flanking alternate exons: introns from MASS and SASS genes. MASS and SASS genes only differ in the number of in-dependent splicing events (see an illustration of their definition in Figure 1). If mechanisms that are specific to multiple alternative splicing decisions (like splicing coordination) are very uncommon or do not rely on se-quences located in introns flanking alternate exons, then the sequence composition in the SASS and MASS groups should be similar. Conversely, if those mecha-nisms are more prevalent, then the sequence compos-ition should diverge between the two groups. In this case, motifs that are more frequent in the MASS group represent motifs with a potential regulatory role specific to the multiplicity of splicing decisions.
Single Alternate Splicing decision Site (SASS)
Multiple Alternate Splicing decision Sites (MASS) Gene: Possible mRNA isoforms:
A
B
Single decision site Decision site 1 Decision site 2 Decision site 3 Decision site 4Figure 1 The combination of multiple alternative splicing decisions diversifies the pool of encoded transcript isoforms. Scheme comparing Single Alternative Splicing decision Site (SASS) (A) and Multiple Alternative Splicing decision Sites (MASS) genes (B) and the corresponding possible mature messenger RNA isoforms. It gives an example of the combinatorial complexity resulting from multiple alternative splicing decisions. Constitutive exons are in grey, alternate exons are colored. The case of mutually exclusive alternate exons was chosen to be represented in this figure for the sake of simplicity. However, the definition of MASS and SASS genes used in the present study considers any type of alternative splicing events. By definition, MASS and SASS genes only differ in the number of independent splicing events (see the Methods section for details on the MASS and SASS discrimination procedure).
The results of the present study indicate that the se-quence composition of introns at the vicinity of alternate exons is indeed different whether only one or several alter-native splicing decisions are engaged. Motifs enriched in the MASS group were called IMMADs, for Intronic Motifs linked to Multiple Alternative splicing Decisions. Most IMMADs appear to be well conserved in the related species Caenorhabditis briggsae. IMMADs include several oligo-mers with known splicing regulation functions and one minisatellite (CeRep25B). In conclusion, this study suggests that several intronic cis-regulatory elements have a specific regulatory role associated with multiple alternative splicing decisions along single transcripts.
Results
Identification of Intronic Motifs linked to Multiple Alternative splicing Decisions (IMMADs)
A set of 2322 alternatively spliced genes, retrieved from WormBase (WS235 [18]) was classified according to the number of sites where splicing decisions occur (see Methods). This dataset included a total of 752 MASS genes and 1570 SASS genes. The analysis of the differ-ential sequence composition between the introns flank-ing alternate exons of MASS and SASS genes identified a total of 63 oligomers (22 pentamers, 22 hexamers, and 19 heptamers) clustered in 18 different motifs that are significantly enriched in the MASS group (p < 1E-5, Additional file 1). 644 out of the 752 MASS genes (86%) harbored at least one of these IMMADs in introns flanking alternate exons.
The presence of motifs enriched in the MASS group could indicate their implication in splicing regulation or, alternatively, reflect structural or functional differences be-tween the MASS and SASS genes. To control for these potential confounding effects, a more extensive compara-tive analysis of the MASS and SASS genes was performed. SASS and MASS genes had identical nucleotide compos-ition in introns flanking alternate exons, their chromo-somal distribution was similar, and a Gene Ontology (GO) term analysis showed no gene product function difference between the two groups. However, the size of the genes and the size of the introns flanking alternate exons were larger in the MASS group (Figure 2A and B). A stratified subsampling of the MASS and SASS genes was therefore performed in order to match the two length distributions in both groups (Figure 2C and D). When reiterated with the subsampled groups, the oligomeric motif analysis re-identified 58 out of the initial 63 elements (p < 1E-2, see Additional file 2), corresponding to 17 out of 18 initially identified IMMADs. The oligomers corresponding to the CACACAC motif did not pass this size-subsampling con-trol analysis and this motif was excluded from the subse-quent analyses. Table 1 reports the 17 IMMADs that passed the size-subsampling control analysis and for
which a confounding effect of systematic structural differ-ences between SASS and MASS genes can be ruled out. These motifs might have a specific role associated with the multiplicity of alternative splicing decisions and have been further analyzed.
IMMADs are globally over-represented in introns flanking alternate exons in MASS genes
The method reported here-above to identify IMMADs compared the frequencies of oligomeric motifs among
Intron length (base)
SASS MASS 20000 15000 10000 5000 0 SASS MASS 2000 1500 1000 500 0 SASS MASS 20000 15000 10000 5000 0 2000 1500 1000 500 0 * * ns ns
Intron length (base)
Gene length (base) Gene length (base)
A C B D (subsampled) SASS MASS (subsampled)
Figure 2 Comparison of gene and intron lengths between SASS and MASS genes. A) Gene lengths in the full sample of SASS and MASS genes. A significant difference was found by Mann Whitney U test (*p < .001). B) The length of introns flanking alternate exons in the full sample of SASS and MASS genes. A significant difference was found by Mann Whitney U test (*p < .001). C) Gene lengths in the stratified subsample of SASS and MASS genes. No significant difference was found by Mann Whitney U test (ns, p = .86). D) The length of introns flanking alternate exons in the stratified subsample of SASS and MASS genes. No significant difference was found by Mann Whitney U test (ns, p = .19).
intronic sequences in MASS and SASS groups. In principle, IMMADs could have been identified because they are glo-bally over-represented across MASS genes, or because they are present with an extreme number of copies in only few MASS genes. To control for the number of IMMAD re-peats, the frequencies of the genes harboring at least one IMMAD copy in the MASS genes were compared to those in the SASS genes. This approach is not influenced by the number of repeats within each gene. This analysis showed a significantly higher gene frequency in the MASS versus SASS groups for each of the 17 identified IMMADs (p < .01, Additional file 3). These results indi-cate that the IMMADs are globally over-represented in introns flanking alternate exons in MASS genes and that their enrichment is not solely contributed by very few genes with multiple IMMAD repeats.
IMMAD conservation in Caenorhabditis briggsae
The evolutionary conservation of IMMADs was assessed in the related species C. briggsae by comparing genes orthologous to C. elegans MASS and SASS genes. The C. briggsae sequences of introns flanking exons that are orthologous to alternate exons in C. elegans were defined and analyzed. This analysis was complicated by the fact that the exon-intron structure of most genes is not
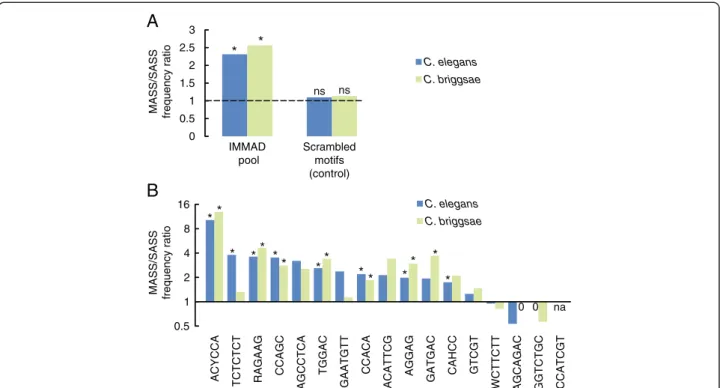
conserved between the two species, which diverged about 100 million years ago [19]. Therefore, the definition of the orthologous introns of interest in C. briggsae was re-stricted to introns in genes whose exon-intron structure is conserved across the two species [20]. This corresponded to 223 alternatively spliced genes (36 MASS and 187 SASS genes), a markedly smaller sample than for the initial MASS/SASS comparison in C. elegans. In this specific subsample of C. elegans MASS and SASS genes, the over-all frequency of IMMADs was still significantly higher in the MASS as compared to the SASS group (fold change: 2.31; p = 5.95E-28, by Fisher’s exact test, Figure 3A and Additional file 4). This enrichment was also found within C. briggsae sequences (fold change: 2.56; p = 7.12E-42, by Fisher’s exact test, Figure 3A and Additional file 4). A con-trol set of scrambled IMMAD sequences was enriched neither in the C. elegans nor in the C. briggsae MASS se-quences (Figure 3A). These results indicate that, when an-alyzed as a whole, the pool of IMMADs identified in the initial MASS/SASS comparison in C. elegans is (a) still enriched in the C. elegans subset of MASS genes with con-served exon-intron structures and (b) also enriched in the corresponding C. briggsae orthologs.
Next, separate analyses for each IMMAD were con-ducted in order to determine if some IMMADs might be more conserved than others. In the C. elegans subsample, 13 out of 17 IMMADs had still a MASS/SASS frequency ratio greater than one (range: 1.25-14.93, Figure 3B). Strik-ingly, these exact same 13 IMMADs had also a MASS/ SASS frequency ratio greater than one in C. briggsae (range: 1.13-12.9, Figure 3B), even if not all enrichments reached the p-value threshold set for statistical signifi-cance. Collectively, these results indicate that the specific enrichment of IMMAD sequences in C. elegans MASS genes is, for most of them, conserved in the orthologous genes of C. briggsae.
Comparison with known splicing regulatory elements
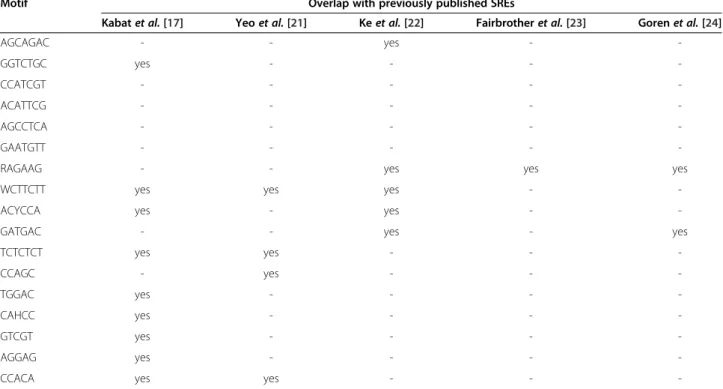
In order to determine whether the IMMADs might serve as Splicing Regulatory Elements (SREs), their list was com-pared to published lists of SREs in C. elegans and other species [17,21-24]. An overlap was observed for members of most IMMAD groups (13 out of 17, Table 2). Nine IMMAD groups included intronic splicing elements re-ported by Kabat and collaborators in C. elegans [17]. This result corresponds to a significant over-representation of the previously detected C. elegans intronic elements within the IMMADs identified here (p = 2.58E-4 by Fisher’s exact test, see Methods). Four motifs had also been identified as conserved intronic splicing elements across humans, dogs, mice, and rats [21]. This finding is consistent with a large conservation of the SRE sequences across species [17]. In addition, five motifs were related to exonic splicing ele-ments identified in mammals [22-24]. Those motifs might
Table 1 Hepta-, hexa-, and pentameric Intronic Motifs linked to Multiple Alternative splicing Decisions (IMMADs) Motif MASS/SASS ratio Corrected p-value Number of MASS genes GGTCTGC 4.0 7.9E-13 24 AGCAGAC 4.0 7.9E-13 36 CAHCC 3.5 8.4E-22 454 CCACA 2.8 1.9E-17 359 RAGAAG 2.7 2.4E-15 339 AGCCTCA 2.4 1.0E-12 38 CCATCGT 2.4 2.1E-07 52 ACATTCG 2.2 3.3E-06 57 TCTCTCT 2.1 4.0E-39 118 WCTTCTT 2.0 1.2E-12 227 GAATGTT 1.9 5.0E-12 119 GATGAC 1.8 1.3E-11 142 ACYCCA 1.7 5.2E-11 163 GTCGT 1.7 4.0E-11 299 CCAGC 1.5 4.0E-15 286 TGGAC 1.3 1.4E-07 275 AGGAG 1.3 8.4E-10 301
Seventeen motif groups are significantly enriched in the introns flanking alternate exons among the MASS genes as compared to the SASS genes (p < 1E-5, by Fisher’s exact tests with Bonferroni corrections). IUPAC ambiguity codes were used: R = A or G; W = A or T; H = A, C, or T; Y = C or T.
work both as intronic and exonic splicing elements, a property often observed in mammals [4]. Collectively, this comparative analysis points to 13 SREs that might have some degree of specialization in splicing coordination or might participate in other unknown functions associated with the need for multiple intragenic splicing decisions.
On the other hand, there were four motifs for which no evidence for a splicing regulatory role was found in the literature. Those might represent elements either lacking regulatory functions or with a specific role in the regulation of multiple splicing decisions that was not ap-parent in previous analyses. Further investigations will be required to clarify this issue.
Comparison with known RNA-binding protein recognition motifs
In order to determine whether IMMADs might be bound by RNA-binding proteins, IMMAD sequences were com-pared to RNA-binding protein recognition sequences re-ported in the literature. A recently published study by Ray and collaborators [25] used the RNAcompete method [26] to map the binding motifs of more than 200 RNA-binding
proteins across several species and integrated these new data with a review of the literature on the motifs recog-nized by RNA-binding proteins. Four IMMADs were found to relate to these RNA-binding protein recognition motifs (Table 3). C. elegans homologs for the four corre-sponding RNA-binding proteins were identified using BLAST searches (BLASTN 2.2.28 [27]) (Table 3). Because the sequence specificities of RNA-binding proteins are strongly evolutionary conserved [25], these results suggest that at least some of the identified IMMADs could be tar-geted by RNA-binding proteins.
Ontology of genes harboring specific IMMADs
In order to address whether the IMMADs identified here are associated with genes sharing similar functions, GO term analyses were performed. First, the MASS group of genes was compared to the rest of the genome. Several Biological ProcessGO terms were significantly enriched in the MASS group (Table 4, and Additional file 5), including locomotion and development. The same GO terms were identified when comparing the SASS genes to the whole genome. This is consistent with the previous analysis 0.5 1 2 4 8 16 ACYCCA TCTC TCT RAGAAG CC AGC AGCCTCA TG GAC GAATGTT CC ACA ACATTCG AGG A G GAT G AC CAH C C GTCGT WCTTCTT AGCAGAC GG TCTG C CC ATCGT C. elegans C. briggsae ** * ** * * * * * * * * * * 0 0 na MASS/SASS frequency ratio
0 0.5 1 1.5 2 2.5 3 IMMAD pool C. elegans C. briggsae
MASS/SASS frequency ratio
* * ns
A
B
Scrambled motifs (control) nsFigure 3 Conservation of IMMADs in C. briggsae. The frequencies of IMMADs in introns flanking alternate exons were compared between C. elegans MASS and SASS genes, as well as between groups of orthologous genes in C. briggsae. These analyses focused on genes with a conserved exon-intron structure and for which the definition of C. briggsae introns of interest was unambiguous (38 MASS and 187 SASS genes, see Methods for more details). A) General analyses with a motif pool including the 17 IMMADs initially identified with a larger sample of MASS and SASS genes in C. elegans (Table 1). As control, the frequency of a population of scrambled IMMADs was compared across the MASS and SASS genes in both species. MASS/SASS frequency ratios are reported. Fisher’s exact tests were performed to evaluate the IMMAD enrichment in the MASS group versus the SASS group. *p < .01 (indicating a ratio significantly different from one). ns, not significant. B) Separate analyses for each IMMAD. MASS/SASS frequency ratios for each IMMAD are reported. Note the log scale on the vertical axis. Fisher’s exact tests were performed to evaluate the specific IMMAD enrichments in the MASS group versus the SASS group. A Bonferroni correction for multiple comparisons was applied. *p < .01 (indicating a ratio significantly different from one). p-values are reported in Additional file 4. na, not applicable because there was no occurrence in the SASS group.
showing no GO difference between MASS and SASS genes (see above). These results highlight that alternative splicing in C. elegans is more common in groups of genes involved in specific functions, which is reminiscent of ob-servations made in mammals [13].
Second, subgroups of MASS genes containing each of the specific IMMADs in introns flanking alternate exons were compared to the whole genome. In most instances, the predominant GO terms were the same as those found in the general comparison of MASS genes with the rest of the genome (Additional files 5 and 6). This suggests that the functions of the different IMMAD-harboring gene subsets might not strongly diverge as compared to those of other alternatively spliced genes. To confirm this obser-vation, the same subgroups of MASS genes containing each of the specific IMMADs were compared to the pool of alternatively spliced genes (MASS and SASS together). For all but one motif, there was no significant enrichment (with a q value threshold at .01, Additional file 6).
Collectively, these results show that the presence of specific IMMADs in introns flanking alternate exons are not generally associated with specific gene functions.
Specific IMMADs are associated with the need for coordination over long or short distances
Among the MASS genes, the distance between separate sites where alternative splicing decisions occur (Figure 4A) covers a wide range, from less than 100 bases to up to 20 kb. However, the inter-site distances are significantly shorter than in a model randomly picking inter-site dis-tances in a simulated pool of 6510 transcripts, matching the intron size and total length of MASS genes (p < .001 by Mann Whitney U test, Figure 4B). In other words, pairs of introns flanking alternate exons implicated in multiple spli-cing decisions are located closer than are pairs of introns taken randomly. This suggests that potential splicing coord-ination mechanisms might tend to work over regions of limited size. To evaluate if specific IMMADs might be
Table 2 Comparison of hepta-, hexa-, and pentameric IMMADs with previously reported Splicing Regulatory Elements (SREs)
Motif Overlap with previously published SREs
Kabat et al. [17] Yeo et al. [21] Ke et al. [22] Fairbrother et al. [23] Goren et al. [24]
AGCAGAC - - yes - -GGTCTGC yes - - - -CCATCGT - - - - -ACATTCG - - - - -AGCCTCA - - - - -GAATGTT - - - -
-RAGAAG - - yes yes yes
WCTTCTT yes yes yes -
-ACYCCA yes - yes -
-GATGAC - - yes - yes
TCTCTCT yes yes - - -CCAGC - yes - - -TGGAC yes - - - -CAHCC yes - - - -GTCGT yes - - - -AGGAG yes - - -
-CCACA yes yes - -
-Table 3 IMMADs similar to previously reported motifs recognized by RNA-binding proteins
Motif RNA-binding protein Species Reference C. elegans homolog
WCTTCTT PTB1 H. sapiens [25,28] PTB-1
CAACC HNRNPK H. sapiens [25,29] PES-4
AGGAG SRSF2 H. sapiens [25,26] RSP-4
preferentially used for long-range or short-range splicing coordination, the distributions of inter-site distances were computed for the gene subgroups harboring each of the 17 IMMADs. These distributions were compared to two con-trols: the distribution from the random model and the dis-tribution observed in the MASS genes. A Kruskal-Wallis test indicated significant differences across these groups (p < .001) and was followed by Mann-Whitney U tests (cor-rected for multiple comparisons) to decipher individual dif-ferences between each IMMAD-harboring group and the two controls. Results show that eight groups harboring spe-cific IMMADs are significantly shorter than the random model (Figure 4C). These IMMADs might preferentially act over short distances. On the other hand, three groups were not different from the random model, but significantly longer than the MASS gene group. These IMMADs might tend to act over longer distances. Collectively, these results suggest that some IMMADs might work preferentially for long distance coordination processes, while others might work preferentially over shorter distances.
Two heptameric IMMADs are part of the CeRep25B minisatellite repeat
It was intriguing that the two top hit heptamers in our IMMAD analysis (Table 1) were nearly a perfect reverse
complement of each other: AGCAGAC and GGTCTGC (6 base match). In order to examine if they could be part of a larger palindromic element, the co-localization of these motifs was thus examined in introns of MASS genes. The two motifs were found together much more fre-quently in the same intron than one would have expected by chance based on their individual frequencies (signifi-cant co-occurrence enrichment: p < .01, by Fisher’s exact test). In most genes in which these motifs co-occur (6/8), the two oligomers were found in stretches of repeated pal-indromic (or nearly-palpal-indromic) sequences correspond-ing to the previously characterized CeRep25B minisatellite [31]. This minisatellite consists of 24 bases repeated sev-eral times. The genomic distribution of this minisatellite is essentially restrained to specific clusters along chromo-some III and, to a lesser extent, chromochromo-some II [31]. 75% of these repeats lie in introns and an undetermined por-tion of the remaining repeats might also be part of nascent transcript 5’UTRs, which are poorly characterized in C. elegansdue to trans-splicing [32]. The occurrence of CeR-ep25B minisatellites was then examined within introns flanking alternate exons in MASS and SASS genes. A sig-nificant enrichment of this satellite was found in the MASS group (p = .0025 by Fisher’s exact test). Actually, this minisatellite was never found in the introns flanking
Table 4 Gene Ontology (GO) analysis: most significantly enriched GO terms in MASS genes as compared to the whole genome
GO Term Description p-value FDR q value Enrichment
GO:0065007 biological regulation 3.35E-28 1.13E-24 1.82
GO:0044699 single-organism process 8.98E-28 1.52E-24 1.5
GO:0050789 regulation of biological process 1.01E-27 1.15E-24 1.83
GO:0008150 biological_process 1.04E-24 8.78E-22 1.29
GO:0009987 cellular process 4.41E-24 2.99E-21 1.57
GO:0044763 single-organism cellular process 2.92E-22 1.65E-19 1.74
GO:0032502 developmental process 3.95E-21 1.91E-18 1.69
GO:0050794 regulation of cellular process 2.12E-18 8.97E-16 1.99
GO:0048518 positive regulation of biological process 2.52E-18 9.5E-16 2.06
GO:0044767 single-organism developmental process 2.6E-18 8.8E-16 1.68
GO:0048856 anatomical structure development 2.65E-17 8.15E-15 1.71
GO:0009791 post-embryonic development 2.47E-16 6.97E-14 2.01
GO:0002119 nematode larval development 8.04E-16 2.09E-13 1.99
GO:0002164 larval development 8.45E-16 2.04E-13 1.99
GO:0040011 locomotion 1.76E-15 3.98E-13 2.11
GO:0040008 regulation of growth 3.78E-15 8E-13 2.02
GO:0040012 regulation of locomotion 1.21E-14 2.42E-12 4.14
GO:0048519 negative regulation of biological process 1.68E-14 3.17E-12 2.82
GO:0016043 cellular component organization 3.67E-14 6.55E-12 2.41
GO:0007610 behavior 5.04E-14 8.54E-12 3.13
Top 20 GO terms ranked according to the p-values for enrichment in the MASS group of genes, as compared to the C. elegans whole genome annotations. FDR, False Discovery Rate.
alternate exons in the SASS group. Together with the fact that this minisatellite contains repeats of two pre-viously identified SREs [17,22], this finding raises the possibility that this minisatellite influences splicing, as shown previously in other organisms for similar re-peated sequences [33].
In order to determine if the CeRep25B minisatellite was solely responsible for the identification of the AGCAGAC and GGTCTGC motifs during the initial IMMAD screen, their enrichment within the MASS genes as compared to
the SASS genes was recalculated while excluding the CeRep25B-containing genes from the analysis. For the GGTCTGC motif, the enrichment in the MASS group was no longer statistically significant (fold change = 1.71; p= .03 by Fisher’s exact test). This result indicates that the GGTCTGC motif might only be enriched within the MASS group because it is part of the MASS-associated minisatellite CeRep25B. In contrast, the AGCAGAC motif was still significantly enriched in the MASS group upon removal of the CeRep25B containing genes (fold change =
Inter-site distance (
Δ,
kb)
Inter-site distance: Δ
site 1 Δ site 2 Δ site 3
A
B
C
AGCAGAC WCTTCTT ACYCCA AGCCTCA GGTCTGC ACATTCG AGGAG TGGAC GTCGT RAGAAG CAHCC GATGAC CCACA CCAGC Random model MASS genes 6 4 2 0 TCTCTCT «long-range» IMMADs «short-range» IMMADs CCATCGT * ** ** ** ** ** ** ** # # ## Inter-site distance (Δ, kb)Fraction of all distances
MASS genes Random model * 0 0.1 0.2 0.3 0.4 0.5 0.6 0-1 1-2 2-4 4-8 8-16 >16 GAATGTT
Figure 4 Analysis of the distances between multiple splicing decision sites. A) Definition of the inter-site distance:Δ. B) The observed distribution of inter-site distances within MASS genes was compared to a simulated distribution based on a model picking random inter-site distances in a simulated pool of 6510 transcripts. The total gene length and intron length distributions in the simulated pool were the same as the ones in the MASS genes (*p < .001 by Mann Whitney U tests). C) Inter-site distance distributions for subsets of MASS genes harboring specific IMMADs were compared to the random model and to the full MASS gene interval distributions. A Kruskal-Wallis test indicated a significant gene group effect (p < .001). Mann-Whitney U tests were performed to compare each IMMAD-specific group to the random model and to the MASS gene group, respectively. **p < .01; *p < .05 versus random model; ##, p < .01; #, p < .05 versus the MASS genes. IMMAD groups depicted in grey displayed no significant differences with either control groups.
2.88; p = 5.24E-7 by Fisher’s exact test). This indicates that the AGCAGAC heptamer is enriched within the introns flanking alternate exons in MASS genes, both as part of the CeRep25B minisatellite and when occurring outside of it.
Additional oligomeric IMMADs are part of larger sequence elements
One could wonder whether other penta-, hexa-, or hepta-meric IMMADs identified in the MASS-SASS comparison (Table 1) could also be part of repeated elements. To ad-dress this question and identify putative larger repeated elements, the distance separating homologous pairs of IMMADs was examined in the introns flanking alternate exons of MASS genes. The distribution of distances be-tween consecutive motifs was plotted for each of the 17 IMMADs (Figure 5). The presence of a given motif in re-peated sequences is indicated by prominent peaks along the distribution. For example, the plots for the AGCA-GAC and GGTCTGC motifs both clearly highlight two peaks (at 31 and 63 bases), corresponding to the most common repeated intervals within the CeRep25B minisa-tellite. Similarly, two peaks (at 19 and 20 bases) for the AGCCTCA motif, one peak (at 15 bases) for the CCATCGT motif, and one peak (at 40 bases) for the GAATGTT motif were predominant. These repsented ~80%, ~45%, and ~29% of the total intervals, re-spectively, and signaled the presence of larger repeated elements, which include these motifs. These were ana-lyzed in more details (see the next two paragraphs).
The AGCCTCA motif was part of a tandem repeat min-isatellite comprising 20 or 19 base pairs. This minmin-isatellite was found in 3 MASS genes (Y38C1AA.1, F29C4.7, and ZK57.4c). This minisatellite was not reported in the Repbase Update database (6-22-2013) [34]. Within these three MASS genes the repeats had the consensus se-quence AGCCTCAACCAAAA(A)TTCTC. No occur-rence of this minisatellite was found within the SASS genes. However, because of the very few genes involved, it is not possible to conclude on an association between this minisatellite and the multiplicity of alternative splicing de-cisions. When removing this minisatellite to re-perform the sequence comparison between introns flanking alter-nate exons in MASS and SASS genes, the AGCCTCA motif was not significantly over-represented in the MASS genes anymore. Thus, it is possible that the initial identifi-cation of the AGCCTCA motif was an artifact due to the exceptional weight conferred by only a few genes harbor-ing several repeats.
The CCATCGT motif was part of a tandem repeat of 15 bases with the sequence CCATCGTGG(T/C) GAGAC, which is part of a transposon from the Heli-tronY4_CE family [34,35]. The GAATGTT motif was also part of the same transposon, but was present in a different tandem repeat (40 bases) with the consensus
sequence: AAAATTCTGGAATGTTCCAGAACTTTCTA GAAAAATTGGG. Among MASS genes, this transposon was present only in the R11A5.4 gene. No occurrence of this transposon was found within the SASS genes. However, because only one MASS gene is involved, it is not possible to conclude on a potential association between this trans-poson and the multiplicity of alternative splicing decisions. When removing this transposon to re-perform the se-quence comparison between introns flanking alternate exons in MASS and SASS genes, the CCATCGT and GAATGTT motifs were both still significantly enriched in the MASS genes (p = 2.47E-4 and 2.59E-4, respectively, by Fisher’s exact tests). This means that, regardless of their in-clusion as repeated motifs in the HelitronY4_CE trans-poson, the CCATCGT and GAATGTT heptamers are over-represented in the introns flanking alternate exons of MASS genes.
In addition, peaks for shorter inter-motif distances (at 1-3 bases) were found for the GTCGT, RAGAAG, TCTCTCT, and WCTTCTT motifs (Figure 5). These results point to the existence of octa-, nona-, and deca-meric elements in-cluding two repetitions of these shorter oligomers. Among the four longer oligomers, two were significantly over-represented in the introns flanking alternate exons from the MASS genes as compared to the SASS genes: RAGAA GAAG (fold change = 2.0; p = 1.07E-5), and TCTCTCTCT (fold change = 2.6; p = 2.60E-8).
Collectively, the results of the analysis of the distance separating homologous IMMADs show that several of them occur as part of larger elements such as minisatel-lites or longer oligomers.
Some oligomeric IMMADs preferentially occur in specific pairs
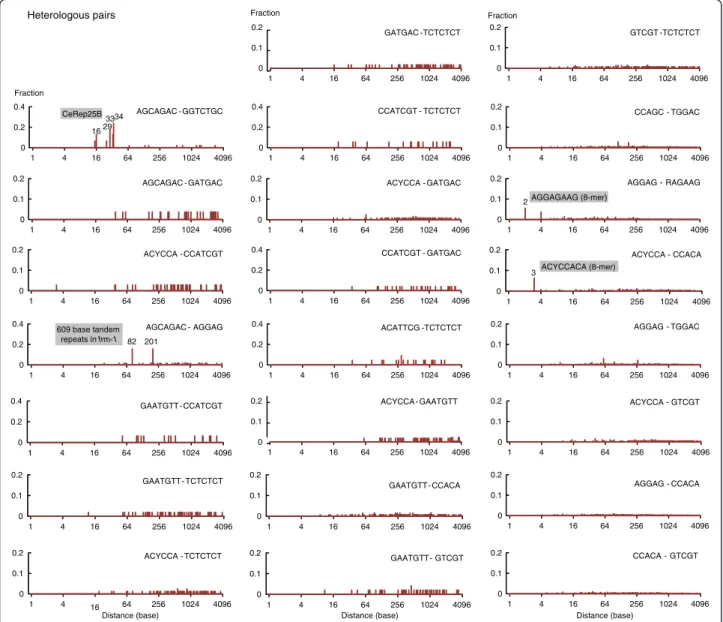
One could wonder whether some IMMAD types tend to occur together, which might indicate they are recur-rently involved in joint regulation. To address this ques-tion, a systematic co-occurrence analysis was performed for every of the 136 possible heterologous pairs of the 17 oligomeric IMMADs identified in the present study. At least one motif pair was found in the majority of MASS genes (406/752). Based on the frequencies of in-dividual IMMADs, this does not however constitute a general over-representation of IMMAD pairs. Each of the 136 specific pairs was then systematically tested for co-occurrence enrichment. Twenty-three pairs had a significant co-occurrence enrichment (p < .01 by Fish-er’s exact tests, corrected for multiple comparisons; odds ratio: 17.6– 2.2, see Table 5). The top hit was the AGCAGAC-GGTCTGC pair, found in the CeRep25B min-isatellite. In order to determine whether the remaining oligomer pairs were also part of larger elements, their rela-tive positions were computed and the distribution of the distances between consecutive elements was plotted
(Figure 6). Prominent peaks were observed for four heterol-ogous oligomeric IMMAD pairs:
First, the AGCAGAC-GGTCTGC pair, found in the CeRep25B element, displayed four peaks in its distribution (at 16, 29, 33, and 34 bases), corresponding to the most common intervals between the two oligomers within this minisatellite (Figure 6).
Second, the AGCAGAC-AGGAG distance distribution displayed two peaks (at 81 and 201 bases), each contribut-ing to nearly 16% of the inter-oligomer distances (Figure 6). Both peaks were due to the presence of a sequence stretch containing 10 tandem repeats of 609 bases in only one gene (frm-1). A BLAST search (BLASTN 2.2.28 [27]) for this DNA sequence revealed no other occurrence in the C.
Fraction Homologous pairs 0 0.2 0.4 1 4 16 64 256 1024 4096 19 20 AGCCTCA 0 0.2 0.4 1 4 16 64 256 1024 4096 AGCAGAC 31 63 0 0.2 0.4 1 4 16 64 256 1024 4096 AGGAG 0 0.2 0.4 1 4 16 64 256 1024 4096 31 63 GGTCTGC 0 0.1 0.2 1 4 16 64 256 1024 4096 CAHCC 0 0.2 0.4 1 4 16 64 256 1024 4096 3 RAGAAG 0 0.1 0.2 1 4 16 64 256 1024 4096 CCACA 0 0.1 0.2 1 4 16 64 256 1024 4096 CCAGC 0 0.2 0.4 0.6 1 4 16 64 256 1024 4096 CCATCGT 15 0 0.1 0.2 1 4 16 64 256 1024 4096 GATGAC 0 0.1 0.2 1 4 16 64 256 1024 4096 3 GTCGT 0 0.2 0.4 1 4 16 64 256 1024 4096 3 WCTTCTT 0 0.1 0.2 1 4 16 64 256 1024 4096 TGGAC 0 0.4 0.8 1 4 16 64 256 1024 4096 2 TCTCTCT 0 0.2 0.4 1 4 16 64 256 1024 4096 ACATTCG Fraction Distance (base) CeRep25B HelitronY4_CE transposon CeRep25B GTCGTCGT (8-mer) RAGAAGAAG (9-mer) TCTCTCTCT (9-mer) WCTTCTTCTT (10-mer) AGCCTCAACCAAAA(A)TTCTC Minisatellite 0 0.2 0.4 1 4 16 64 256 1024 4096 Distance (base) ACYCCA 0 0.4 0.8 1 4 16 64 256 1024 4096 GAATGTT 40 HelitronY4_CE transposon
Figure 5 Distance distributions between homologous pairs of IMMADs. IMMAD coordinates within introns flanking alternate exons of the MASS genes were computed to determine the distances between homologous pairs of consecutive IMMADs. The inter-motif distance distributions are reported for the 17 IMMAD groups shown in Table 1.
elegans genome. Because the co-occurrence analysis (re-ported in Table 5) is based on gene counts rather than on motif pair counts (see Methods), the presence of this re-peated sequence in a single gene is unlikely to have yielded the“artifactual” identification of the AGCAGAC-AGGAG pair. This conclusion was confirmed by the result of an analysis excluding the frm-1 gene to recalculate the co-occurrence enrichment of the AGCAGAC-AGGAG pair (p = 9.0E-5, by Fisher’s exact test).
Third, the AGGAG-RAGAAG distance distribution dis-played one peak (at 2 bases), corresponding to the AGGA-GAAG octamer (Figure 6). The AGGAAGGA-GAAG octamer accounted only for 7% of the total AGGAG-RAGAAG pairs. However, this octamer was significantly enriched in the MASS as compared to the SASS group of introns flanking alternate exons (fold change = 2.03; p = 2.2E-3 by Fisher’s exact test). The co-occurrence analysis ex-cluding this octamer still yielded a largely significant co-occurrence enrichment for the RAGAAG-AGGAG
motif pair (p = 1.16E-6 by Fisher’s exact test). Collect-ively, these data indicate that both the AGGAGAAG octamers and pairs of distant RAGAAG and AGGAG motifs are associated with multiple splicing decisions.
Fourth, the ACYCCA-CCACA distance distribution displayed one peak (3 bases), corresponding to the ACYCCACA octamer (Figure 6). The ACYCCACA octamer accounted only for 6% of the total ACYCCA CCACA pairs. However, this octamer was significantly enriched in the MASS as compared to the SASS group of introns flanking alternate exons (fold change = 2.89; p= 2.80E-5 by Fisher’s exact test). The co-occurrence analysis excluding this octamer still yielded a significant co-occurrence enrichment for the ACYCCA-CCACA motif pair (p = 2.03E-5 by Fisher’s exact test). Collect-ively, these data indicate that both the ACYCCACA octamers and pairs of distant ACYCCA and CCACA motifs are associated with multiple splicing decisions.
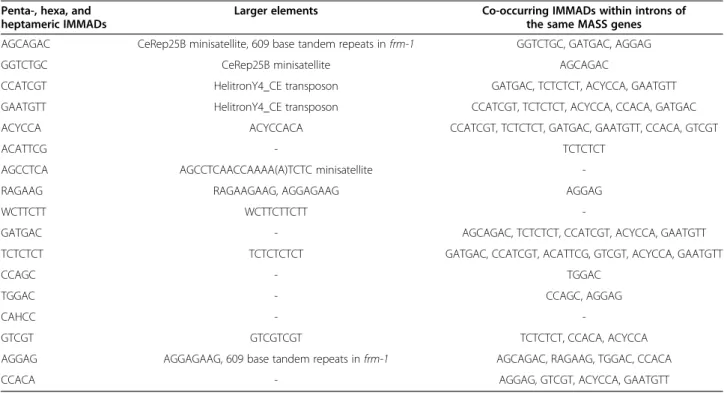
Apart from the four cases detailed above, there was no pre-dominant distance peak in the remaining 19 pairs of oligo-meric IMMADs with enriched co-occurrence (Figure 6). Thus, contrary to what happens in the CeRep25B minisatel-lite and when they are part of larger oligomers, most co-occurring penta-, hexa-, and heptameric IMMADs have no strict constraint with respect to their relative position. Table 6 summarizes the IMMAD occurrence as part of larger se-quences and the prominent co-occurring IMMAD partners.
Discussion
The present study confirmed the hypothesis that specific sequence elements occur more frequently in introns flank-ing alternate exons in genes where multiple alternative spli-cing decisions occur, as compared to genes where only one such decision occurs. This observation held even when data were subsampled to correct for potential bias due to sys-tematic differences in gene and intron lengths between the gene groups. Moreover, the two gene groups did not differ in terms of nucleotide composition, chromosomal distribu-tion, and gene product funcdistribu-tion, which rules out potential confounding effects of those factors.
The results of the comparative analysis of intron se-quences between C. elegans and C. briggsae indicate a large conservation of IMMADs and suggest a conserved function. Indeed, results showed that most IMMADs over-represented in C. elegans MASS-SASS gene compari-son are also over-represented in the comparicompari-son between C. briggsae orthologous gene groups. One limitation of this analysis, however, is the definition of MASS and SASS genes in C. briggsae, which is solely based on sequence conservation and not on data directly addressing the num-ber of alternatively spliced regions among the C. briggsae genes. Since more and more data on C. briggsae transcrip-tome are becoming available [36-38], further conservation
Table 5 Co-occurrence analysis of IMMAD heterologous pairs
IMMAD pair Odds ratio Number of genes p-value*
AGCAGAC-GGTCTGC 17.6 8 1.2E-04 AGCAGAC-GATGAC 5.1 15 5.2E-03 ACYCCA-CCATCGT 5.0 23 1.3E-04 AGCAGAC-AGGAG 4.9 20 3.5E-03 GAATGTT-CCATCGT 4.8 19 7.6E-04 GAATGTT-TCTCTCT 4.8 39 8.1E-08 ACYCCA-TCTCTCT 4.5 46 4.2E-08 GATGAC-TCTCTCT 4.3 39 8.2E-07 CCATCGT-TCTCTCT 4.2 17 6.6E-03 ACYCCA-GATGAC 4.0 49 1.3E-07 CCATCGT-GATGAC 3.9 18 9.3E-03 ACATTCG-TCTCTCT 3.9 18 8.9E-03 ACYCCA-GAATGTT 3.6 47 3.9E-06 GAATGTT-CCACA 3.6 67 6.7E-07 GAATGTT-GATGAC 3.0 35 9.4E-04 GTCGT-TCTCTCT 3.0 46 2.1E-04 CCAGC-TGGAC 3.0 65 7.0E-06 AGGAG-RAGAAG 2.8 74 8.9E-06 ACYCCA-CCACA 2.5 76 2.3E-04 AGGAG-TGGAC 2.4 65 8.0E-04 ACYCCA-GTCGT 2.4 55 3.6E-03 AGGAG-CCACA 2.3 98 3.3E-04 CCACA-GTCGT 2.2 89 1.0E-03
23 out of the 136 possible IMMAD heterologous pairs present a co-occurrence enrichment within the introns flanking alternate exons of MASS genes. The reported number of genes is the number of MASS genes where a given IMMAD pair occurs. *the co-occurrence enrichment p-values were calculated by Fisher’s exact tests with Bonferroni corrections for multiple comparisons.
analyses refining the definition of MASS and SASS genes in C. briggsae should become feasible in the future.
The present study shows that the selection of specific in-tronic elements (IMMADs) is non-random within C. ele-gans MASS genes. First, the usage of specific IMMADs depends on the distance separating the multiple splicing de-cision sites. This suggests that the presence of specific IMMADs is influenced by structural and/or topological fea-tures. Second, IMMADs tend to occur in specific pairs (see summary in Table 6), most of the time with no rigid spa-cing constraint (minisatellites representing an exception). Taken together, these observations suggest that IMMADs have a specific role in the regulation of multiple alternative splicing decisions along single transcripts. This role might involve specific IMMAD pairs and vary according to gene
structure, but its exact nature is unknown at this stage. At least two non-mutually exclusive general mecha-nisms can be proposed to explain how IMMADs might regulate splicing. First, IMMADs might be recognized by specific regulatory proteins. It was shown here that at least four IMMAD sequences relate to specific bind-ing motifs of human RNA-bindbind-ing proteins that have homologs in C. elegans. Second, IMMADs might be im-plicated in the creation of RNA secondary structures contributing to regulate alternative splicing [39,40]. Re-cent studies have shown that intronic motifs can form long-range secondary structures to affect complex spli-cing decisions [41-43]. The catalog of candidate ele-ments reported here represents a useful starting point for further studies in C. elegans.
0 0.2 0.4 1 4 16 64 256 1024 4096 AGCAGAC - GGTCTGC 34 1629 0 0.1 0.2 1 4 16 64 256 1024 4096 AGCAGAC - GATGAC 0 0.1 0.2 1 4 16 64 256 1024 4096 GATGAC -TCTCTCT 0 0.2 0.4 1 4 16 64 256 1024 4096 CCATCGT - TCTCTCT 0 0.2 0.4 1 4 16 64 256 1024 4096 CCATCGT - GATGAC 0 0.2 0.4 1 4 16 64 256 1024 4096 ACATTCG -TCTCTCT 0 0.1 0.2 1 4 16 64 256 1024 4096 CCAGC - TGGAC 0 0.1 0.2 1 4 16 64 256 1024 4096 GTCGT -TCTCTCT 0 0.1 0.2 1 4 16 64 256 1024 4096 AGGAG - TGGAC 0 0.1 0.2 1 4 16 64 256 1024 4096 AGGAG - CCACA 0 0.1 0.2 1 4 16 64 256 1024 4096 CCACA - GTCGT Fraction Fraction
Distance (base) Distance (base)
CeRep25B 0 0.1 0.2 1 4 16 64 256 1024 4096 AGGAG - RAGAAG 2AGGAGAAG (8-mer) 33 82 201 AGCAGAC - AGGAG 0 0.2 0.4 1 4 16 64 256 1024 4096 609 base tandem repeats in frm-1 0 0.1 0.2 1 4 16 64 256 1024 4096 ACYCCA - CCATCGT 0 0.1 0.2 1 4 16 64 256 1024 4096 ACYCCA - TCTCTCT ACYCCA - GATGAC 0 0.1 0.2 1 4 16 64 256 1024 4096 0 0.1 0.2 1 4 16 64 256 1024 4096 ACYCCA - GAATGTT Fraction 0 0.1 0.2 1 4 16 64 256 1024 4096 ACYCCA - GTCGT 0 0.2 0.4 1 4 16 64 256 1024 4096 GAATGTT- CCATCGT 0 0.1 0.2 1 4 16 64 256 1024 4096 GAATGTT- TCTCTCT 0 0.1 0.2 1 4 16 64 256 1024 4096 GAATGTT- CCACA 0 0.1 0.2 1 4 16 64 256 1024 4096 GAATGTT- GTCGT Distance (base) 3 0 0.1 0.2 1 4 16 64 256 1024 4096 ACYCCA - CCACA ACYCCACA (8-mer) Heterologous pairs
Figure 6 Distance distributions between heterologous pairs of IMMADs. IMMAD coordinates within introns flanking alternate exons of the MASS genes were computed to determine the distances between heterologous pairs of consecutive IMMADs. The inter-motif distance distributions are reported for the 23 IMMAD heterologous pairs showing significant co-occurrence enrichments (Table 5).
Conclusions
In conclusion, the present findings raise the intriguing possibility that several cis-regulatory elements, as well as potential corresponding trans-acting factors, are spe-cialized in the regulation of multiple alternative splicing decisions. The present study paves the road for add-itional research in C. elegans aiming at understanding how the different IMMADs work. Furthermore, it will be important to determine whether motifs with identi-cal distributions and potential functions are found in additional species, including human.
Methods
MASS and SASS datasets
To generate MASS and SASS gene lists, WormBase release WS235 was used to retrieve all the gene models with more than one transcript isoform. These genes were then catego-rized as MASS or SASS, based on the analysis of alterna-tive intron patterns. Candidate alternative introns were initially defined as introns not present in every transcript isoforms. Next, alternative introns resulting from alterna-tive transcriptional starts were removed from the analysis. Alternative intron positions were then computed to iden-tify alternative introns that overlapped with each other. Overlapping alternative introns are characteristic of alter-native 3’ splice sites (A3SS), alteralter-native 5’ splice sites (A5SS), mutually exclusive exon (MXE), and skipped exons (also named cassette exons, CE), which have been consid-ered here as representing single splicing decisions. Genes harboring a single alternative intron or a single set of
overlapping alternative introns were defined as SASS. Con-versely, genes with two or more non-overlapping alterna-tive introns, or with two or more non-overlapping sets of overlapping alternative introns, were defined as MASS. These situations are illustrated in Figure 1, with the ex-ample of mutually exclusive exons. This procedure identi-fied a total of 752 MASS and 1570 SASS genes.
Identification of IMMADs
Introns flanking alternate exons in the MASS group (3132 sequences) were compared to introns flanking alternate exons in the SASS group (2113 sequences). The Galaxy platform (http://usegalaxy.org/) [44-46] was used for in-tronic sequence analyses with Compseq [47,48]. Compseq was used to count the number of occurrences of every pos-sible pentamers (1024), hexamers (4096), and heptamers (16384). For each oligomer, the enrichment in the MASS group as compared to the SASS group was assessed with a Fisher’s exact test, computed in R on the BiostaTGV plat-form (http://marne.u707.jussieu.fr/biostatgv/). To correct for multiple testing, a conservative Bonferroni approach was applied. The p-values reported in Additional files 1 and 2 have been corrected (multiplied by 1024 for pentamers, by 4096 for hexamers, and by 16384 for heptamers).
The significantly enriched oligomeric sequences were grouped according to the following criteria: sequences were clustered in the same group if they were part of each other (e.g. a pentamer being a substring of an hexamer,) or if they diverged by no more than one nucleotide.
Table 6 Inclusion of IMMADs in larger elements and co-occurring motifs
Penta-, hexa, and heptameric IMMADs
Larger elements Co-occurring IMMADs within introns of
the same MASS genes
AGCAGAC CeRep25B minisatellite, 609 base tandem repeats in frm-1 GGTCTGC, GATGAC, AGGAG
GGTCTGC CeRep25B minisatellite AGCAGAC
CCATCGT HelitronY4_CE transposon GATGAC, TCTCTCT, ACYCCA, GAATGTT
GAATGTT HelitronY4_CE transposon CCATCGT, TCTCTCT, ACYCCA, CCACA, GATGAC
ACYCCA ACYCCACA CCATCGT, TCTCTCT, GATGAC, GAATGTT, CCACA, GTCGT
ACATTCG - TCTCTCT
AGCCTCA AGCCTCAACCAAAA(A)TCTC minisatellite
-RAGAAG RAGAAGAAG, AGGAGAAG AGGAG
WCTTCTT WCTTCTTCTT
-GATGAC - AGCAGAC, TCTCTCT, CCATCGT, ACYCCA, GAATGTT
TCTCTCT TCTCTCTCT GATGAC, CCATCGT, ACATTCG, GTCGT, ACYCCA, GAATGTT
CCAGC - TGGAC
TGGAC - CCAGC, AGGAG
CAHCC -
-GTCGT GTCGTCGT TCTCTCT, CCACA, ACYCCA
AGGAG AGGAGAAG, 609 base tandem repeats in frm-1 AGCAGAC, RAGAAG, TGGAC, CCACA
GO term analyses
All GO term analyses were performed with the GOrilla online tool [49,50].
MASS and SASS genes stratified subsampling
The MASS and SASS groups of genes diverged in their total length and in the length of the introns flanking al-ternate exons (see distributions in Figure 2). To get rid of any potential gene length confounding effect when comparing the intronic sequences of MASS and SASS genes, some genes were semi-randomly excluded to re-sample the two groups. Genes were grouped according to their size in bins of 1000 kb. In each bin where the fraction of MASS genes was higher than the fraction of SASS genes, some MASS genes were randomly re-moved in order to match the fraction observed in the SASS group. The reverse was performed for bins where the fraction of SASS genes was higher than the fraction of MASS genes. The re-sampled groups contained 523 MASS genes (1881 introns flanking alternate exons) and 965 SASS genes (1590 introns flanking alternate exons). This re-sampling also solved the intron length bias.
Definition and analysis of C. briggsae MASS and SASS genes
C. briggsae introns of interest were those flanking exons that were orthologous to C. elegans alternate exons. The analysis focused on genes with conserved exon sequences and exon-intron structures and for which the definition of orthologous introns is unam-biguous. To that end, the lists of C. elegans MASS and SASS genes were crossed with a list of genes whose exon-intron structure is conserved across the two spe-cies (3404 genes, kindly provided by Juan Fuxman Bass and Marian Walhout) [20]. This method yielded a list of 38 C. briggsae MASS genes and a list of 187 C. brigg-sae SASS genes. The sequences of introns flanking exons that are orthologous to alternate exons in C. ele-gans were retrieved and further analyzed to calculate the frequency of specific motifs.
Comparison with the literature on SREs
For the comparison of the IMMAD list with the penta-mers and hexapenta-mers reported in Kabat et al. [17], the hep-tamers of the IMMAD list were converted into two hexamers, yielding a total of 79 hexa- or pentamers. Of these, 17 were overlapping with the list of SREs reported in Kabat et al. (400 out of 5120 analyzed hexa- or penta-mers). This corresponds to an enrichment of 3.24 fold of putative C. elegans SREs within the list of IMMADs (p = 2.58E-4, by Fisher’s exact test). The comparison with the data from Yeo et al. [21] included both upstream and downstream intronic SREs (ISREs).
Analysis of distances between IMMADs
Distances were calculated between adjacent motifs after extracting the chromosomal coordinates of all the IMMADs found within introns flanking alternate exons.
Co-occurrence analysis
To calculate the co-occurrence enrichment for a given heterologous A-B motif pair, the number of genes con-taining (i) A and B, (ii) only A, (iii) only B, and (iv) nei-ther A or B were determined. 2×2 contingency tables were then used to calculate the odds ratios between A-containing and B-A-containing genes and statistical dif-ferences were evaluated by Fisher’s exact tests, with Bonferroni corrections. For any given intron, this ana-lysis only included the motifs whose frequency was higher than expected by chance. This selection process avoided putting an inappropriate weight to large in-trons, which naturally tend to include more motifs.
Availability of supporting data
The data sets supporting the results of this article are in-cluded within the article (and its additional files).
Additional files
Additional file 1: 63 oligomers identified in the initial MASS-SASS comparison. This file provides detailed data for each of the 63 oligomers retrieved through the initial IMMAD identification procedure without correcting for gene and intron size. The file includes a summary of motif classification and separate sheets listing pentamers, hexamers, and heptamers significantly enriched in the MASS group versus the SASS group. Fisher’s exact tests were used to assess the oligomer frequency differences between the MASS and SASS groups. Bonferroni corrections were used to compensate for multiple testing and the corrected p-values are reported.
Additional file 2: MASS-SASS comparison with size-matched subsamples. This file contains enrichment data obtained before and after size-subsampling for the 63 relevant oligomers in the MASS/SASS comparison. Fisher’s exact tests were used to assess the oligomer frequency differences between the MASS and SASS groups. Bonferroni corrections were used to compensate for multiple testing and the corrected p-values are reported.
Additional file 3: Frequencies of genes harboring specific IMMADs within the MASS and SASS groups. This spreadsheet presents the numbers and frequencies of genes harboring specific IMMADs within MASS and SASS gene groups. For each IMMAD, a Fisher’s exact test was used to assess the gene frequency difference across the MASS and SASS groups. Bonferroni corrections were used to compensate for multiple testing and the corrected p-values are displayed.
Additional file 4: Comparative IMMAD analysis between C. elegans and C. briggsae. This file contains the raw data and p-values
corresponding to Figure 3. Note that values for C. elegans are different from those reported in Table 1 and Additional file 2 because only the subsample of MASS and SASS genes with conserved exon-intron structure across C. elegans and C. briggsae was included in this analysis.
Additional file 5: Full list of GO terms enriched in the MASS group of genes as compared to the whole genome. This spreadsheet contains the full list of GO terms enriched in the MASS group of genes as compared to the whole genome.
Additional file 6: GO term analyses among MASS genes harboring specific IMMADs. This spreadsheet contains the lists of GO terms enriched in subsets of MASS genes harboring specific IMMADs. Separate comparisons were made with the whole genome and with alternatively spliced genes (MASS + SASS).
Abbreviations
GO:Gene Ontology; MASS: Multiple Alternative Splicing decision Sites; SASS: Single Alternative Splicing decision Site; IMMADs: Intronic Motifs linked to Multiple Alternative splicing Decisions; SRE: Splicing Regulatory Elements. Competing interests
The author declares that he has no competing interests. Acknowledgments
The author thanks Laurent Falquet, head of the bioinformatics core facility at the University of Fribourg, for useful suggestions on the conservation analysis, Juan Fuxman Bass and Marian Walhout for sharing an unpublished list of genes with conserved exon-intron structure between C. elegans and C. briggsae, Elise Dan-Glauser and the members of the Department of Biology/ Zoology for helpful discussions about the study, as well as WormBase. This research was supported by an Ambizione subsidy from the Swiss National Science Foundation (PZ00P3_131943) and a Marie Curie Career Integration Grant (PCIG10-GA-2011-302077) from the European Commission to DAG. Received: 4 February 2013 Accepted: 15 April 2014
Published: 14 May 2014
References
1. Barberan-Soler S, Medina P, Estella J, Williams J, Zahler AM: Co-regulation of alternative splicing by diverse splicing factors in Caenorhabditis elegans. Nucleic Acids Res 2011, 39(2):666–674.
2. Licatalosi DD, Darnell RB: RNA processing and its regulation: global insights into biological networks. Nat Rev Genet 2010, 11(1):75–87. 3. Witten JT, Ule J: Understanding splicing regulation through RNA splicing
maps. Trends Genet 2011, 27(3):89–97.
4. Wang Z, Burge CB: Splicing regulation: from a parts list of regulatory elements to an integrated splicing code. RNA 2008, 14(5):802–813. 5. Stamm S: Regulation of alternative splicing by reversible protein
phosphorylation. J Biol Chem 2008, 283(3):1223–1227.
6. Chen M, Manley JL: Mechanisms of alternative splicing regulation: insights from molecular and genomics approaches. Nat Rev Mol Cell Biol 2009, 10(11):741–754.
7. House AE, Lynch KW: Regulation of alternative splicing: more than just the ABCs. J Biol Chem 2008, 283(3):1217–1221.
8. Kim E, Magen A, Ast G: Different levels of alternative splicing among eukaryotes. Nucleic Acids Res 2007, 35(1):125–131.
9. Pan Q, Shai O, Lee LJ, Frey BJ, Blencowe BJ: Deep surveying of alternative splicing complexity in the human transcriptome by high-throughput sequencing. Nat Genet 2008, 40(12):1413–1415.
10. Maniatis T, Tasic B: Alternative pre-mRNA splicing and proteome expansion in metazoans. Nature 2002, 418(6894):236–243.
11. Graveley BR: Alternative splicing: increasing diversity in the proteomic world. Trends Gen 2001, 17(2):100–107.
12. Fededa JP, Petrillo E, Gelfand MS, Neverov AD, Kadener S, Nogués G, Pelisch F, Baralle FE, Muro AF, Kornblihtt AR: A polar mechanism coordinates different regions of alternative splicing within a single gene. Mol Cell 2005, 19(3):393–404.
13. Fagnani M, Barash Y, Ip JY, Misquitta C, Pan Q, Saltzman AL, Shai O, Lee L, Rozenhek A, Mohammad N, Willaime-Morawek S, Babak T, Zhang W, Hughes TR, van der Kooy D, Frey BJ, Blencowe BJ: Functional coordination of alternative splicing in the mammalian central nervous system. Genome Biol 2007, 8(6):R108.
14. Glauser DA, Johnson BE, Aldrich RW, Goodman MB: Intragenic alternative splicing coordination is essential for Caenorhabditis elegans slo-1 gene function. Proc Natl Acad Sci U S A 2011, 108(51):20790–20795.
15. Xing Y, Resch A, Lee C: The multiassembly problem: reconstructing multiple transcript isoforms from EST fragment mixtures. Genome Res 2004, 14(3):426–441.
16. Johnson BE, Glauser DA, Dan-Glauser ES, Halling DB, Aldrich RW, Goodman MB: Alternatively spliced domains interact to regulate BK potassium channel gating. Proc Natl Acad Sci U S A 2011, 108(51):20784–20789.
17. Kabat JL, Barberan-Soler S, McKenna P, Clawson H, Farrer T, Zahler AM: Intronic alternative splicing regulators identified by comparative genomics in nematodes. PLoS Comput Biol 2006, 2(7):e86.
18. Rogers A, Antoshechkin I, Bieri T, Blasiar D, Bastiani C, Canaran P, Chan J, Chen WJ, Davis P, Fernandes J, Fiedler TJ, Han M, Harris TW, Kishore R, Lee R, McKay S, Müller HM, Nakamura C, Ozersky P, Petcherski A, Schindelman G, Schwarz EM, Spooner W, Tuli MA, Van Auken K, Wang D, Wang X, Williams G, Yook K, Durbin R, et al: WormBase 2007. Nucleic Acids Res 2008,
36(suppl 1):D612–D617.
19. Stein LD, Bao Z, Blasiar D, Blumenthal T, Brent MR, Chen N, Chinwalla A, Clarke L, Clee C, Coghlan A, Coulson A, D'Eustachio P, Fitch DH, Fulton LA, Fulton RE, Griffiths-Jones S, Harris TW, Hillier LW, Kamath R, Kuwabara PE, Mardis ER, Marra MA, Miner TL, Minx P, Mullikin JC, Plumb RW, Rogers J, Schein JE, Sohrmann M, Spieth J, et al: The genome sequence of caenorhabditis briggsae: a platform for comparative genomics. PLoS Biol 2003, 1(2):e45. 20. Fuxman Bass JI, Tamburino AM, Mori A, Beittel N, Weirauch MT,
Reece-Hoyes JS, Walhout AJM: Transcription factor binding to Caenorhabditis elegans first introns reveals lack of redundancy with gene promoters. Nucleic Acids Res 2014, 42(1):153–162.
21. Yeo GW, Van Nostrand EL, Liang TY: Discovery and analysis of evolutionarily conserved intronic splicing regulatory elements. PLoS Genet 2007, 3(5):e85.
22. Ke S, Chasin LA: Intronic motif pairs cooperate across exons to promote pre-mRNA splicing. Genome Biol 2010, 11(8):R84.
23. Fairbrother WG, Yeh RF, Sharp PA, Burge CB: Predictive identification of exonic splicing enhancers in human genes. Science2002, 297(5583):1007–1013.
24. Goren A, Ram O, Amit M, Keren H, Lev-Maor G, Vig I, Pupko T, Ast G: Comparative analysis identifies exonic splicing regulatory sequences–The complex definition of enhancers and silencers. Mol Cell 2006, 22(6):769–781.
25. Ray D, Kazan H, Cook KB, Weirauch MT, Najafabadi HS, Li X, Gueroussov S, Albu M, Zheng H, Yang A, Na H, Irimia M, Matzat LH, Dale RK, Smith SA, Yarosh CA, Kelly SM, Nabet B, Mecenas D, Li W, Laishram RS, Qiao M, Lipshitz HD, Piano F, Corbett AH, Carstens RP, Frey BJ, Anderson RA, Lynch KW, Penalva LO, et al: A compendium of RNA-binding motifs for decoding gene regulation. Nature 2013, 499(7457):172–177.
26. Ray D, Kazan H, Chan ET, Pena Castillo L, Chaudhry S, Talukder S, Blencowe BJ, Morris Q, Hughes TR: Rapid and systematic analysis of the RNA recognition specificities of RNA-binding proteins. Nat Biotechnol 2009, 27(7):667–670. 27. Altschul SF, Madden TL, Schäffer AA, Zhang J, Zhang Z, Miller W, Lipman DJ:
Gapped BLAST and PSI-BLAST: a new generation of protein database search programs. Nucleic Acids Res 1997, 25(17):3389–3402.
28. Pérez I, Lin CH, McAfee JG, Patton JG: Mutation of PTB binding sites causes misregulation of alternative 3' splice site selection in vivo. RNA 1997, 3(7):764–778.
29. Mukhopadhyay NK, Kim J, Cinar B, Ramachandran A, Hager MH, Di Vizio D, Adam RM, Rubin MA, Raychaudhuri P, De Benedetti A, Freeman MR: Heterogeneous nuclear ribonucleoprotein K is a novel regulator of androgen receptor translation. Cancer Res 2009, 69(6):2210–2218. 30. Cavaloc Y, Bourgeois CF, Kister L, Stévenin J: The splicing factors 9G8 and
SRp20 transactivate splicing through different and specific enhancers. RNA 1999, 5(3):468–483.
31. Pilgrim D: CeRep25B forms chromosome-specific minisatellite arrays in caenorhabditis elegans. Genome Res 1998, 8(11):1192–1201.
32. Blumenthal T: Trans-splicing and polycistronic transcription in Caenohabditis elegans. Trends Gen 1995, 11(4):132–136.
33. Li YC, Korol AB, Fahima T, Nevo E: Microsatellites within genes: structure, function, and evolution. Mol Biol Evol 2004, 21(6):991–1007.
34. Jurka J, Kapitonov VV, Pavlicek A, Klonowski P, Kohany O, Walichiewicz J: Repbase Update, a database of eukaryotic repetitive elements. Cytogenet Genome Res 2005, 110(1–4):462–467.
35. Naclerio G, Cangiano G, Coulson A, Levitt A, Ruvolo V, La Volpe A: Molecular and genomic organization of clusters of repetitive DNA sequences in Caenorhabditis elegans. J Mol Biol 1992, 226(1):159–168. 36. Uyar B, Chu JSC, Vergara IA, Chua SY, Jones MR, Wong T, Baillie DL,
Chen N: RNA-seq analysis of the C. briggsae transcriptome. Genome Res 2012, 22(8):1567–1580.
37. Rukov JL, Irimia M, Mørk S, Lund VK, Vinther J, Arctander P: High qualitative and quantitative conservation of alternative splicing in caenorhabditis elegans and caenorhabditis briggsae. Mol Biol Evol 2007, 24(4):909–917. 38. Grün D, Kirchner M, Thierfelder N, Stoeckius M, Selbach M, Rajewsky N:
Conservation of mRNA and protein expression during development of C. elegans. Cell Reports 2014, 6(3):565–577.
39. Balvay L, Libri D, Fiszman MY: Pre-mRNA secondary structure and the regulation of splicing. BioEssays 1993, 15(3):165–169.
40. Solnick D: Alternative splicing caused by RNA secondary structure. Cell 1985, 43(3, Part 2):667–676.
41. Raker VA, Mironov AA, Gelfand MS, Pervouchine DD: Modulation of alternative splicing by long-range RNA structures in Drosophila. Nucleic Acids Res 2009, 37(14):4533–4544.
42. Jin Y, Yang Y, Zhang P: New insights into RNA secondary structure in the alternative splicing of pre-mRNAs. RNA Biol 2011, 8(3):450–457. 43. Graveley BR: Mutually exclusive splicing of the insect Dscam pre-mRNA
directed by competing intronic RNA secondary structures. Cell 2005, 123(1):65–73.
44. Goecks J, Nekrutenko A, Taylor J, Team TG: Galaxy: a comprehensive approach for supporting accessible, reproducible, and transparent computational research in the life sciences. Genome Biol 2010, 11(8):R86. 45. Blankenberg D, Von Kuster G, Coraor N, Ananda G, Lazarus R, Mangan M,
Nekrutenko A, Taylor J: Galaxy: a web-based genome analysis tool for experimentalists. Curr Protoc Mol Biol 2010, Chapter 19:Unit 19 10 11-21. 46. Giardine B, Riemer C, Hardison RC, Burhans R, Elnitski L, Shah P, Zhang Y,
Blankenberg D, Albert I, Taylor J, Miller W, Kent WJ, Nekrutenko A: Galaxy: A platform for interactive large-scale genome analysis. Genome Res 2005, 15(10):1451–1455.
47. Rice P, Longden I, Bleasby A: EMBOSS: the European molecular biology open software suite. Trends Gen 2000, 16(6):276–277.
48. Blankenberg D, Taylor J, Schenck I, He J, Zhang Y, Ghent M, Veeraraghavan N, Albert I, Miller W, Makova KD, Hardison RC, Nekrutenko A: A framework for collaborative analysis of ENCODE data: making large-scale analyses biologist-friendly. Genome Res 2007, 17(6):960–964.
49. Eden E, Navon R, Steinfeld I, Lipson D, Yakhini Z: GOrilla: a tool for discovery and visualization of enriched GO terms in ranked gene lists. BMC Bioinformatics 2009, 10:48.
50. Eden E, Lipson D, Yogev S, Yakhini Z: Discovering motifs in ranked lists of DNA sequences. PLoS Comput Biol 2007, 3(3):e39.
doi:10.1186/1471-2164-15-364
Cite this article as: Glauser: The multiplicity of alternative splicing decisions in Caenorhabditis elegans is linked to specific intronic regulatory motifs and minisatellites. BMC Genomics 2014 15:364.
Submit your next manuscript to BioMed Central and take full advantage of:
• Convenient online submission
• Thorough peer review
• No space constraints or color figure charges
• Immediate publication on acceptance
• Inclusion in PubMed, CAS, Scopus and Google Scholar
• Research which is freely available for redistribution
Submit your manuscript at www.biomedcentral.com/submit