HAL Id: hal-02987496
https://hal.archives-ouvertes.fr/hal-02987496
Submitted on 7 May 2021
HAL is a multi-disciplinary open access
archive for the deposit and dissemination of
sci-entific research documents, whether they are
pub-lished or not. The documents may come from
teaching and research institutions in France or
abroad, or from public or private research centers.
L’archive ouverte pluridisciplinaire HAL, est
destinée au dépôt et à la diffusion de documents
scientifiques de niveau recherche, publiés ou non,
émanant des établissements d’enseignement et de
recherche français ou étrangers, des laboratoires
publics ou privés.
Distributed under a Creative Commons Attribution| 4.0 International License
Growth and egg production of female Calanus
finmarchicus: an individual-based physiological model
and experimental validation
François Carlottil, Hans-Jürgen Hirche
To cite this version:
François Carlottil, Hans-Jürgen Hirche. Growth and egg production of female Calanus finmarchicus:
an individual-based physiological model and experimental validation. Marine Ecology Progress Series,
Inter Research, 1997, 149, pp.91-104. �10.3354/meps149091�. �hal-02987496�
Vol. 149: 91-104, 1997 MARINE ECOLOGY PROGRESS SERIES
M a r Ecol Prog S e r Published April 10
Growth and
egg
production of female
Calanus finmarchicus:
an individual-based
physiological model and experimental validation
Franqois Carlottil.: Hans-Jiirgen ~ i r c h e ~
'Universite P. et M. Curie (Paris VI), C.N.R.S.- I.N.S.U., URA 2077, Station Zoologique, BP 28, F-06230 Villefranche-sur-Mer, France 'Alfred Wegener Institute ior Polar and Marine Research, Kolumbusstr. 1, D-27656 Bremerhaven, Germany
ABSTRACT: A detalled individual-based model of e g g production of Calanus finmarchic~ls is pro- posed. Female growth and egg product~on are represented by 8 state variables (gut content, nutrient pool, structural body, 011 sac, and 4 stages of oocyte m a t u r a t ~ o n ) which are regulated by physiolog~cal processes. Clutch size is set constant under continuous food condi.tions, but the spawning interval changes with food ava~lability and temperature depending on the rate of oocyte maturation. S n ~ a l l e r clutches can occur when e g g s are released under bad external conditions. Thus changing conditions can produce different clutch size distributions. For model validation, e g g production experiments were conducted under different constant a n d fluctuating food concentrations and compared with model simulations. In the experiments, egg production was strongly affected by food fluctuation. In experi- ments with alternating feeding and starvation cycles integrated egg production was affected by mean food concentration during the experiment rather than by the frequency of the cyrlcs. The model repro- duces correctly the e g g production rates and final body carbon of females kept In the different food regimes. It p r o v ~ d e s a dynamical explanat~on of physiolog~cal responses of the ~ n d ~ v ~ d u a l under short- term food variation. When food becomes unavailable, the most advanced oocytes are released and egg production continues untll the nutrient pool decreases below a minimal critical value. Thereafter, no eggs are laid. When food reappears, somatic growth resumes until structural body weight is restored. then oogenesis is fuelled. Experimental results were simulated correctly without using matter from the l ~ p l d pool.
K E Y WORDS: Calanus finn~archicus . Egg production Physiological model . Growth
INTRODUCTION
The copepod Calanus finmarchicus is a key species in the pelagic system of the northern North Atlantic, where it is a n important link between phytoplankton a n d fish populations that feed on Calanus spp. eggs a n d juveniles during the early larval stages (Runge 1988, Ohnian & Runge 1994) Due to C. finmal-chicus reproductive strategy, its breeding is much more episodic than that of smaller copepod species, for whom it is more continuous (Frost 1985, Marshal1 1949). This high variability in recruitment has a strong bearing on higher trophic levels in Calanus-dominated
systems, but also on the phytoplankton through the changing grazing pressure (Carlotti & Radach 1996). The reprod.uctive biology of C. finmarchlcus IS there- fore a key process both for the dynamlcs of Calanus populations a n d the ecosystem in which they develop. T h e reproductive biology of Calanus finmarchicus has been studied extensively in the laboratory under different food and temperature conditions (Runge 1985, Hirche et al. 1997) a n d In the field in different regions ( e . g . Marsh.al1 & Orr 1955, Runge 1985, Hirche 1990, Die1 & Tande 1992, O h m a n & Runge 1994) a n d has recently been reviewed by Hirche (1996). However, these studies have not integrated female reproductive physiology with growth a n d general metabolism.
Sciandra et al. (1990) presented a physiological model of the e g g production of Centropages typicus 0 lnter-Research 1997
92 Mar Ecol Prog Ser 149: 91-104, 1997
which was consistent with experimental data of egg Razouls et al. 1986, 1987, Ianora et al. 1989). Niehoff
production in constant and varying food conditions. & Hirche (1996) have recently studied in detail the oo- They showed that there is not a simple relationship genesis and spawning cycle of Calanus finmarchicus, between food availability and egg production and that and distinguished 1 type of oogonia and 4 types of the pool of metabolic reserves and the processes of oocytes at different stages of maturation. The represen- oogenesis play a n important role in the dynamics of tation of a completely linear flux of matter from one
egg production. Their model was designed to simulate oocyte compartment to the next one, as in Sciandra et results of experiments under conditions of constant al.'s (1990) model, does not agree with the experimental temperature and fluctuating food (Nival et al. 1990). results for these processes. Instead, the model should However, there are 2 main reasons why the model of represent a transfer of oocytes between 'maturity' com- Sciandra et al. (1990) cannot be coupled with a popula- partments in the gonad, and a flux of nutritive matter tion dynamics model or be used to simulate field from the nutrient pool of the hemolymph towards the situations. Firstly, in Sciandra et al.'s (1990) model the oocytes in each maturity compartment. After growing organism is only represented by the gut, the gonads from these nutrients and reaching a certain maturation a n d the metabolic reserves. The structural weight, state, oocytes should be transferred to the following which represents hemolymph, cuticule a n d muscles, is maturity compartment until ready to be spawned. missing. Considerable changes of weight of individual The purpose of this study is to present a complete copepods, mainly related to temperature and feeding model of the reproduction of female Calanus fin- conditions, have been reported both for small cope- marchicus including updated knowledge on the pods such a s Centropages spp. (Razouls & Guiness physiological processes involved in its development
1973, Klein Breteler & Gonzalez 1982), and for large from the newly moulted adult to maturity. To validate species such as Calanus spp. (Carlotti et al. 1993). Sev- such a model, experiments of egg production were era1 authors have shown that the egg production of conducted under both constant food and starvation
female copepods is related to their weight or length conditions as well as in feeding-starvation cycles of dif-
(e.g. Corkett & McLaren 1969, Smith & Lane 1985, ferent frequencies. Hirche 1990). There a r e marked interspeciflc differ-
ences in the response to starvation. In contrast to Cen-
tropages spp. females, which survive starvation only a MODEL CONCEPTUALISATION few days (3 to 8 d; authors' pers, obs.), females of
Calamus spp. can survive long periods of unfavourable We consider that somatic growth and egg production conditions and resume spawning thereafter (Runge of female Calanus can be represented basically with 1984, Hirche 1990, Hirche & Kattner 1993). To cor- 8 state variables (Fig. 1): the gut content, the nutrient
rectly represent the reproduction process in models of pool, the structural body, the oil sac, and 4 compart- population dynamics, which couple growth and devel- ments contalnlng different stages of oocyte maturation opment (e.g. Carlotti & Radach 1996), a realistic
model of egg production should include female Food growth and egg production. Secondly, the
dynamics of the flux of matter during e g g forma- tion should be represented. Sciandra et al. (1990, their Fig. 1) consider 1 compartment of metabolic reserves and 2 compartments representing 2 steps of egg formation, called oocytel and oocyte2. They proposed a linear flux of matter between these 3 compartments. In fluctuating food conditions, their model predicts the ob- served lag-time in the response of e g g produc- tion rates. These simulated lag-times, however,
result more from the mathematical properties of the transfer function used to represent the flux between successive compartments, the Hill
function acts as a buffer to lessen the use of the -,.
.
I . . , , I . . .
.
metabolic reserves, than from the representation F1g. diagram Of the State ...variables are connected by arrows denoting carbon
of the physiological properties of the copepod. fluxes. Dashed arrows denote transfer of oocytes in
v
Knowledge of egg formation is greatly in- terms of carbon through different compartments Eggs creasing (Blades-Eckelbarger & Youngbluth 1984, of maturity. ~ ~ m b o l s a r e explained in Table 1Carlotti & Hirche: Calanus finmarch~cus egg production model 93 -
a s described by Niehoff & Hirche (1996). Food a n d temperature, which a r e considered a s the most impor- tant external parameters for the survival of Calanus (Vidal 1980), a r e used a s forclng parameters.
T h e differential equations a n d the functions repre- senting these processes a r e listed in Table 1 a n d coef- ficient values are presented in Table 2 . As a unit of mass, pg C was chosen.
The ingestion function of Calanus finmarchicus takes into account the effect of food concentration following a Michaelis-Menten function; the effect of temperature following a n exponential function; a n d the effect of body weight following an allometric function. Values of the threshold food concentration (P,) and half- saturation concentration (PR) were taken from Gamble
(1978; s e e also Steele 1974). T h e coefficient of the allo- metric relationship between ingestion a n d weight (P,) is from Paffenhofer (1971). Using a maximum intr~nsic ingestion coefficient (P,) of 0.762 d - ' at O°C and a tem- perature increase of ingestion (P,) equal to 1.077, which corresponds to a Qlo of 2.1 (Gamble 1978), w e obtained for a female of 100 pg C maximum feeding rates of 40.2 pg C ind:' d ' at 10°C and 19.14 pg C ind.
'
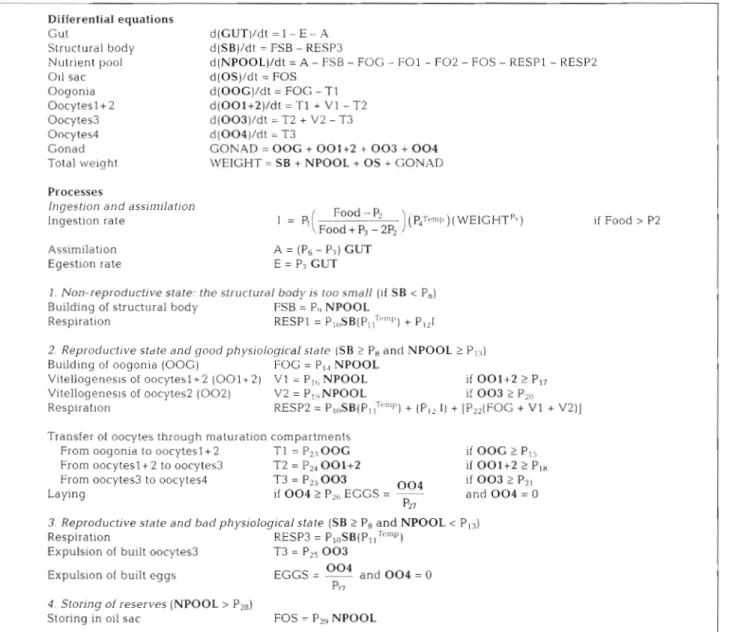
d-' a t 0°C. These ingestion rates a r e similar to experimental data obtained by Gamble (1978) a n d Tande & Bdmstedt (1985) at comparable temperatures. The gut transit time is ca 4 5 min for C. f i n m a r c l ~ ~ c u s (Hansen e t al. 1990), which is equivalent to 32 g u t turn- overs per day (P,). We assume that 3/, of the ingested matter is assimilated a n d 'L, is egested ( P 7 ) .Table 1 Differential equations and mathematical functions of model processes. Symbols of state variables are in bold. Rates of processes In condlt~ons not stated explicitly are equal to zrro. Temp: temperature. P, to P,,: biological parameters (see Table 2)
Differential equations Gut Structural body Nutrient pool Oil sac Oogonia Oocytesl+2 Oocytes3 Oocytes4 Gonad Total weight Processes
Ingestion and assimilation Ingestion rate
Assimilation Egestion rate
d(GUT)/dt = l - E - .A d(SB)/dt = FSB - KESP3
d(NPOOL)/dt = A - I-S13 - FOG - F 0 1 - F 0 2 - d(OS)/dt = FOS d(OOG)/dt = FOG - T1 d(001+2)/dt = T1 + V1 - T2 d ( 0 0 3 ) / d t : T2 + V2 - T3 d ( 0 0 4 ) / d t : T3 GONAD = OOG + 0 0 1 + 2
+ 0 0 3
+ 0 0 4
IVEIGHT = SB + NPOOL + OS+
GOYADFOS - RESP1-
1 = PI ( - ( ~ ~ l . ~ . t t > l ~ ) ( W E I G H T P ) )
Food +P, - 2P2
l
A = (P6 - P,) GUT E = P7 GUTI. Non-reproductive state: the structural body is too small (if SB < P,) Building of structural body FSB = P, NPOOL
Respiration RESP1 = P,,,sB(P~,T""'~') + P,,I
2. Reproductive stcrte and goodphys~ological state [SB 2 P, and NPOOL 2 P,.,) Building of oogonia (OOG) FOG = P,, NPOOL
Vitellogenesis of oocytesl+2 ( 0 0 1 + 2) V1 = P!,; NPOOL if 0 0 1 + 2 > P l 7 Vltellogenes~s of oocytes2 ( 0 0 2 ) V2 = P,,,NPOOL if 0 0 3 2 P,,,
Respiration RESP'L = P , , , S B ( P ~ ~ ' " ' ~ ' ) + ( P , , I ) + [P,2(FOG
+ V1
+ V2)] Transfer of oocytes through maturation compartmentsFrom oogonia to oocytes1+2 T1 = P?.) 0 0 G if OOG 2 P, ,. From oocytesl+2 to oocytes3 T2 = 0 0 1 + 2 if 0 0 1 + 2 t P,, From oocytes3 to oocytes4 T3 = PZ5 0 0 3 i f 0 0 3 2 P?1 Laying if 0 0 4 2 P:,, EGGS = - Oo4 a n d 0 0 4 = O
p27
3 Reproductive state a n d bad physiological state (SB 2 P8 and NPOOL c P,,)
Respiration RESP3 = P , ~ S B ( P ~
Expulsion of built oocytes3 T3 = PZ5 0 0 3
Expulsion of built eggs EGGS = - Oo4 and 0 0 4 = 0 P77
i f Food > P2
4 Storing of reserves (NPOOL > P2*)
Mar Ecol Prog Ser 149: 91-104, 1997
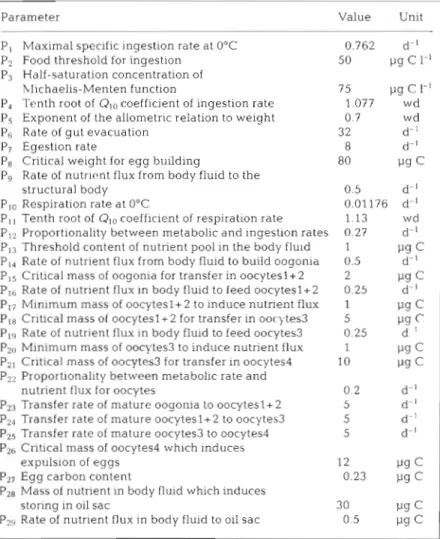
P, Maximal specific ingestion rate at O°C P2 Food threshold for ingestion
P3 Half-saturation concentration of hl~chaelis-Menten function
Pq Tenth root of Q,,, coefficient of ingestion rate PS Exponent of the allometric relation to weight P6 Rate of gut evacuation
P7 Egestion rate
P8 Crilcal weight for egg building
P9 Rate of nutrient flux from body fluid to the structural body
Plo Respiration rate a t O°C
P I l Tenth root of Q,, coefficient of respiration rate P12 Proportionality between metabolic and ingestion rates PI3 Threshold content of nutrient pool in the body f l u ~ d P,, Rate of nutrient flux from body fluid to build oogonia PI5 Critical mass of oogonia for transfer in oocytesl+2 P16 Rate of nutrient flux in body fluid to feed oocytesl+2 P17 Minimum mass of oocytesl+2 to induce nutrient flux P,, Crit~cal mass of oocytes1+2 for transfer in oocl-tes3 P,, Rate of nutrient flux in body fluid to feed oocytes3
Table 2. Parameter values used in the model. wd: dimensionless (P,,) and 4 % d-' of the structural weight at 0 and 1O0C, respectively
P;" Minimum mass of oocytes3-to induce nutnent flux
PZ1 Critical mass of oocytes3 for transfer in oocytes4 Pzz Proportionality between metabolic rate and
nutrient flux for oocytes
P2j Transfer rate of mature oogonia to oocytesl+2 P2, Transfer rate of mature oocytesl+2 to oocytes3 PzS Transfer rate of mature oocytes3 to oocytes4 P26 Critical mass of oocytes4 which induces
expulsion of eggs Egg carbon content
P2* Mass of nutrient in body fluid which induces storing in oil sac
P29 Rate of nutrlent flux in body fluid to oil sac
Parameter Value Unit
The assimilated matter fills a nutrient pool, which is the stock of nutritive matter in the hernolymph. The content of the nutrient pool can increase the structural weight, the oil sac, or the matter in the gonads de- pending on the physiological state of the animal (see Table 1). We present the processes of the model for 3 different physiological states: a n immature, a mature a n d a starving female.
Immature female. As in the model of Carlotti & Radach (1996), we consider that the female's structural body has to reach a critical weight value (PR) before assimilated energy can be used for building eggs. Below this value, energy is mainly used for structural growth. The rate of nutrient flux
(P9)
from the nutrient pool to the structural weight is assumed to be 0.5 d-' The nutrient pool also provides the metabolic ex- penses, which can be divided into 2 types: the basic metabolism proportional to the structural weight and the active metabolism proportional to ingestion. The basic metabolism depends on temperature following a Qlo equal to 3.4 (P,,), which gives rates equal to 1.18(Hirche 1987). Considering that 27% of the ingestion (Pl2) is used for active metabolism, such as for swimming and assimilation, we obtain respiration rates of growing females in optimum conditions of 6 and 15% d-l of the weight at 0 and 1O0C, respectively.
Mature female. When the female exceeds the critical structural weight, the flux from the nutrient pool is com- pletely directed towards the growth of eggs and metabolic requirements. At 10°C, this critical structural weight equals 80 pg C (P8). Carlotti et al. (1993) found that the weight of Cala- n u s finmarchicus females decreased when temperature increased with a slope of -14.84 pg dry wt per "C. We use the same function for the relation
1. between the critical structural weight 10
1
of spawning and temperature with a0.2 slope of 5.94 pg C per "C, assuming a 5 ratio of carbon:dry weight equal to 0.4.
5 The nutrient pool plays different
5 roles in egg formation. First, it permits 12 C the female to build a package of oogonia in the ovary. When the com-
0.23 pg C
partment 'oogonia' reaches a mass
30 P9
c
equal to 2 pg C (Pl5), the oogonia 0.5 are transferred to the compartment 'oocytesl+2' (P23), and the nutn- ent pool ensures the growth of 'oocytesl+2' by vitellogenesis 1 The transfer to the compartment 'oocytes3' (P,,) occurs when the total mass of 'oocytesl+2' through vitellogenesis 2 reaches a certain value (Pl8) equal to 5 1-19 C. The same process of growth and transfer occurs between the compart- ments 'oocytes3' and 'oocytes4' (Pz5). The mass thresh-old of 'oocytes3' is 10 pg C (P,,). The nutrient pool ensures the maturity of 'oogonia', and the vitellogene- sis of 'oocytesl+2' and 'oocytes3', but not for 'oocytes4' which is a step of shell formation. The flux of nutrient for the vitellogenes~s of 'oocytesl+2' and 'oocytes3' (parameters PI6 and P,,) occurs only if a minimum bio- mass of oocytes is present (parameters P17 and Pzo).
We assume that the respiration rate is the same for
immature and mature females with a n additional cost of energy (P,,) related to the formation of oogonia and oocyte maturation (see Table 1). A basic hypothesis of
our model is that clutch size does not vary with food,
temperature or body weight and is around 50 eggs (Hirche 1990, his Fig. 5; Hirche et al. 1997, their
Carlotti & Hirche: Cdlanus finm archicus e g g production model 95
Orr 1955), egg-laying is a discontinuous process: all eggs a r e spawned when the mass of the compartment 'oocytes4' is > l 2 pg C (P?,). The e g g carbon content (P,,) is equal to 0.23 pg C (Ohman & Runge 1994). In the presented simulations, we do not suppose any decreasing e g g production d u e to female senescence. Starving female. During long-term starvation the nutrient pool will decline strongly. When it falls below a minimum value (P,,), here defined a s 1 pg C , the basic metabolic requirements a r e ensured by the structural body itself The 'oocytes3' a n d 'oocytes4' present in the gonad a r e spawned quickly, regardless of the levels of maturity. When starvation lasts long enough, the structural weight decreases below the crit- ical weight for e g g production. When feeding condi- tions improve, the structural body should first b e I-estored.
Calanus finmarchicus accumulates lipids In a n oil sac. We assume that the excess of matter is stored a s lipids in the oil sac (Pzq) when the nutrient content in the hemolymph is above a threshold (Pz8) fixed at 30 pg. C .
MATERIAL AND METHODS OF EXPERIMENTS Female Calanus finmarchicus were collected in April 1994 in Korsfjorden, western Norway, from vertical tows from 200 m to the surface using a net 1 m in diam- eter a n d 500 pm mesh size, fitted with a non-filtering 14 1 codend. Single females were sorted and placed in 250 m1 containers as d e s c r ~ b e d in Hirche (1990). Nat- ural daylight illuminated the room through a window. Tn7o sets of egg production experiments under con- stant and fluctuating food conditions were conducted a t 10
+
1°C. The experimental schedule is shown in Fig. 2A. In the set of 11 d experiments ( E x p l ) , freshly caught females were fed 25000 cells ml-l of Rhodo- monas baltica for 2 to 4 d according to Nejstgaard e t al. (1995), who obtained optimum daily ration a t 1200 mg C m-"taking 47.4*
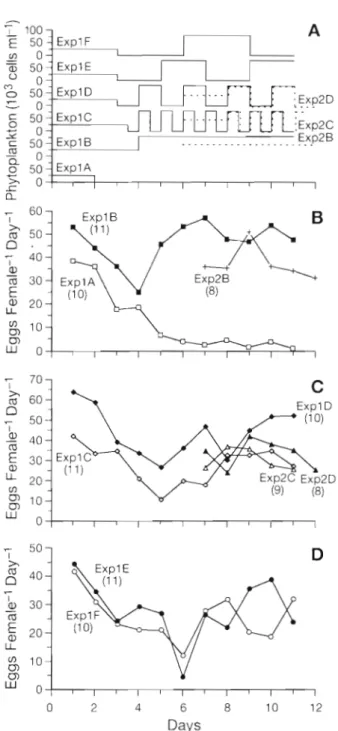
1 . 9 pg C cell-'; Berggreen et al. 1988). After this initial 2 to 4 d period, food was either removed completely (ExplA), given a t varying inter- vals ( E x p l C - F ) , or given steadily (ExplB). As e g g pro- duction decreased rapidly at 25 000 cells ml-', we used a concentration of 80000 cells ml-' (3792 1-19 C 1-l) for the rest of ExplB. Four experiments were conducted w ~ t h intervals of a 'LL d ( E x p l C ) , 1 d ( E x p l D ) , 2 d (ExplE) a n d 3 d (ExplF) starvation between high food concentration (80000 cells m]-'). For constant starva- t ~ o n ( E x p l A ) females were placed in filtered sea water (0.5 pm GFC flow through filtration system). Each experiment started with 11 single females; in 3 of the experiments 1 female was lost (dead or not spawning) The second set of experiments (Exp2) started 6 d after E x p l and lasted 5.5 (Exp2C) a n d 6 d (Exp2B a n dm- 0 - - o 50
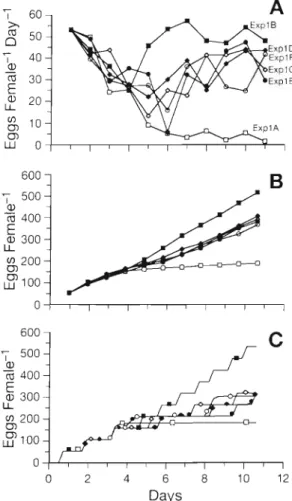
=
Expl D . . . , v- - - 50 -1 E x p l c :Exp2C C sn; ExolB . . . Exp2B I I I I I , 0 2 4 6 8 10 12 DaysFig. 2. Calanus Irnmarchicus. (A) Schedule of food concentra- tion offered for E x p l A to E x p l F ( s o l ~ d lines) and Exp2B to Exp2D (dotted 11nes); ( E ) spawning rates for E x p l ~ l , E x p l B a n d Exp2B; (C) spawnlng rates for ExplC, ExplD, Exp2C and Exp2D; ID) spawning rates for ExplE and ExplF. Numbers
of females i n brackets
Exp2D). In all 3 experiments food concentration w a s 40 000 cells ml-' of Rhodomonas during the first 2 d In addition to a constant food r e g ~ m e (Exp2B. 8 females), 2 experiments with alternating feeding (80000 cells ml-') versus starvation cycles of d (Exp2C, 8 females) a n d l d (Exp2D, 9 females) intervals were conducted.
Mar Ecol Prog Ser 149. 91 -104, 1997
T h e nutritive value of Rhodomonas baltica in terms
of carbon for Calanus finnlarchicus females was estl-
mated from our experimental results and by compari- son with other observations of egg production (Hirche et al. 1997). We assumed the carbon value available for the females at a concentration of 80 000 cells ml-' was
equal to 240 pg C I-'. The resulting portion of carbon
available/carbon content of 6 . 3 % was applied then to
the other algal concentrations r e s u l t ~ n g in 75 (25 OOO),
120 (40 000) and 240 1-19 C ml-' (80 000 cells ml-l). The resulting e g g production rates were consistent with data from Hirche et al. (1997; thesr Fig. 6A).
Food and water were changed every d in E x p l C
a n d Exp2B, and daily in all other experiments by transferring cylinders with bottom screen with females to another beaker. The remaining water was sieved through 50 pm a n d eggs were counted Immediately. At the e n d of ExplA-F and Exp2C, individual carbon content was determined after dipping females shortly into distilled water and storing them at -30°C until analysis by a high-temperature combustion technique (Salonen 1979).
EXPERIMENTAL RESULTS
Mean e g g production rates per female under dif- ferent feeding regimes are presented in Fig 2. In
Expl A-F e g g production declined during the first 3
(ExplE) or 4 (ExplA-D,F) days, showing no difference between fed and starved females. Initlal e g g produc- tion of freshly caught females ranged between 35 and 64 eggs female-' d-' and declined to 16 to 33 eggs female-' d-' at Day 4. We therefore concluded that the initial food concentration of 25 000 cells ml-' limlted e g g production. After increasing the food concentra- tion of ExplB to 80000 cells ml-l, egg production rate increased immediately and reached a plateau at the level of the initlal values 3 d later, whlle under starva- tion ( E x p l A ) mean e g g production continued decreas- ing (Fig. 2R). The mean total cumulative e g g produc-
tions were 134.7 eggs female-' (SD = 11.07) in ExplA
a n d 509.18 eggs female-' (SD = 30.18) in Expl B. With a constant food concentration of 40000 cells ml-' (Exp2B) females produced ca 35 eggs female-' d-', except on Day 9 (Fig. 2B). On this day, we registered the largest number of eggs spawned by 1 female (107),
w h ~ c h increased the mean value to 51.1 eggs female-'
d-' The total cumulative e g g productsons ranged be- tween 108 and 421 eggs female-' (mean = 229).
In the fluctuating food regimes ExplC-F (Fig. 2C, D), after adjustment to 80000 cells ml-' at Day 4, the rates increased with some fluctuations, but never reached the initial values. Instead, final e g g production ranged between 25 and 50 eggs female-' d-'. The comple-
mentary experiments Exp2C and Exp2D yielded egg
productions equal to 27 and 25.4 eggs female-' d.', respectively, similar to those obtalned in ExplC and ExplD except at the end (Fig. 2C). Egg production responded to the change of food concentration usually after one or 2 d. The mean total cumulative egg pro-
ductions were 321.9 eggs female-' (SD = 43.99) in
E x p l C , 484.0 eggs female-' (SD = 31.23) in ExplD,
286.5 eggs female-' (SD = 37.87) in ExplE, and
316.3 eggs female-' (SD = 28.9) in ExplF. In the com- plementary experiments, the mean total cumulative e g g productions over 6 d were 238.75 eggs female-'
(SD = 35.89) in Exp2B, 196.67 eggs female-' (SD =
32.74) in Exp2C, and 229.87 eggs female-' (SD = 25.47)
In Exp2D.
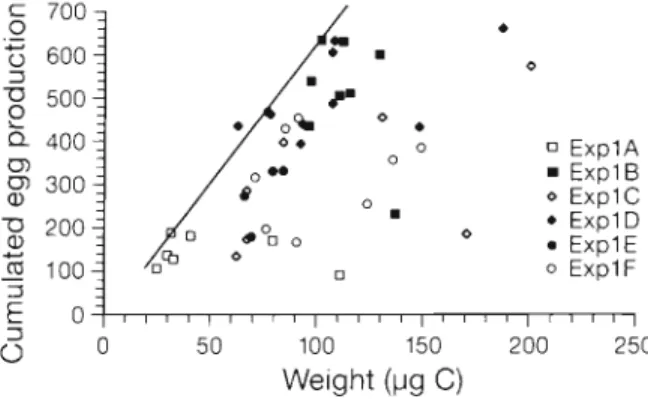
The relationship between the flnal carbon weight of females and their cumulative egg production d u n n g the 11 d of the first set of experiments is shown in Fig. 3. The females from starvation experiment ExplA had the lowest weights and e g g production, whereas females in constant food supply (ExplB) weighed be- tween 97 and 137 1.1g C and produced between 430 and 625 eggs, except for 1 individual with 231 eggs. Thss female produced eggs at a rate comparable to the majorlty of the other females for 4 d in the mlddle of the experimental period, otherwise it spawned very few eggs or none. Under fluctuating food regimes (ExplC-F), the ranges of final welghts (63 to 200 pg C ) and cumulated eggs (between 138 and 649) were very broad, but the data were always (except 1 case) under a line (see Fig. 3) of optimum egg production per glven female welght obtained by relating the highest egg production in starving and continuous food conditions. Clutch size and spawning interval could not be analysed directly in experiments with control intervals of 1 d (all expenments except ExplC a n d Exp2C), as spawning interval at this temperature is < l d (Hirche et al. 1997). However, in fluctuating food regimes
0 E x p l A E x p l B 0 E x p l C E x p l D E x p l E 0 E x p l F Weight (pg
C)
Fig 3 Calanus finmarchicus Cumulated egg product~on
versus carbon we~ght of females at the end of ExplA to
ExplF L ~ n e corresponds to the optlmum of egg product~on
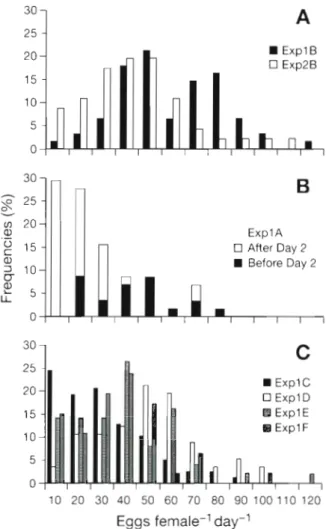
iarlotti & Hirche: Calanus fjnmarchicus e g g production model 9i B Expl B Exp2B ExplA U After Day 2 B Before Day 2 25 20 B ExplC Expl D 15 H Expl E 10 5 0 10 20 30 40 50 60 70 80 90 100110 120 Eggs
female-l day-'
Fig. 4 . Calanus flnmarchlcus Frequencies of daily egg pro-
duction. ( A ) Continuous f e e d ~ n g condition at 80000 cells ml-'
(ExplB) calculation done for Days 5 to l l , and at 40 000 cells
ml-' (Exp2B) for Days 6 to 12. (B) Starvation conditions for
(ExplA) Days 2 to 11 (C) For Days 5 to 11 in ExplC-F with
fluctuating food conditions between 80 000 and 0 cells ml-'
with controls at 'l2 d intervals ( E x p l C a n d Exp2C) w e analysed the daily number of spawned eggs and the absence or presence of eggs per day. Frequencies of daily egg productions at constant 80000 cells ml-l (ExplB) showed 2 peaks with one mode around 40 to 50 eggs female-' d-' and a second one around 70 to 80 eggs female-' d-' (Fig. 4A), indicating 2 clutch d e - positions by part of the females. At 40000 cells ml-l (Exp2B) only 1 peak occurred at 40 to 50 eggs f e m a l e ' d-' (Fig. 4A), indicating 1 clutch per day. Under star- vation (Fig. 4B), the frequencies of low daily e g g numbers were high, especially after Day 2. At '/z d feeding intervals ( E x p l C ) , 1 clutch d-' was observed most often. T h e e g g numbers produced during the feeding intervals (which were coincident with day- light) were 3 to 5 times higher than those produced over the starvation interval (coincident with night). The 1 d (ExplD), 2 d (ExplE) and 3 d (ExplF) fluctua-
tions produced similar distributions of daily e g g pro- duction with a n even distribution of clutches c59 eggs a n d a sharp decrease > 6 0 eggs female-' d.'. T h e high frequencies of low e g g productions compared to the reference experiment (ExplB) are notable.
MODEL RESULTS
Simulation of gonad maturation and e g g production A basic simulation of the dynamics of internal body compartments (see Fig. 1) is presented in Fig. 5. At the beginning of the simulation, the freshly moulted
- . . - Nutr~ent pool
A
-
Oogonia \-
-
Oocytesl+P,
Oocytes3 , . . . . Oocytes4 ;, \ - Gut I ' I ' I ' I I 4 6 8 10 DaysFig. 5 Basic run of the model at 10°C and a food supply of 400 pgC 1.' An effect of food depr~vation [thick horizontal line in (A)] is introduced between Days 5 and 7. Initial body weight was 93 pg C. with 80 p g C in the structural body. 10 pg C in the oil sac, and in 3 p g C in the nutrient pool. (A) Time course of carbon content of the state variables. (B) Cumula- tive e g g production per female. ( C ) Time course of the total
98 Mar Ecol Prog S e r
female Calanus finrnarchlcus has a total carbon con- tent of 93 pg C , of which 80 pg C a r e in the structural body, 10 pg in the oil sac, a n d 3 pg in the nutrient pool of the hemolymph. During the sirnulations, the a n ~ m a l IS exposed to a high food concentration of 400 pg C I-' for the first 5 d , starved for 2 d a n d then re-fed 400 pg C I-' for 3 more days (Fig. 5A) a t 10°C.
As t h e gut was empty at the beginning, its content increased qulckly a n d reached equilibrium around 1 pg C . T h e nutrient pool increased during the first 5 d , with a c h a n g e of the slope after 1.5 d . The nutrlent pool feeds the compartment of oogonia, which increased to a value of 2 pg C . T h e n , a balance occurred between the continuous matter flux for building oogonia (FOG) a n d the transfer flux ( T l ) from 'oogonia' to 'oocytesl+2' (see Fig. 1 ) . In the same way, the mass of 'oocytesl+2' increased a n d then stabilised when a flux (T2) from 'oocytesl+2' to 'oocytes3' occurred. As 'oocytes3' need more nutrients for vitellogenesis than previous stages, a higher pumping of nutrients was induced as seen in the change of the slope of the 'nutrient pool' after 1.5 d (Fig. 5A). When the mass of 'oocytes3' reached 10 pg C , a flux (T3) from 'oocytes3' to 'oocytes4' occurred. As for 'oogonia' and 'oocytesl+2', a balance occurred between input and output of matter in the compartment 'oocytes3'. In contrast, the last compartment 'oocytes4' fluctuated because the mass of eggs is spawned as a clutch when the biomass of 'oocytes4' reaches 12 pg C. The first clutch was produced 3 d after the beginning of the simulation, a n d new clutches w e r e produced every 0.9 d .
When deprived of food, the gut was quickly empty a n d the nutrient pool decreased. The compartments 'oogonia' a n d 'oocytesl+2' w e r e not affected by the food deprivation because either the nutrient pool still furnished enough matter to maintain vitellogenesis a n d development of oocytes, or the transfer of oocytes through the compartments IS stopped. The compart- ments 'oocytes3' a n d 'oocytes4' were not affected by the strong reduction of nutrients during the period of food deprivation, a n d a clutch of 52 eggs was produced before Day 6. When the nutrient pool became very low, just before Day 7, the animal ejected a fraction of its 'oocytes3' a n d 'oocytes4', a total of 32 eggs. When food was re-introduced, the nutrient pool increased a n d the female resumed e g g production. The first new clutch was deposited on Day 9, which is 2 d after the end of the starvation period.
T h e cumulated e g g production over time (Fig. 5B) shows better that (1) the period of food deprivation
induced the longest time interval between clutches (clutches 5 a n d 6) d u e to the lower flux between nutrient pool a n d early maturation stages, (2) an in- complete clutch is produced at Day 7 d u e to the
release of eggs present in the compartments 'oocytes3' a n d 'oocytes4', and (3) the delay of 2 d before for- mation of a new complete clutch on Day 9. The weight curve (Fig. 5C) shows a n increase until Day 3, a n d then fluctuates around a mean value, d u e to regular e g g production. The total weight immediately decreases d u e to food deprivation between Days 5 a n d 7. The weight increases as soon as the food re- plenishment occurs and recovers its mean spawning weight after 2 d .
Comparison between experimental data and model simulations
In order to compare experimental results to simula- t i o n ~ , the daily e g g production rates of ExplA-F at
0 2 4 6 8 1 0 1 2
Days
Fig 6 Companson of o b s e r v a t ~ o n s a n d s~rnulatlons of e g g p r o d u c t ~ o n of C a l a n ~ l s f i n r n a r c h ~ c u s for experiments E x p l A to E x p l F S e e symbols In Flg 3 ( A ) Normallzed spawnlng rates ( s e e Fig 2 ) with reference to the lnltial spakvnlng rate of E x p l B (B) Cumulative e g g productlon from normallzed
spawning rates (C) Simulated cumulative e g g product~on T h e simulated run w a s ~ n l t l a t e d for 5 d a t 400 p g C I ', before
Carlott~ & Hirche C a l i l n ~ ~ s fin1 ~riarchlcus egg product~on inodel 9 9
Day 1 have been shifted to the level of ExplB (Fig. 6 A ) . Cumulative egg productions over 11 d dur- ing ExplA-F were calculated from the normalised spawning rates (Fig. 6B). The 4 experiments with dif- ferent feedingktarvation intervals yielded between 350 a n d 410 eggs, between the values for starvation (190 eggs) and constant feeding (530 eggs).
The model was used to estimate e g g production by sirnulatlng the experimental conditions of ExplA-F (Fig. 6C). As the weight of freshly caught females at the beginning of the experiments was unknown, the model was run for 5 d at constant food concentrations of 400 pg C I-' The female then had a total weight of 131.24 1-19 and had already produced 3 clutches. Its structural weight was 80 pg C, the gonad 19.0 pg C, the nutrient pool 22.3 yg C , and the oil sac 10 1-19 C. Thereafter the model was run in the food regimes shown in Fig. 2A, between concentrations of food equal to 75 and 240 p g C l-' corresponding to the 25 000 a n d 80000 cells ml-' of Rhodomonas baltica, respectively.
As the model simulates the behaviour of 1 ~ndlvidual, the cumulated egg production over time appears as a step function, each step corresponding to a clutch Under starvation a n d constant food conditions, the model delivered daily rates and total cumulated e g g productions which compared well to experimental results. The simulations yielded a total of 528 eggs for constant food (ExplB) and just up to 300 eggs for the different fluctuating food reglmes, which is less than observed (between 350 and 410). During starvation the total number of eggs simulated was 182.
The observed and simulated weights at the end of the experiments are compared in Fig. 7. T h e mean weight of females after the experimental treatments showed considerable variability: after starvation (ExplA) the mean weight was 51 l ~ g C, whereas continuously fed females (ExplB) had a final mean weight equal to 113.1 pg C. For the fluctuating conditions the mean
6
700 0 E x p l A 600 E x ~ l B 0 E x p l C-?I
500 l E x p l D 'm m o l E x p l E.i
4 O j 0 E x p l F 'a ( o * ~ ' 1 L 3 0 50 100 150 0 Weight (pg C )Fig. 7. Cumulated egg production versus average carbon weight of Calanus finmarchicus females at the end of the experiments ExplA to E x p l F (with arrowheads) and at the
end of the simuldtlons (without arrowheads)
weights ranged between 76 and 112.1 pg C. At the end of the simulation, the weight of the starved female was 49.3 pg C and that of the constantly fed female 138.0 pg C . In fluctuating conditions, the simulations gave final weights higher than observed, ranging between 100.7 and 125.2 pg C. Part of this discrepancy may be explained by the fact that d u e to the weight of the clutch there is a 12 p g C difference between freshly spawned females and those close to spawning
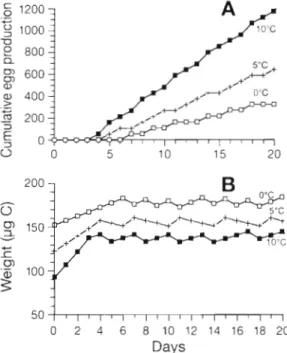
Effect of temperature
The effect of temperature on e g g production was tested in slmulations at 0, 5 and 10°C and at 400 pg C I-'. The cumulative e g g production and weight fluctua- tions a r e shown in Fig. 8 . The initial structural weight in each simulation corresponded to the critical spawn- ing weight, which is temperature dependent (see 'Model conceptualisation'). At 10°C, the weight sta- bilised at around 140 pg C and 1 to 2 clutches were produced daily, whereas at 5 and O°C, the weights reached 155 and 178 yg C , respectively, and a clutch was produced after 1 or 2 d , respectively. The respec- tive spawning intervals were 0.77, 1.33 and 2.33 d a t 10, 5 and 0°C. Clutch sizes changed slightly with 52.94, 52.82 and 52.76 eggs clutch-' for the same tempera- tures. At the beginning of e g g production, the weight showed only small fluctuations at all temperatures. The mass loss of each clutch does not show up because
50
0 2 4 6 8 10 12 14 16 18 20
Days
Fig. 8. Simulated (A) cumulative egg production and (B) total weight variations at 10, 5 and 0°C
100 Mar Ecol Prog Ser 149: 91-104, 1997
the curves are built with 1 value per day. The biomass of daily egg production varied overall by 5.20, 9.13, a n d 15.81 pg C d-l, and the daily carbon specific egg production by 2.92, 5.89, and. 11.29 d-' at 0, 5 and 10°C, respectively. From these values a Qlo of 3.07 was
calculated from the model.
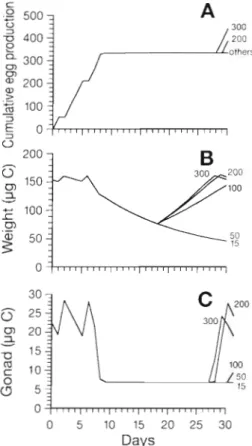
Effect of starvation a n d re-feeding
In a complementary set of simulations the behaviour of the model after a longer starvation period was studied. Hirche e t al. (1997) conducted egg production experiments with females kept for 6 d at surplus food concentration, then 12 d without food, and then fed 9 food concentrations for 9 d (their experiment EXP 11, their Fig. 4C). Our model was run using the same experimental conditions, but with 5 rather than 9 dif- ferent food concentrations for the last 9 d . The cumu- lated egg production and the time-course of body and gonad weights are presented in Fig. 9. To obtain con-
0
-0 5 10 15 20 25 30 Days
Fig. 9. Simulated (A) cumulative egg productions of Calanus
finmarchicus females, ( B ) carbon body weight and (C) gonad weight a t different food conditions. All females were kept at
optimal food conditions from Days 0 to 6, then without food
between Days 6 and 18. After Day 18, 5 food concentrations
were offered: 15, 50, 100, 200 and 300 pg C 1-' (see comple-
mentary explanat~ons in Hirche et al. 1997)
tinuously spawning females, the model was first run for 5 d at 240 pg C 1-' before being forced by the exper- imental conditions. During the first 6 d of the experi- ment, the simulated female weight was almost con- stant around 155 pg C , then decreased as soon as the food disappeared. Egg production increased regularly at the beginning, and stopped 3 d after the removal of food. This time lag corresponded to a decrease of gonad weight from 28 to 5 pg C over 3 d. The total egg production during the first 10 d stabilised around 330 eggs, which was lower than the production obtained by Hirche et al. (1997; around 380 eggs at Day 10). In their experiment, the clutches during the first 6 d were extremely large (their Fig. 6d).
DISCUSSION
Experiments
Rhodornonas baltica was not an optimal food for
Calanus finmarchicus. Its equivalent spherical dia- meter is between 6.9 and 8 pm (Berggreen et al. 1988, Nejstgaard et al. 1995) and therefore at the lower size limit of the filtering capacity of Calanus females (Frost 1972). In contrast to Nejstgaard et al. (1995), who obtained a maximum feeding rate at 25 000 cells rnl-' (see their Fig. 6), egg production decreased strongly at this concentration and instead very high algal concen- trations were necessary to obtain high egg production. We assumed that only a small fraction (6.3%) of the cells, probably the largest cells in the culture, were available for the females (see 'Material and methods of experiments' for estimation of the available fraction).
Egg production was closely related to food concen- tration, indicating consistency among experiments. The egg production rates obtained in freshly caught females (mean 47.2, SD 8.6) and after acclimation at 80 000 cells ml-' (ExplB; mean 51.2, SD 4.21 for Days 7 to 12) are comparable to those of Runge (1985) at 10°C. Bdmstedt (1988) observed similar rates in March in Ranne- fjord, Norway, a location near our sampling site. Die1
& Tande (1992) reported 21 to 23 eggs female-' d-' at 5°C. Higher rates (73.4 eggs female-' d-l) were re- ported by Hirche et al. (1997) at 8°C. However, carbon- specific production was very similar, as their females were much heavier. Experiments under fluctuating food conditions have not been reported yet for Calanus finmarchicus.
Hirche et al. (1997) found that clutch size was inde- pendent of the external variables and that mainly the spawning interval regulated egg production. In our experiments, under conditions of starvation and fluctu- ating food supply, the frequency of small clutches increased (Fig. 4). Thus, the production of small
Carlott~ & I-iirche Calanus fjnm arch~cos egg production model 101
clutches appears to be a transition process in the indi- vidual spawning dynamics induced by environmental fluctuations. This assumption is supported when the periods of e g g production in the starvation experiment E x p l A (Fig. 4B) a r e split. During the first 2 d of starva- tion, females produced a mean of 50 eggs, but vari- ability was high and frequency distribution of clutch size resembled experiments wlth fluctuating food con- ditions. After the second day eggs were produced only occasionally, a n d clutch size was mostly between 10 a n d 30 eggs, a s observed by Hirche e t al. (1997; their Fig. 10). If these results a r e compared with individual- based model results, it is important to note that the mean rate of individual e g g production does not repre- sent what happens a t the individual level during star- vation. The very sporadic e g g deposition a t the indi- vidual level is distorted by the mean value.
The range of female weights (25 to 200 pg C ) at the e n d of the different experiments was extremely large compared with the range of female weights observed in the field (Carlotti et al. 1993). The lightest indi- viduals were obtained from the starvation experiment (ExplA). Such low weights were not mentioned before: they correspond to the weight of a copepodite 5 (C5). Two of the starved females had final weights above 80 pg C , a value considered in the model as the critical moulting weight of C5 at 10°C. The most productive females (500 to 640 eggs) of the constant feeding experiment (ExplB) h a d weights around 110 pg C, a high weight value for females at 10°C as compared with field observations (Carlotti e t al. 1993). Thus, well-fed animals both accumulated body matter a n d produced eggs, suggesting that 80 000 cells ml-I was a n optimal food concentration. O n e female of ExplB had a low e g g production compared to the others, but a higher weight. From the fluctuating food experiments, we obtained large ranges both of weights a n d eggs produced, b'ut we never obtained females with high PI-oduct~on a n d extremely low weights. Our experimental results suggest that the females caught in April in Korsfjorden did not use lipid reserves to d a m p fluctuations of resources a n d , thus, to maintain continuous e g g production.
Model concept
It was the aim of this study to build a complete model of the e g g production of Calanus finmarchicus. Its different parts have not been equally validated. We can distinguish (1) the representation of metabolic a n d growth processes, (2) the representation of the gonad a n d the different growth a n d maturation pro- cesses, (3) the nutrient pool in the hemolymph, a n d (4) the representation of the reserve compartment.
(1) The metabolic rates of ingestion, assimilation, egestion a n d respil-ation used here have often been measured (i.e. Gamble 1978) and tested with models (Steele 1974, Carlotti & Radach 1996). These coeffi- cients permit correct representation of the growth of adult females of Calanus finmarchicus (Carlotti & Radach 1996).
( 2 ) We have considered 4 oocyte developmental stages in the gonad, according to recent studies of Niehoff & Hirche (1996). For a female spawning regu- larly (e.g. Days 3 to 5 in Fig. 5 ) the maturation compart- ments reach stable masses at 2, 5, 1 0 a n d 12 1-19 C , re- spectively. The masses of compartments 'oogonia, oocytesl+2, a n d oocytes3' a r e hypothetical; they were estimated from size measurements of different oocyte stages by Niehoff a n d Hirche (1996). T h e size of com- partment 'oocytes4' is equivalent to the size of 1 clutch of 50 eggs, assuming a n e g g carbon content of 0.23 p g C. Validation of t h e transfer of oocytes through the dif- ferent developmental stages (T1 to T3; Fig. 1) is difficult. We obtained a value of around 0.885 d at 10°C as com- pared to 0.75 d a t 5°C measured by Niehoff & Hirche (1996). T h e energetic processes linked to oogonia build- ing a n d oocyte maturation consist mainly of the accu- mulation of organic a n d inorganic constituents of yolk in the oocytes (vitellogenesis) of copepods. They have not been described yet quantitatively for copepods.
(3) In the model, we represented a nutrient compart- ment which plays a central role in the distribution of matter to either the structural body, or the gonads or the reserves compartment. Blades-Eckelbarger a n d Youngbluth (1984) assumed a n uptake of material from the hemolymph by 'oocytes3' of Labidocera aestjva, a n d Niehoff & Hirche (1996) found indications for this flux of matter for Calanus finrnarchicus. However, no information was found on the biochemical composition of the hemolymph of copepods. Spaargaren & Haefner (1994) studied the variations of protein, lipid a n d carbohydrate content of the hemolymph, ovary, a n d hepatopancreas of the brown shrimp Crangon crangon relative to ovarian development. Because hemolymph represents a means of transport between organs a n d equals 37 % of the body wet weight of C. crangon, the content of biochemical substances in the hemolymph is higher than contents in hepatopancreas a n d ovaries together. Comparable results have been observed for decapods (see review by Harrison 1990).
There is evidence that a real cost is associated with reproduction. Kiorboe et al. (1985) estimated the energetic cost to build 1 pg e g g C of Acartia tonsa equal to 0.188 pg C . If the same ratio is applied to Calanus finmarchicus, a production of 50 eggs d-' will induce a daily energetic cost of 2.16 p g C. T h e model predicts a n energy cost for e g g production (50 e g g s female-' d-l) equal to 2.61 1-19 C d-'.
Mar Ecol Prog Ser 149: 91-104. 1997
( 4 ) In our simulations no material accumulated in the 011 sac. The main reason is that the arbitrarily fixed threshold content of material in the hemolymph was never reached. The knowledge of the fluxes between oil sac and other compartments is weak, but it seems that the reserves compartment does not really play a role in the vitellogenesis 2 of Calanus finma~.chicus (Plourde & Runge 1993, Ohman & Runge 1994). To simulate variations of food over short periods as pre- sented in this paper, it is possible that the nutrient pool in the hemolymph is sufficient to serve a s a buffer. It is known that the oil sac is used to withstanding long- term starvation (Hbkanson 1984) Because the experi- mental females caught in the fjord in April were also spawning eggs on freshly assimilated food, we did not increase the complexity of the model by taking into ac- count the role of the oil sac in the egg production. For long-term or yearly simulations, the flux of matter from the oil sac to the nutrient pool has to be considered. The genital tractus and gonads a r e built in early winter time using organic content of the oil sac (Tande & Hop- kins 1981, Niehoff & Hirche 1996). In this model, w e did not consider hormonal processes, nor changes in biochemical components (Pillay & Nair 1973).
Model results
The simulations of individual trophodynamics a n d e g g production under different food conditions
(Expl A-F) reflected well the experimental time-course of egg production (Fig. 6) and final weights (Fig. 7). Both experiments and simulations showed that under fluctuating conditi.on.s (Fi.g. 6B, C between Days 5 and 11) the mean egg production is the same regardless of the fluctuation frequency, if mean food concentration is the same.
The model suggests a n interesting explanation for the response time of egg production when food is re- stored at different concentrations (Fig. 9): after a large weight decrease during the starvation period, females resume their growth if the food concentra- tion is sufficient. At 200 and 300 pg C 1-', the females succeed in spawning a clutch before Day 30. At 100 pg C 1-' the critical spawning weight is almost completely recovered at Day 30, while spawning was not resumed yet. These results are comparable to the experimental results shown by Hirche et al. (1997; their Fig. 4c).
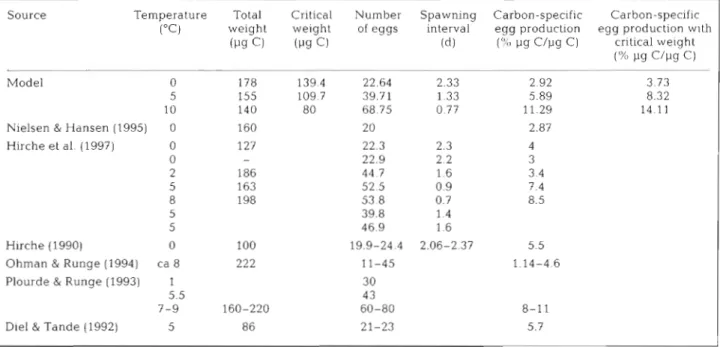
The simulation results obtained at different tem- peratures for mean weights, daily egg productions, spawning interval and carbon specific production are consistent with other data (Table 3). The cumulated egg production at 0 and 5°C are also in the ranges of observations (Hirche 1990, his Fig. 1; Hirche et al. 1997; their Fig. 1).
The good agreement of flnal mean weights, despite the unavoidable individual variability (Fig. 3 ) , confirms that the mathematical representation of metabolic and growth processes presented here is sound. The model
Table 3. Comparison between simulated results and observed data from other studies for weights and egg production parameters of Calanus finmarchicus, at different temperatures. Simulated carbon-specific egg production has been calculated using either
the total weight or the critical weight, as done by McLaren & Leonard (1995)
Source Temperature Total Critical. Number Spawning Carbon-spec~f~c Carbon-specific
("c)
weight weight of eggs interval egg production egg production w ~ t hcl
(Pgc)
( d ) ( X pg C/pg C) critical weightPS C / P ~ C )
Model 0 178 139.4 22.64 2.33 2.92 3.73
5 155 109.7 39.71 1.33 5.89 8.32
10 140 80 68.75 0.77 11.29 14.1 1
Nielsen & Hansen (1995) 0 160 20 2.87
Hirche et al. (1997) 0 127 22.3 2.3 4 0 - 22.9 2.2 3 2 186 44 7 1.6 3.4 5 163 52 5 0.9 7.4 8 198 53 8 0.7 8.5 5 39.8 1.4 5 46.9 1.6 Hirche (1990) 0 100 19.9-24.4 2.06-2.37 5.5
Ohman & Runge (1994) ca 8 222 11-45 1.14-4.6
Plourde & Runge (1993) 1 30
5.5 4 3
7-9 160-220 60-80 d-11
Carlotti & Hirche: Calanus finmai ~ h i c u s egg production model 103
clearly shows that variation of food induces immediate changes in weight but delayed response of e g g pro- duction (Fig. 5). After a certain duration of food depri- vation, when the threshold of the nutrient pool content is reached, the female spawns smaller clutches. This is consistent with our experiments involving starvation and fluctuating food (cf Fig. 4 ) . It is also consistent wlth observations of Peterson (1988), showing that the e g g production of Calan~is marshallae ceased com- pletely after 1 d of starvation, a n d was re-initiated after a n interval of 0.4 times the starvation interval. T h e response time of C. finmarchicus seems to b e longer. Based on observations of clutches in different food concentrations, Peterson (1988) suggested that 'egg production is a 2-step physiological process, one step involving the production of a clutch of eggs on a pre- determined schedule, a n d the second step involving the energetic controlling the number of e g g s within that clutch'. We also consider these 2 steps in e g g formation.
CONCLUSIONS
From the simulations presented and the con~parison with experimental data, the conceptual scheme of the present model cannot be rejected. The model provides dynamical explanations of d a t a . It emphasises the necessity to analyse daily e g g production, both in cor- relation with external (food and temperature varia- tions) and ~ n t e r n a l ( e . g , individual weight) factors. The reserves of the oil sac in adult females seem mainly to play a role in coping with the seasonal variation of food.
Sciandra et al. (1990) presented the first model of reproduction of calanoid copepods which represented a non-linearity between fluctuations of food a n d e g g production. They suggested the use of mathematical formulations which correctly simulate the time lag between variations of input a n d output. Our model represents a new step, because (1) it couples growth a n d e g g production of a female Calanus finmarchicus, a copepod with a more complex reproductive strategy; (2) it takes into account the influence of both food a n d temperature; a n d (3) it represents steps of e g g forma- tion which can b e experimentally observed. In Scian- dra et al.'s (1990) model n o clutches w e r e simulated, although Centropages typicus seems to produce clutches of eggs (Carlotti pers. obs.). Moreover, the data used to validate Sciandra e t al.'s (1990) model were not from experiments with single females, where mean values can induce misinterpretations. Also, their model delivered matter content in the gut equal to the matter content in the g0na.d (their Fig. 8 ) , which is not realistic.
As e g g production is a key process in population dynamics a n d in estiination of secondary production, we suggest relating results of e g g production to a mean food concentration a s measured over a period of several days and not to the food measurement on the sampling day alone. Population dynamics models taking into account the individual metabolic processes which influence growth a n d development still have a representation of the e g g production process which is too simple (Carlotti & Radach 1996) a n d should also represent important physiological time-lags (Tester & Turner 1990).
.4cknotuledgements. This work was funded by the Commis- sion of the European Community under contracts MAS2- CT93-0057 (ESOP) of the MAST-I1 Programme and MAS3- CT95-0039 (TASC) of the MAST-111 Programme. M'e appreciate the possibility to use the facilities of the Marin- biologisk Feltstasjon, Espegrend, University of Bergen, Nor- way. J. Wegner measured carbon contents. Thanks to B. Niehoff for useful discussions on gonad maturation and to C. Miller for editing of a n d comments on the manuscript. This is publication no. 1206 of the Alfred Wegener Institute for Polar and Marine Research, Brernerhaven and is a contribu- tion of LOBEPM (Laboratoire d'oceanographie Biologique et d'Ecologle du Plancton Marin).
LITERATURE CITED
Bimstedt U (1988) Ecolog~cal significance of individual vari- dbil~ty in copepod bioenergetlcs. Hydrobiologia 167/168: 43-59
Berggreen V, Hansen B, Klorboe T (1988) Food size spectra, lngest~on and growth of the copepod Acartia tonsa during development. implication for determination of copepod productlon M ~ I - B101 99.341-352
Blades-Eckelbarger P, Youngbluth MJ (1984) The ultra- structure of oogenesis and yolk formation in Labidocera aestlva (Copepoda: Calanoida) J Morph01 179:33-46 Carlotti F. Krause ILf, Radach G (1993) Growth and develop-
ment of Calanus finnlarchicus taking into account the effect of temperature. Limnol Oceanogr 38:1125-1134 Carlotti F, Radach G (1996) Seasonal dynamics of phyto-
plankton and Calanus finn~archicus in the North Sea a s revealed by a couplied one-dimensional model. Limnol Oceanogr 4 1:522-539
Corkett CJ. McLaren 1A (1969) Egg production and oil storage by the copepod Pseudocalanus in the laboratory. J Exp Mar Biol E c o l 3 : 9 0 1 0 5
Die1 S, Tande K (1992) Does the spawning of Calanus fin- marchicusin high latitudes follow a reproductible pattern? Mar Biol 113:21-31
Frost BW (1972) Effects of size and concentration of food par- ticles on the feeding behavior of the marine planktonic copepod Calanus pacificus. Limnol Oceanogr 1?:805-815 Frost BW (1985) Food limitation of the planktonic marine copepods Calanus pacificus and Pseudocalanus sp. in a temperature fjord. Arch Hydrobiol Beih Ergeb Limnol 21:l-13
Gamble J C (1978) Copepod grazlng during a declining spring phytoplankton bloom in the northern North Sea. Mar Biol 49:303-315
Mar Ecol Prog Ser 1 4 9 91-104, 1997
tion in field-caught Calanus pacificus, as determinined from the lipid content. Limnol Oceanogr 29:794-804 Hansen B, Tande KS, Berggreen UC (1990) On the trophic
fate of Phaeocystis pouchetij (Hariot). 111. Functional re- sponses in grazing demonstrated on juvenlle stages of Calanus finmarchicus (Copepoda) fed diatoms and Phaeo- cystis. J Plankton Res 12:1173-1187
Harrison KE (1990) The role of nutrition in maturation, repro- duction and embryonic development of decapod crusta- cean: a review. J Shellfish Res 9:l-28
Hirchc HJ (1987) Temperature and plankton. I1 Effect on respiration and swimming activity in copepods from the Greenland Sea. Mar Biol94:347-356
Hirche HJ (1990) Egg production of Calanus finrnarchicus at low temperature. Mar Biol 106:53-58
Hirche HJ (1996) The reproductive biology of the marine copepod. Calanus finmarchicus-a review Ophelia 44: 111-128
Hirche H J , Kattner G (1993) Egg production and lipid con- tent of Calanus glacialis in spring: indication of a food- dependent and food-independent reproductive mode. Mar Biol 117:615-622
Hirche HJ. Meyer U, Niehoff B (1997) Egg production of Calanus finmarchicus-effect of temperature, food and season. Mar Biol 127:609-620
Ianora A, Scotto di Carlo B, Mascellaro P (1989) Reproductive biology of the planktonic copepod Temora stylifera. Mar Biol 101 187-194
K i ~ r b o e T. Mshlenberg F, Hamburger K (1985) Bioenergetics of the planktonic copepod Acartia tonsa between feeding e g g production and respiration, and composition of spe- cific dynamic action. Mar Ecol Prog Ser 26:85-97
Klein Breteler WCM, Gonzales SR (1982) Influence of cultiva- tion and food concentration on body length of calanoid copepods. [Mar Biol 71:157-161
Marshall SM (1949) On the biology of small copepods In Loch Striven. J Mar Biol Ass UK 28:45- 122
Marshall SM, Orr AP (1955) The biology of a marine copepod. Oliver & Boyd, Edinburgh
McLaren IA, Leonard A (1995) Assessina the equivalence of . . growth and egg production of copepodS. ICES J Mar Sci 52:397-408
Nejstgaard J C , BAmsted U, Bagaien E, Solberg PT (1995) Algal constraints on copepod grazing. Growth state, toxicity, cell size, and season as regulating factors. ICES J Mar Sci 52:347-357
Niehoff B, Hirche HJ (1996) Oogenesis and gonadogenesis in the copepod Calanus finmarchicus and the prediction of egg production from preserved samples. Polar Biol 16: 601-612
Nielsen TG, Hansen B (1995) Plankton community structure and carbon cycling on the western coast of Greenland dur- ing and after the sedimentation of diatom bloom. Mar Ecol Prog Ser 125:238-257
Nival S, Pagano M, Nival P (1990) Laboratory study of the spawning rate of the calanoid copepod Centropages typi- cos: effect of fluctuati.ng food concentration. J Plankton Res 12:535-547
Ohman M , Runge J (1994) Sustained fecundity when phyto- plankton resources are in short supply: omnivory by Calanus finmarchicus in the Gulf of St. Lawrence. Limnol Oceanogr 39:21-36
Paffenhofer GA (1971) Grazing and ingestion rates of nauplii, copepodids and adults of the marine planktonic copepod Calanus helgolandicus. Mar Blol 11:286-298
This article was submitted to the editor
Peterson WT (1988) Rates of egg production by the copepod Calanus marshallae in the laboratory and in sea off Oregon, USA. Mar Ecol Prog Ser 47:229-237
P~llay KK, Nair NB (1973) Observations on the biochemical changes in gonads and other organs of Ucca annulipes, Portunus pelagicus and Metapenaeus affinis (Decapoda: Crustacea) during the reproductive cycle. Mar Biol 18: 167-198
Plourde S, Runge JA (1993) Reproduction of the planktonic copepod Calanus finmarchicus in the lower St. Lawrence Estuary: relation to the cycle of phytoplankton production and evidence for a Calanus pump. ]Mar Ecol Prog Ser 102:217-227
Razouls C, Guinness C (1973) Variation annuelles quantita- tives d e deux especes dominantes d e copepodes planc- tonique Centropages typicus et Temora stylifera d e la region d e Banyuls: cycle biologique et estimation d e la production. 11. Variation bidimentionnelles et mesure d e la croissance. Cah Biol Mar 14:413-427
Razouls S, Nival P, Nival S (1987) Development of the genital system in the copepodid stages of the calanoid copepod Temora stylifera Dana. J Mar Biol Ass UK 67:653-661 Razouls S, Nival S, Nival P (1986) La reproduction de Temora
stylifera: ses implications anatomiques en relation avec le facteur nutrition. J Plankton Res 8:875-889
Runge JA (1984) Egg production of the marine planktonic copepocl, Calanus p a c i f ~ c ~ i s Brodsky laboratory observa- t ~ o n s . J Exp Mar B101 Ecol 74:53-66
Runge JA (1985) Egg production rates of Calanus finmarch)- cusin the sea off Novia Scotia. Arch Hydrobiol Beih Ergeb Limnol 21:33-40
Runge JA (1988) Should we expect a relationship between primary production and fisheries? The role of copepod dynamics as a filter of trophic variability. Hydrobiologia 167/168:61-71
Salonen K (1979) A versatile method for rapid and accurate determination of carbon by high temperature combustion Limnol Oceanogr 24:177-185
Sciandra A, Gouze JL, Nival P (1990) Modelling the repro- duction of Centropages typicus (Copepoda: Calanoida) in a fluctuating food supply, effect of adaptation. J Plankton Res 12:542-572
Smith SL, Lane PVZ (1985) Laboratory studles on the marine copepod Centropages typicus, egg production and devel- opment rates. Mar Biol85:153-162
Spaargaren DH, Haefner PA Jr (1994) Interactions of ovary and hepatopancreas during the reproductive cycle of Crangon crangon (L ) 11. Biochemical relationships. J Crustacean Biol 14:6-19
Steele J H (1974) The structure of marine ecosystem. Harvard University Press, Cambridge
Tande KS, BAmstedt U (1985) Grazing rates of the copepods Calanus glacialis and C. finmarchicus in arctic waters of the Barents Sea. Mar Biol 87:251-258
Tande KS, Hopkins CCE (1981) Ecological investigations on the zooplankton community of Balsfjorden, northern Norway: the genital system in Calanus finmarchicus and the role of gonad development in overwintering strategy. Mar Biol63: 159-164
Tester PA. Turner J T (1990) How long does it take copepods to make eggs? J Exp Mar Biol Ecol 141:169-182
Vidal J (1980) Physioecology of zooplankton. I. Effects of phytoplankton concentration, temperature and body size on the growth rate of Calanus pacificus and Pseudo- calanus. Mar Biol 56.111-134
Manuscript first received: August 9, 1996 Revised version accepted: January 27, 1997