HAL Id: cea-01851364
https://hal-cea.archives-ouvertes.fr/cea-01851364
Submitted on 30 Jul 2018
HAL is a multi-disciplinary open access
archive for the deposit and dissemination of
sci-entific research documents, whether they are
pub-lished or not. The documents may come from
teaching and research institutions in France or
abroad, or from public or private research centers.
L’archive ouverte pluridisciplinaire HAL, est
destinée au dépôt et à la diffusion de documents
scientifiques de niveau recherche, publiés ou non,
émanant des établissements d’enseignement et de
recherche français ou étrangers, des laboratoires
publics ou privés.
FLUKA Calculation of the Neutron Albedo
Encountered at Low Earth Orbits
Arnaud Claret, Markus Brugger, Natacha Combier, Alfredo Ferrari, Philippe
Laurent
To cite this version:
Arnaud Claret, Markus Brugger, Natacha Combier, Alfredo Ferrari, Philippe Laurent. FLUKA
Calculation of the Neutron Albedo Encountered at Low Earth Orbits.
IEEE Transactions on
Nuclear Science, Institute of Electrical and Electronics Engineers, 2014, 61, pp.3363 - 3370.
�10.1109/TNS.2014.2361031�. �cea-01851364�
FLUKA Calculation of the Neutron Albedo
Encountered at Low Earth Orbits
Arnaud Claret, Markus Brugger, Natacha Combier, Alfredo Ferrari, and Philippe Laurent
Abstract—This paper presents Monte-Carlo simulations based
on the Fluka code aiming to calculate the contribution of the neu-tron albedo at a given date and altitude above the Earth chosen by the user. The main input parameters of our model are the solar modulation affecting the spectra of cosmic rays, and the date of the Earth’s geomagnetic field. The results consist in a two-parameter distribution, the neutron energy and the angle to the tangent plane of the sphere containing the orbit of interest, and are provided by geographical position above the Earth at the chosen altitude. This model can be used to predict the temporal variation of the neutron flux encountered along the orbit, and thus constrain the determi-nation of the instrumental background noise of space experiments in low earth orbit.
Index Terms—Albedo, cosmic rays, FLUKA, low earth orbit,
neutrons.
I. INTRODUCTION
T
HE performance level of imaging detectors operating at Low Earth Orbit (LEO) is degraded due to the neutron albedo produced in the Earth atmosphere. Generally, the back-ground levels of space experiments strongly increase due to high particle flux encountered in the South Atlantic Anomaly (SAA) or in polar caps during solar events, these particles being able to leave a trace on the detectors or activate their surrounding materials. Anyway, during SAA crossing or strong solar event, the background level is so high that imaging experiments are often switched off. As a result, the albedo neutrons can become the most important contribution to the background noise during the window of scientific operations. Most common background removal technics consist in estimating it by adjusting its inten-sity thanks to a function with two parameters, the geomagnetic latitude or the rigidity cutoff, plus a constant representing the internal background. The purpose of this paper is to calculate the albedo neutron flux all around the Earth in order to dis-entangle better the two noise components (neutron albedo and internal background). This overall neutron albedo depends on various factors such as the flux of incoming galactic cosmicManuscript received July 10, 2014; revised September 05, 2014; accepted September 23, 2014.
A. Claret and P. Laurent are with CEA-Saclay, DSM/IRFU/SAP, F-91191 Gif-sur-Yvette, France (e-mail: arnaud.claret@cea.fr).
M. Brugger and A. Ferrari are with CERN, CH-1211 Genève, Switzerland. N. Combier was with CEA-Saclay, DSM/IRFU/SAP, F-91191 Gif-sur-Yvette, France. She is now with Université Paris 7, APC, F-75205 Paris, France.
Color versions of one or more of the figures in this paper are available online at http://ieeexplore.ieee.org.
Digital Object Identifier 10.1109/TNS.2014.2361031
rays (GCR), a fraction of which reaching the Earth’s neighbor-hood depending on the solar cycle, and the Earth’s magnetic field acting as another attenuating filter. Our calculations can be performed at an altitude and date selected by the user, with a sufficiently small mesh to evaluate the temporal modulation of the flux as a function of the geographic locations overflown by an experiment in LEO.
The environmental parameters of the model, as well as phys-ical interactions taken into account, are presented in Section II. The main results are presented in Section III, and compared with other measurements obtained in the atmosphere and in space in Section IV. Finally, applications of the model are addressed in Section V.
II. MODEL
Our model is designed for determining the distribution of neutrons encountered in space, namely at the level of a sphere concentric to the terrestrial spheroid and situated at the user-se-lected altitude, which requires
1) the determination of the spectrum and composition of cosmic rays at the vicinity of the Earth, which is done here using an environment model found in the literature; 2) the determination of the trajectories of cosmic rays through
the Earth’s geomagnetic field, which is done here partly using an analytical approximation and partly using a Monte-Carlo code;
3) the transport of the surviving incident cosmic rays through the Earth’s atmosphere to various depths, as well as the production of secondary particles, which is done here using a Monte-Carlo code.
As each time a Monte Carlo model is used, several runs have been performed to determine a statistical error bar. For a given configuration (altitude above the Earth, and date with respect to geomagnetic field and solar cycle), approximately 40 CPU-core days were required to perform the necessary Monte Carlo simulations. Key information about the ingredients used in our model, as well as simplifying assumptions, is given below and additional details can be found in [1] and [2].
A. Cosmic Rays
Incoming particles at the origin of the Earth’s albedo are the galactic cosmic rays (GCR), which are modulated by the solar activity and attenuated by geomagnetic effects. In this study, we use the GCR spectra derived by the Badwhar and O’Neill (BO) model, which covers all elemental groups from to
, and considers the solar modulation through the parameter . The last version (2010) of the BO model [3] is the only GCR model that utilizes all of the GCR measurements made from
2 IEEE TRANSACTIONS ON NUCLEAR SCIENCE
Fig. 1. Cosmic protons: black dotted spectra correspond to extreme values of the solar modulation parameter, and blue ones to more standard values for min-imum and maxmin-imum periods, both derived from the latest version (2010) of the BO model. The spectra used in this study (red) are derived from the older ver-sion (1996) of the BO model but slightly adjusted (see text).
1955 to 2010, so it would have sound natural to use it. Never-theless, for consistency purpose with previous studies based on the same physical model as the present one (see Section II-D), we preferred to use the same spectra of incoming GCR as those previously used, namely those of the older version of the BO model (1996), which were slightly modified to follow recent data sets (from AMS on-board the Discovery shuttle in 1998 and BESS balloon flights in 2001) up to 100 GeV according to the so-called ICRC2001 fit [4]. As an example, the proton spectra used in our model are illustrated in Fig. 1, where they are compared to the most recent version of the BO model (2010) for various solar modulation parameters. The spectrum is almost identical for solar min conditions, and slightly above for solar max conditions (within a factor 2 below 1 GeV). The last ver-sion of the BO model (2010) also provide the spectra of species with , but only on the basis of their relative abundance multiplied by the silicon spectrum ( ) since flux measure-ments are essentially nonexistent [3]. In our study, we consid-ered that since species with are several orders of magni-tude less abundant then the others, their contribution to the neu-tron albedo should be negligible in almost the same proportion.
B. Particle Transport
The particle transport is realized in two steps, the first one concerning the incoming GCRs before their interaction with the atmosphere, and the second one concerning all GCR prod-ucts after the collision with the atmosphere. The spectra of in-coming GCRs are used together with an analytical calculation of the rigidity cutoff, i.e., the Störmer formula [5], according to the tilted eccentric dipole approximation of the Earth magnetic field that depends on the date chosen by the user. Doing that ap-proximation instead of transporting all GCRs in the actual ge-omagnetic field, such as for the IGRF (International Geomag-netic Reference Field), allows saving a lot of computing time without significantly affecting the accuracy of final results. The sampling of the incoming particles is first set at a distance of 10 000 km from the center of the terrestrial spheroid according to a uniform and isotropic fluence. The Störmer equation is then used to determine if a given cosmic particle can reach that al-titude according to its energy, direction and the local
geomag-netic coordinates. If this is the case, then the primary cosmic ray and all secondary particles possibly induced by the colli-sion with the atmosphere are handled by the Monte-Carlo code FLUKA [6], [7]. Below 10 000 km far from the center of the Earth, all particles are transported until the atmosphere and in-side, either downward to the ground or upward to the space, but using this time the detailed geomagnetic field IGRF, rather than using the eccentric dipole approximation mentioned above for the tracking from infinity down to 10 000 km. Of course, this has no influence for neutral particles but is of importance for charged particles such as incoming GCRs and secondary charged particles. In our model, the IGRF field used for the par-ticle transport is computed analytically for each position of all particles according to the description given in [8], and imple-mented as described in [1].
C. Earth’s Atmosphere and Ground
The Earth’s atmosphere is represented as a superposition of 100 spherical concentric layers following the density profile of the U.S. Standard dry atmosphere, with atmospheric depth of 0.092 g/cm at the highest altitude (70 km) and 1033.4 g/cm at ground level. Only three species have been considered (ni-trogen, oxygen, and argon), the other ones representing less than 0.04% of the total. All layers have been set to the same com-position (volume fractions of N , O and 1% Ar), which corresponds to the simplest hypothesis but also the most reliable. The surface of the Earth is considered as a 100% ab-sorbing material, which means that the albedo from the ground itself is neglected in our model.
D. Particle Interactions
Concerning physical interactions, a number of tools have been developed for the FLUKA code to accurately simulate the production of secondary particles induced by primary cosmic rays interacting with the Earth’s atmosphere. These tools have already been used for fundamental physics research [9], parti-cles observed in near Earth orbit [10] or radiation protection at aircraft altitudes [11]. Through these studies, dedicated to the calculation of various particle fluxes in space (protons, electrons and positrons) or in the atmosphere (neutrons, neu-trinos), the code has already been successfully validated. This is the main reason why we used FLUKA instead of Geant4, which is also well suited for this kind of studies. The version of FLUKA used is 2013, which includes all the features of the 2012 package together with many further options that are not yet included in the official releases.
We just recall here briefly the hadronic models used in FLUKA to describe nonelastic interactions. The “low-inter-mediate” one, called Pre-Equilibrium Approach to NUclear Thermalization (PEANUT), which covers the energy range from about 5 GeV down to reaction threshold (or 20 MeV for neutrons). The high energy one, called Dual Parton Model (DPM), which can be used up to several tens of TeV, based on the color string and quark confinement models.
Even if we do not expect that our profile of neutron flux de-rived as a function of the altitude is perfectly representative of what can be measured on the ground, it is still interesting to check that both the order of magnitude and the general shape
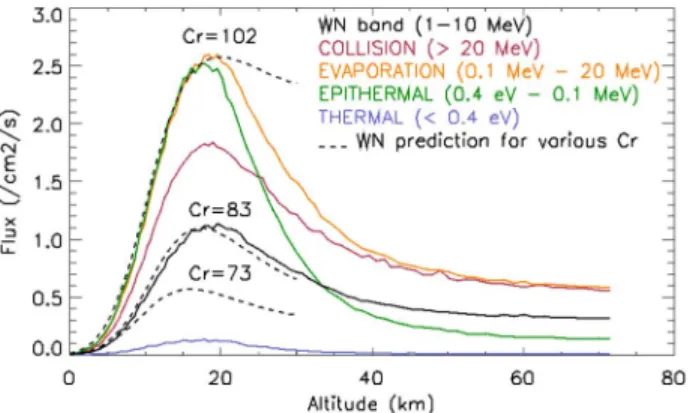
Fig. 2. Neutron production in dry atmosphere above New York for solar min conditions, expressed as fluxes integrated in various energy bands associated to the collision and the evaporation peaks, the epithermal plateau and the thermal neutrons. Our 1–10 MeV flux (dark solid line) is compared with the Wilson–Nealy (WN) model computed for various values of Cr (dark dashed lines).
are correct. We computed the neutron flux profile above New York in a dry atmosphere, using the IGRF 2010 magnetic field and taking the solar modulation at 465 (solar minimum condi-tions). The result is displayed in Fig. 2 for various energy bands, each of them corresponding to a specific region of the spectrum of atmospheric neutrons. We note that the maximum produc-tion is encountered at different altitudes depending on which en-ergy band the flux is integrated. As expected, the contribution of thermal neutrons ( eV) appears to be negligible at space al-titudes. In Fig. 2, our neutron flux is integrated in the 1–10 MeV band and compared with the model of Wilson and Nealy [12], which provides this integrated flux as a function of the local rigidity (2.08 GV for New York), the atmospheric depth (i.e., altitude) and the coefficient Cr (relative neutron monitor rate provided by various observatories). The agreement looks good with , which is quite well compatible with our hypoth-esis of solar max conditions. Note that the aim of this compar-ison is just to check that the general shape of the altitude profile looks correct. Indeed, it would be necessary to take into account the actual composition of the ground (not 100% absorbing) and that of the atmosphere (including moisture) for a more accurate comparison with the Wilson and Nealy model, but this is out of the scope of the paper.
E. Available Resolution
The aim of this study is to compute the distribution of albedo neutrons encountered on a sphere concentric to the Earth at a chosen altitude in space as a function of two parameters: the energy of the neutron, and the angle of its velocity vector, as de-fined on Fig. 3, with respect to the plane tangent to the sphere. The angle is coded on 50 bins linearly spread up to sr, whereas the energy is coded on 360 bins logarithmically spread over the range from eV to 1 TeV. The double distribution (spectral and angular) is computed for 10 slices of latitude equally spread from north pole to south pole, each of which being divided into 12 bins of longitude. The calculation mesh is thus more or less rectangular ( ) near the equator, and more or less triangular near the poles.
Fig. 3. Definition of the incident angle used for the angular distribution. The vertical scale is not respected for clarity purpose.
Fig. 4. Differential (top panel) and inverse cumulative (bottom panel) spectra of albedo neutrons encountered at 400 km, averaged over all directions of ar-rival. Color code: red for the average over latitude (polar cap re-gion), blue for the average over latitude (equatorial region) and black for the average over the whole Earth. The green point is extracted from [13] for comparison.
III. RESULTS
As an example, the main characteristics of the neutron distri-bution are presented below for an altitude of 400 km, the IGRF 2010 magnetic field and solar min conditions ( ). Note that the altitude and solar conditions chosen for illustration tend to maximize the albedo flux.
A. Spectral Distribution
The spectral distribution of albedo neutrons integrated over all direction of arrival is illustrated on the top panel of Fig. 4., where one can easily recognize from the right to the left, the (quasi elastic) collision peak, the evaporation peak and the relatively small contribution from the epithermal plateau. In this type of representation ( also called lethargy spectrum), the epithermal plateau appears much weaker due to the ponderation by the energy of the particle. Concerning thermal neutrons, the distribution is near zero, partly due to the
4 IEEE TRANSACTIONS ON NUCLEAR SCIENCE
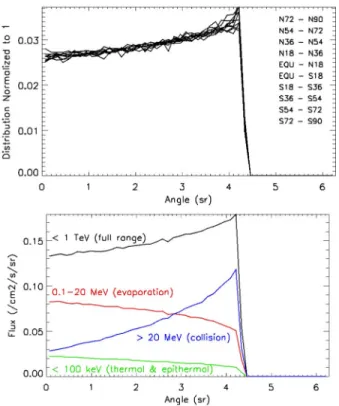
Fig. 5. Angular distributions of albedo neutrons encountered at 400 km inte-grated over the full energy range ( TeV) but for different slices of latitude (top panel), and averaged all around the Earth but for various energy ranges (bottom panel).
absence of moisture in our atmosphere, which is discussed in Section III-E. The inverse cumulative distribution (number of particles above the energy E) is displayed on the bottom panel of Fig. 4. On this panel, the value predicted by [13] for neutrons above 1 MeV has been reported for comparison purpose.
B. Angular Distribution
The angular distribution of albedo neutrons is displayed on Fig. 5, first integrated over the full energy range but as a func-tion of the latitude (top panel), and second averaged all over the Earth but for several energy ranges (bottom panel). The angle at which the distribution drops down to zero corresponds to the solid angle subtended by the atmosphere as seen at the altitude of the sphere.
From Fig. 5, we conclude that the angular distribution does not change significantly according to the latitude, but strongly depends on the considered energy range. Our results are consis-tent with the fact that the most energetic neutrons are produced by cosmic particles impacting the Earth’s atmosphere with a grazing incidence, as explained in [14].
C. Spatial Distribution
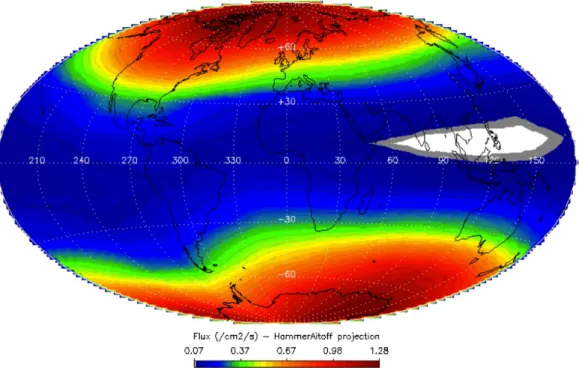
Fig. 6 shows the upward flux albedo neutrons around the Earth. The original map was calculated using a mesh of bins in latitude and longitude, but was interpolated to a smaller mesh of for illustration purposes. The color code rep-resents the flux of albedo neutrons located in a mesh, integrated in the full energy range ( TeV) and over all upward direc-tions ( sr). We clearly see higher fluxes for regions around the
poles and lower fluxes in the region with the highest rigidity, the general shape of the map being very similar to that of the ver-tical rigidity map, which is not surprising since it is related to the incident flux of GCR impacting the Earth atmosphere. We cal-culated the relative difference on the albedo neutron flux when using the tilted eccentric dipole approximation instead of IGRF below 10 000 km (see Section II-B): it is between
for intermediate latitudes ( ) and lower then for higher latitudes where the flux is the most important.
D. Influence of Solar Cycle
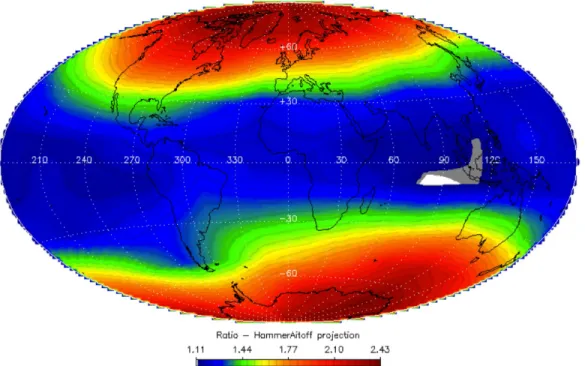
During solar max conditions, cosmic rays hitting the Earth atmosphere are less intense due to the solar modulation (see Fig. 1) and consequently the neutron albedo is less intense too. More generally, the neutron albedo is anti-correlated with the solar cycle but this is true at first order only (see Section IV-B about the contribution of solar events). We computed the same map as the one displayed in Fig. 6 using the same parameters except the value of the solar modulation ( , instead of 465). The result is displayed on Fig. 7 in the form of the ratio of the two maps (solar min over solar max). For solar min conditions, the flux of albedo neutrons is almost the same ( ) in the equatorial region, whereas it is enhanced by a factor in the polar cap regions.
E. Influence of Moisture and Ground Composition
As already mentioned in Section II-C, our atmosphere is only composed of nitrogen, oxygen and argon, without any moisture, which has an influence on the production of low energy neutrons present in the atmosphere and is measurable by a number of ex-periments (neutron monitoring provided by various observato-ries or balloon flights). By introducing some arbitrary quantities of water in some layers of our modeled atmosphere, we checked that we were able to produce an extra low energy peak corre-sponding to the expected higher contribution of thermal neu-trons with respect to a ideally dry atmosphere. Unfortunately, this low energy component is strongly dependent of the actual moisture of the atmosphere that is very difficult to model since it is very changing and altitude dependent (meteorological con-ditions) and also variable all around the Earth (climatic vari-ations). Moreover, since the effects of such low energy neu-trons (thermal and epithermal) are strongly dependent on the shielding materials offered by the spacecraft, we did not inves-tigate the accurate determination of their variable flux, and con-sidered it as out of the scope of this paper. Similarly, we checked that changing the ground composition (classical earth composi-tion instead of 100% absorbing material) does not affect our re-sults at space altitude of more than a few percent’s, well within the error bars.
IV. COMPARISONWITHMEASUREMENTS
This section aims at showing that our calculations are com-patible with other measurements and models.
A. Measurements in the Atmosphere
As already mentioned, our model is designed for determining the distribution of neutrons encountered in space rather than in
Fig. 6. Map of albedo neutrons (integrated over the full energy range TeV) encountered at 400 km for solar min conditions ( ). Please note that the continents and meridians are shown only to help in the identification around the globe, but the sphere shown is located at an altitude of 400 km above the Earth. The real size of the Earth is thus 0.9 the one shown here.
the atmosphere but it is still worth to mention that the shape of our calculated spectrum is in good agreement with the values published by the Joint Electronic Devices Engineering Council (JDEC) for altitudes close to the sea level. Indeed, this allows us to consider that our simplifying assumptions are not bad. However, the correction factor to apply for comparison at higher altitudes as provided by JDEC tends to overestimate the expected neutron flux and is more appropriate for worst case studies. Thus, we use instead the WN model already mentioned in Section II-D in order to estimate the expected neutrons as a function of the altitude in the atmosphere. However, the WN model only provides the integrated flux, not the spectrum, averaged over a number of measurements as a function of the local rigidity, the atmospheric depth and the coefficient Cr (relative neutron monitor rate provided by various observato-ries). Fluxes provided by this model are displayed on Fig. 8 for various values of Cr (87 is for average conditions, 65 and 102 are extreme values for the validity range). Superimposed are our values for the two periods of solar cycle, solar max (1991, ) and solar min (2010, ). Note that the comparison with our model cannot be really accurate since the WN model provides the expected flux integrated in a quite small energy range (1–10 MeV), corresponding only to the left edge of the collision peak (see Fig. 2), and moreover fluxes of WN spread over a very wide range of values, strongly depen-dent on Cr. Anyway, Fig. 8 shows that our calculations are in the good range for standard (not extreme) solar conditions. It is important also to note that our calculations do not take into account the moisture of the atmosphere whereas the WN model does, since it is based on the adjustment of a number of actual measurements.
Fig. 9 shows our calculated spectra of albedo neutrons at 400 km (same of Fig. 4 but shown in the differential form),
to-gether with some balloon measurements at high altitude [15], [16], as well as theoretical calculations at the upper of the at-mosphere (0 g/cm after [17], 0 and 12.9 GV after [18]). Since all these measurements or calculations are not made right at the same place or epoch, they are not directly comparable. But they contribute to illustrate the good agreement between our results and previous results.
B. Measurements in Space
Unfortunately, only a few measurements in space can be found in literature, which is even one of the reasons why the here presented work was undertaken. The Comptel telescope on-board the Compton Gamma Ray Observatory (CGRO) oper-ated by NASA in the early 1990s provided two measurements. They are delivered in the form of two different spectral adjust-ments, each corresponding to one value of rigidity cutoff [19]. By integrating these spectral adjustments, we derived the fluxes in the largest available band (20–100 MeV) for the two values of rigidity cutoff (4.5 and 8.5 GV). The results are displayed on Fig. 10 plotted as a function of the rigidity, superimposed to our calculations made all around the Earth giving access to a wider range of rigidity values. On the basis of the discussion provided in [19], the error bar of Comptel measurements was estimated more or less arbitrarily as 10%, but it could be larger. As we note on Fig. 10, Comptel measurements are a factor above our calculations made at the same altitude (450 km) and with the contemporary magnetic field IGRF 1991. First, note that in this energy range (20–100 MeV), the discrepancy cannot be interpreted as due to the presence of moisture in the actual atmosphere, not taken into account in our model. Second, since Comptel measurements look more compatible with our prediction corresponding to solar minimum conditions ( ) instead of solar min conditions ( ), one
6 IEEE TRANSACTIONS ON NUCLEAR SCIENCE
Fig. 7. Map of enhancement factor from solar max ( ) to solar min conditions ( ).
Fig. 8. FLUKA results in the 1–10 MeV energy range computed using the ge-omagnetic field IGRF and input GCR spectra corresponding to the solar mod-ulation (red) and (green), compared with values deduced from the model of Wilson-Nealy above New York (rigidity 2.08 GV) for various coefficients Cr (black).
may wonder if our input GCR fluxes are not too low, possibly due to our approximation using the Störmer formula down to 3500 km of altitude (see Section II-B). But again the possible error using the Störmer formula seems difficult to reconcile with a factor 2 of discrepancy.
A possible explanation could be that Comptel also measured an extra contribution of the Sun itself, which also injects ener-getic protons and heavier ions in the vicinity of the Earth, not only during strong solar event. As mentioned in [19], it is indeed difficult to disentangle the contributions of neutrons induced by solar particles from that induced by cosmic particles in the mea-surements. On the contrary, particles injected in our simulation are much easier to control. That’s the reason why we decided to investigate a possible extra contribution of the Sun induced by solar energetic particles (SEP). As already visible on Fig. 8 re-garding the atmospheric neutron flux, which can vary by a factor 2 depending on the solar cycle, or even more for high values of
Fig. 9. FLUKA results in the 1–1000 MeV range plotted as the differential spectra of albedo neutrons encountered at 400 km computed for solar min con-ditions and displayed with the same color code used in Fig. 4. Balloon measure-ments at high altitude and theoretical calculations at the upper atmosphere are over plotted for comparison purpose (see text).
Cr, it is reasonable to ask whether it would not be the same in
space. In order to optimize the statistical significance and repre-sentativeness, we have evaluated the flux enhancement induced by two events, different but representative of strong SEP: the so-called Halloween intense and long event of October 2003, and the shorter but harder event of January 2005. Not all species of nuclei are represented but only proton, helium, and oxygen, all of them built from ACE, SAMPEX and GOES-11 data [20]. Since both spectra and intensities are known to change during
Fig. 10. Flux of albedo neutrons in the 20–100 MeV energy range plotted as a function of the rigidity for two values of the solar modulation (red dots for and green dots for ). Superimposed are the measurements made in 1991 by Comptel at rigidities of 4.5 and 8.5 GV (black squares).
Fig. 11. Integrated solar fluence of the two events used in our simulations: gray color for the 2005 short and unusually hard event, and black color for the longer and softer Halloween event. Solid, long dashed and small dashed curves correspond respectively to fluence of proton, helium and oxygen nuclei.
a solar event, all our results concerning SEP are expressed as fluences integrated over the whole duration of the event. The input spectra of injected particles are visible on Fig. 11. Con-cerning the injection itself, several approximations were done. The most important one concerns the isotropic injection, which is probably not valid for solar particles. The second approxima-tion concerns the magnetic field, which was taken respectively as IGRF 2003 and 2005 for the two events, in spite of knowing that SEPs can modify the local magnetic field. Nevertheless, these two approximations can be considered as acceptable since we are interested only in assessing the global extra contribution from the Sun.
The global (integrated all around the Earth) contributions of cosmic rays for solar min and max conditions, as well those of the two SEP, are summarized in Table I for comparison pur-poses. Considering the approximate duration of the two SEPs ( h for January 2005 and d for October 2003) to convert our calculated fluences into fluxes, we conclude that during strong solar events, the Sun contribution to the flux of neutron albedo can be several orders of magnitude higher than that induced by cosmic rays. Of course, this is not a surprise, but reciprocally, we can imagine that during periods of active sun, some weaker events (e.g., 1000 times weaker than strong SEPs)
TABLE I
FLUKA RESULTS( TeV)FORIGRF 1991AND450KM
Fig. 12. Temporal evolution of albedo neutron flux ( TeV) encountered along a circular LEO at 400 km displayed for various orbits (polar, medium and near equatorial inclinations).
could increase the neutron albedo by a significant factor. More-over, considering that Comptel measurements were performed while the Sun was active (July and December 1991), we think that this could account for the discrepancy of only a factor 2 be-tween our calculations and Comptel measurements. A nonper-fect removal of the (very important) instrumental background generated in the CGRO instruments could also be invoked to account for this discrepancy, but such an investigation is out of the scope of this paper.
V. APPLICATIONS
A straightforward application of our model is the modeling of the temporal evolution of the instrumental background in-duced by space neutrons. As an illustration, Fig. 12 displays the expected neutron flux encountered along a circular LEO orbit at 400 km for various inclinations. For this example, the orbital positions were computed by the Omere software [21] and put in relation with the map of albedo neutrons displayed on Fig. 6. Of course, in order to predict the actual instrumental back-ground, the ambient neutron flux shall be transported through the spacecraft materials, which demonstrate the importance for computing the double distribution (energy and angle) as our model does it.
VI. CONCLUSION
The distribution of albedo neutrons has been computed using the FLUKA code associated to a simple atmospheric model and the GCR spectra modulated by the solar cycle. The user-parameters are the solar modulation and the epoch of the
8 IEEE TRANSACTIONS ON NUCLEAR SCIENCE
IGRF magnetic field, as well as the altitude at which the double distribution (energy and angle) of albedo neutrons is desired. Despite some simplifications such as not taking into account the moisture in the atmosphere, the detailed composition of the Earth’s surface, the Forbush effect, the spectral distribution of albedo neutrons is very well reproduced, with the presence of the two expected peak (collision and evaporation) and plateau (thermal and epithermal). Concerning the angular distribution, we showed that the less energetic neutrons peak at the nadir, whereas the most energetic ones are near the atmospheric horizon, which is similar to the theoretical expectations. Our model allows computing the spatial distribution of albedo neutrons at a chosen altitude (LEO level) all around the Earth at any available epoch of IGRF magnetic field. Even if the val-idation of the code has already been successfully demonstrated through various previous studies cited therein, our results have been compared to measurements performed in space by Comptel two decades ago. One application of this model, such as the modeling of the temporal evolution of the instrumental background induced by space neutrons, has been illustrated.
ACKNOWLEDGMENT
The authors would like to thank P. Zuccon (CERN) for fruitful discussions about the implementation of the magnetic field IGRF in our code, and S. Macmillan (British Geological Survey) who kindly provided them with the positions of North Pole as well as the locations of the tilted eccentric dipole fitting the IGRF. They are also grateful to the local team at CERN for its help in using Flair, and P.-F. Honoré (CEA) for the maintenance of FLUKA on the cluster PLANER at CEA.
REFERENCES
[1] P. Zuccon, “A Monte Carlo simulation of the cosmic rays interactions with the near Earth environment,” Ph.D. dissertation, Dipartimento di Fisica, Università Degli Studi di Perugia, Perugia, Italy, Oct. 2002 [On-line]. Available: http://ams.pg.infn.it/Tesi/tesi_zuccon.pdf
[2] S. Muraro, “The calculation of atmospheric muon flux using the FLUKA Monte-Carlo code,” Ph.D. dissertation, Diparti-mento de Fisica Nucleare e Subnucleare, Università Degli Studi di Milano, Milano, Italy, 2006 [Online]. Available: http://in-spirehep.net/record/775055/files/775055.pdf
[3] P. M. O’Neill, “Badhwar–O’Neill 2010 galactic cosmic ray flux model—revised,” IEEE Trans. Nucl. Sci., vol. 57, no. 6, pp. 3148–3153, Dec. 2010.
[4] T. K. Gaisser, M. Honda, P. Lipari, and T. Stanev, “Primary spectrum to 1 TeV and beyond,” in Proc. 27th Int. Cosmic Ray Conf. (ICRC), Hamburg, Germany, Aug. 2001, vol. 7–15, pp. 1643–1646.
[5] C. Störmer, “Periodische elektronenbahnen im felde eines elementar-magneten und ihre Anwendung auf Brüches modellversuche und auf eschenhagens elementarwellen des erdmagnetismus,” Z. Astrophys., vol. 1, pp. 237–274, 1930.
[6] G. Battistoni, S. Muraro, P. R. Sala, F. Cerutti, A. Ferrari, S. Roesler, A. Fassò, and J. Ranft, “The FLUKA code: Description and bench-marking,” Proc. Hadronic Shower Simul. Workshop Fermilab, Sep. 6–8, 2006, M. Albrow and R. Raja, Eds., Proc. AIP Conf. vol. 896, pp. 31–49, 2007.
[7] A. Ferrari, P. R. Sala, A. Fassò, and J. Ranft, “FLUKA: A multiparticle transport code,” CERN, Geneva, Switzerland, CERN-2005-10, INFN/ TC_05/11, SLAC-R-773, 2005.
[8] IGRF website. [Online]. Available: http://www.ngdc.noaa.gov/IAGA/ vmod/igrf.html
[9] G. Battistoni, A. Ferrari, T. Montaruli, and P. R. Sala, “The FLUKA atmospheric neutrino flux calculation,” Astroparticle Phys., vol. 19, no. 2, pp. 269–290, 2003.
[10] P. Zuccon, B. Bertucci, B. Alpat, G. Ambrosi, R. Battiston, G. Battis-toni, W. J. Burger, D. Caraffini, C. Cecchi, L. Di Masso, N. Dinu, G. Esposito, A. Ferrari, E. Fiandrini, M. Ionica, R. Ionica, G. Lamanna, M. Menichelli, M. Pauluzzi, and P. R. Sala, “Atmospheric production of energetic protons, electrons and positrons observed in near earth orbit,”
Astroparticle Phys., vol. 20, no. 2, pp. 221–234, 2003.
[11] R. Rœsler, W. Heinrich, and H. Schraube, “Monte carlo calculations of the radiations field at aircraft altitudes,” Radiation Protection
Dosimetry, vol. 98, no. 4, pp. 367–388, 2002.
[12] E. Normand and T. J. Backer, “Altitude and latitude variations in avionics SEU and atmospheric neutron flux,” IEEE Trans. Nucl. Sci., vol. 40, no. 6, pp. 1484–1490, Dec. 1993.
[13] L. Desorgher, E. O. Flückiger, M. Gurtner, M. R. Moder, and R. Bütikofer, “ATMOCOSMICS: A Geant4 code for computing the interaction of cosmic rays with the earth’s atmosphere,” Int. J. Mod.
Phys., vol. 20, no. 29, pp. 6802–6804, 2005.
[14] W. N. Hess, E. H. Canfield, and R. E. Lingenfelter, “Cosmic-ray neu-tron demography,” J. Geophys. Res., vol. 66, no. 3, pp. 665–677, 1961. [15] G. Kanbach, C. Reppin, and V. Schönfelder, “Support for crand theory from measurements of earth albedo neutrons between 70 and 250 MeV,” J. Geophys. Res., vol. 79, no. 34, pp. 5159–5165, 1974. [16] A. M. Preszler, S. Moon, and R. S. White, “Atmospheric neutrons,” J.
Geophys. Res., vol. 81, no. 25, pp. 4715–4722, 1976.
[17] T. W. Armstrong, K. C. Chandler, and J. Barish, “Calculation of neu-tron flux spectra induced in the Earth’s atmosphere by galactic cosmic rays,” J. Geophys. Res., vol. 78, no. 16, pp. 2715–2726, 1973. [18] R. S. Selesnick, M. D. Looper, and R. A. Metwaldt, “A theoretical
model of the inner proton radiation belt,” Space Weather, vol. 5, no. 4, p. S04003, 2007.
[19] D. J. Morris, H. Aarts, K. Bennett, J. A. Lockwood, M. L. McConnell, J. M. Ryan, V. Schönfelder, H. Steinle, and X. Peng, “Neutron mea-surement in near-Earth orbit with COMPTEL,” J. Geophys. Res., vol. 100, no. A7, pp. 12243–12249, 1995.
[20] R. A. Mewaldt, M. D. Looper, C. M. S. Cohen, G. M. Mason, D. K. Haggerty, M. I. Desai, A. W. Labrador, R. A. Leske, and J. E. Mazur, “Solar-particle energy spectra during the large events of Oc-tober–November 2003 and January 2005,” in Proc. 29th Int. Cosmic
Ray Conf. Pune, 2005, pp. 101–104.
[21] TRAD website. [Online]. Available: http://www.trad.fr/OMERE-14. html