HAL Id: hal-01875757
https://hal.umontpellier.fr/hal-01875757
Submitted on 17 Sep 2018
HAL is a multi-disciplinary open access
archive for the deposit and dissemination of
sci-entific research documents, whether they are
pub-lished or not. The documents may come from
teaching and research institutions in France or
abroad, or from public or private research centers.
L’archive ouverte pluridisciplinaire HAL, est
destinée au dépôt et à la diffusion de documents
scientifiques de niveau recherche, publiés ou non,
émanant des établissements d’enseignement et de
recherche français ou étrangers, des laboratoires
publics ou privés.
dynamic heteroplasmy and challenges the Free Radical
Theory of Ageing
David Jebb, Nicole Foley, Conor Whelan, Frédéric Touzalin, Sébastien
Puechmaille, Emma Teeling
To cite this version:
David Jebb, Nicole Foley, Conor Whelan, Frédéric Touzalin, Sébastien Puechmaille, et al..
Popu-lation level mitogenomics of long-lived bats reveals dynamic heteroplasmy and challenges the Free
Radical Theory of Ageing. Scientific Reports, Nature Publishing Group, 2018, 8 (1), pp.13634.
�10.1038/s41598-018-31093-2�. �hal-01875757�
Population level mitogenomics of
long-lived bats reveals dynamic
heteroplasmy and challenges the
Free Radical Theory of Ageing
David Jebb
1, Nicole M. Foley
1, Conor V. Whelan
1, Frédéric Touzalin
3,
Sebastien J. Puechmaille
1,2& Emma C. Teeling
1Bats are the only mammals capable of true, powered flight, which drives an extremely high metabolic rate. The “Free Radical Theory of Ageing” (FTRA) posits that a high metabolic rate causes mitochondrial heteroplasmy and the progressive ageing phenotype. Contrary to this, bats are the longest-lived order of mammals given their small size and high metabolic rate. To investigate if bats exhibit increased mitochondrial heteroplasmy with age, we performed targeted, deep sequencing of mitogenomes and measured point heteroplasmy in wild, long lived Myotis myotis. Blood was sampled from 195 individuals, aged between <1 and at 6+ years old, and whole mitochondria deep-sequenced, with a subset sampled over multiple years. The majority of heteroplasmies were at a low frequency and were transitions. Oxidative mutations were present in only a small number of individuals, suggesting local oxidative stress events. Cohort data showed no significant increase in heteroplasmy with age, while longitudinal data from recaptured individuals showed heteroplasmy is dynamic, and does not increase uniformly over time. We show that bats do not suffer from the predicted, inevitable increase in heteroplasmy as posited by the FRTA, instead heteroplasmy was found to be dynamic, questioning its presumed role as a primary driver of ageing.
The mitochondrion in mammals harbours a ~16.5 kb, circular chromosome, or mitogenome. Across vertebrates the mitogenome shows a largely conserved gene content and synteny, containing 13 protein coding genes, 2 ribo-somal RNA genes, 22 transfer RNA genes and a control region. Protein coding genes encode essential subunits of the electron transport chain (ETC) complexes, while the tRNA and rRNA genes encode components of the mitochondrial translation machinery. The mitogenome is maternally inherited, is non-recombining and has a higher mutation rate than the nuclear genome1,2. These properties have made it an attractive study locus for
phy-logenetics, population genetics and forensics. The mitochondria have also been the focus of ageing research since the 1950s due to their central role in the “Free Radical Theory of Ageing”3.
The Free Radical Theory of Ageing (FRTA) states, through normal mitochondrial function, reactive oxygen species (ROS) are generated which damage biomolecules leading to mitochondrial dysfunction3. ROS are
gener-ated when electrons leak from the ETC and reduce oxygen in the absence of hydrogen cations. The mitogenome was once thought to be particularly susceptible to oxidative damage due to its lack of protective histones and close proximity to the ETC, though it is now known that the mtDNA is not naked. Rather, the mtDNA and the TFAM protein compact to form DNA-protein aggregates, called nucleoids, which in mammals typically contain a single mitogenome2,4,5. These oxidative mutations become hardcoded in the mitogenome, leading to production
of mutated ETC components, and mitochondrial dysfunction. Increased mitochondrial dysfunction gives rise to greater ROS production, which cause greater dysfunction in a “vicious cycle”. This gradual accumulation of heter-oplasmy and dysfunctional mitochondria is thought to give rise to the familiar progressive, ageing phenotype5–7.
Mitochondrial heteroplasmy is the presence of multiple non-identical mitogenomes in a single individ-ual8. Mitogenomes may vary in length or at single nucleotides, referred to as length and point heteroplasmy
1School of Biology and Environmental Science, University College Dublin, Belfield, Dublin 4, Ireland. 2Applied Zoology and Conservation, Zoological Institute, Greifswald University, Greifswald, Germany. 3Laboratoire Evolution et Diversité Biologique, Université Toulouse 3, Paul Sabatier, 31062, Toulouse Cedex 09, France. Correspondence and requests for materials should be addressed to E.C.T. (email: emma.teeling@ucd.ie)
Received: 25 January 2018 Accepted: 26 July 2018 Published: xx xx xxxx
respectively, where a locus is defined as heteroplasmic if it is heterozygous within an individual and the minor allele frequency (MAF) exceeding some defined threshold. Heteroplasmy plays an important role in mitochon-drial disease, cancer and ageing7,9–11. Once thought to be extremely rare in human populations, recent next
gen-eration sequencing efforts have found extensive heteroplasmy in healthy individuals12. These heteroplasmies
are predominantly at low frequency, enriched for pathogenic mutations, and show tissue and allele specific pat-terns13–15. As the mitochondrial genome is maternally inherited, studies of mother-child pairs have shown that
maternal age at conception is positively correlated with levels of heteroplasmy16. More generally, levels of
heter-oplasmy have been shown to increase with age in humans, and contribute to debilitating age related diseases, as well as developmental disorders such as autism10,13,15,17.
The correlated increase in low level heteroplasmies with age in humans seems to support the FRTA. However, human studies have shown a lack of oxidative transversions but instead show transitions are the primary source of mtDNA mutations13,15,18. Further, numerous studies have challenged the FRTA. Knock down of key
antiox-idant defences has been shown to have often contradictory effects on lifespan19. The long lived naked mole rat
has been found to have higher levels of oxidative damage than other rodents, and has lost important antioxidant enzymes20,21. However, these studies have not directly measured mitochondrial DNA damage, and apart from
humans, little is known about low level heteroplasmy in mammals. Studies involving mutant mouse models have been used to test the relationship between mitochondrial mutations and ageing. POLG−/− mice express a
mito-chondrial polymerase with no proof reading activity22,23 and so accumulate mitochondrial mutations faster than
wild type mice. These mice show a strong progeroid phenotype, supporting a role for mitochondrial mutations in ageing23,24. Mammalian studies have been restricted to the control region, often in repeat containing loci,
and have not investigated any potential relationship with age25–32. Moreover, few comparative studies have taken
advantage of recent advances in next generation sequencing technologies. Recently, Rensch et al.1 used publicly
available ChIP-Seq data from 16 species to evaluate patterns of heteroplasmy across the vertebrate phylogeny and concluded that divergent species show similar patterns in frequency and location of heteroplasmy. This study discovered relatively few heteroplasmies, likely due to the high frequency cut off used, and few individuals avail-able for some species. They did not investigate change in heteroplasmy levels with age. To date, next generation sequencing methods have not been used to investigate the relationship between heteroplasmy and age outside of humans.
Chiroptera, the bats, display exceptional longevity for their body size and metabolic rate. Bats are the longest lived order of mammals given their body size, living almost ten times longer than expected33,34. The longest lived
bat is Myotis brandtii (weight ~7 g), which was first captured as an adult and recaptured 41 years later showing negligible signs of senescence35,36. Interestingly, bats are the only mammals capable of true powered flight37,38.
This energy intensive form of locomotion requires an extremely high metabolic rate. During flight the metabolic rate in bats is up to 3 times higher than that of a terrestrial mammal of the same size during exercise39. Bats can
increase oxygen consumption 20–30 fold during flight, and M. velifer has been shown to increase oxygen con-sumption rate 130 fold39,40. According to the FRTA, increased oxygen consumption as a result of flight should lead
to increased ROS production, thereby accelerating the ageing process. However, bats seem to defy the FRTA33,41.
M. lucifugus has been shown to produce less ROS per unit of oxygen consumed compared to mammals of a
similar size, suggesting Myotis bats have increased “mitochondrial efficiency” and have potentially evolved some mechanism to avoid or manage flight-induced oxidative stress42.
Heteroplasmy has previously been studied in the long lived Myotis genus. Petri et al.26 studied length and point
heteroplasmy in the control region of the M. myotis mitogenome. They found high levels of diversity within indi-viduals at a tandem repeat between the tRNA Proline and the conserved sequence blocks of the control region. Sequence diversity at this locus within individuals was similar to diversity between colonies from Germany and Portugal. The length of the repeated array also varied at this locus between and within individuals, with approxi-mately 40% of individuals showing at least two different size arrays. Kerth et al.43 studied the homologous repeat
array in M. bechsteinii from Germany and exploited the high levels of sequence and length diversity in this array to study “microgeographic” population structuring in these bats. This locus has been suggested to possibly reg-ulate mitochondrial transcription due to homology with termination-associated sequences leading to a complex secondary structure32,44. However, this repeat locus is found only in the Vespertilioninae and Myotinae
subfam-ilies44,45, and so cannot apply generally to exceptional longevity across the chiropteran phylogeny. Heteroplasmy
has also been studied outside the Vespertilionidae. The distantly related Rhinolophus sinicus has was found to exhibit point and length heteroplasmy. As in the studies in vespertilionid bats, heteroplasmy was observed at a tandem repeat in the control region using PCR and cloning based techniques25. So far, no study has used next
generation sequencing to investigate low frequency heteroplasmy across the whole mitogenome in a long-lived bat species, or tested if heteroplasmy shows any association with age in bats.
To elucidate if bats exhibit increased mitochondrial heteroplasmy with age as predicted by the FRTA, we performed targeted, deep sequencing of mitogenomes and measured point heteroplasmy in wild, long lived M.
myotis as they age. We report, for the first time, population level characterization of heteroplasmy based on whole
mitogenomes from 195 tagged individuals of the long-lived bat, M. myotis. Polymerase error likely explains the majority of mutations, with oxidative transversions at a lower rate and concentrated in only a few individuals. Most heteroplasmies are at low frequency, less than 5%. We also sampled and sequenced individuals over multi-ple years, to assess changes in levels of heteroplasmy at the individual level through time. These unique sammulti-ples revealed the dynamic nature of heteroplasmy, possibly as a consequence of transient oxidative stress. Contrary to the FRTA, we found that M. myotis do not suffer widespread oxidative damage due to flight, instead exhibit acute and transient oxidative stress. We suggest enhanced mitochondrial quality control mechanisms, which may repair or remove damaged mitochondria possibly contributes to the exceptional longevity in M. myotis.
Results
Sequencing and Quality Control.
252 samples were sequenced obtaining a total of 72,111,278 read pairs prior to quality control. After adapter trimming and stringent quality filtering of reads, 56,608,559 (78.5%) of read pairs were retained. Stringent quality control (QC) resulted in loss of more than 20% of raw data. 20 samples were deemed unreliable after testing the effect of PCR duplicate removal. Average coverage of samples ranged from 142 to 7800X. 4 samples with average coverage below 1000X were removed. 12 which failed initial QC tests were re-sequenced, and the same quality control steps as before were performed. 4 re-sequenced samples were retained after quality control. A total of 232 samples were retained for further downstream analysis. The average coverage of the 232 QC passed samples was 3837X, ranging from 1355 to 7800X.Sample Demography.
As the individuals have been tagged with passive integrated transponder (PIT) tags since 2010, it was possible to identify which samples belonged to a unique individual, and know the age for each individual. For individuals caught first as an adult only a minimum bound for the age was known. The 232 QC passed samples included 88 juveniles (<1 years old), and 143 adults (>1 years old) and one individual for which age could not be reliably assigned (Table 1). The 232 samples represent 195 unique individuals (Table 2), with 21 individuals sampled two, three or four times over consecutive years. All juveniles are 0 years old, with adult sam-ples ranging from 1 years old to at least 7 (hence denoted as 7+). 167 unique individuals aged between 0–5 and a “6+” cohort were used to investigate the relationship between heteroplasmy and age (Table 2).Simulation Results.
9 read sets were generated using GemSIM46, ranging from 50 to 25,000X coverage. Eachread set was analysed using one of three callers, LoFreq, VarScan or FreeBayes, producing 27 variant call sets, which were given a score between 0 and 1 defined as (Power*Accuracy)*(1-False Positive Rate) (described in full in Material and Methods, Variant Simulation). LoFreq was the best scoring caller (Supp. Fig. 1), and used to call heteroplasmies in all empirical datasets. FreeBayes consistently had the highest power, detecting more than 85% of true variants even at coverages as low 100×, however, FreeBayes also exhibited a false positive rate >5% at all coverages. LoFreq and VarScan had extremely low error rates, with each detecting only one false positive in the 27 variant call sets. LoFreq had a higher score than VarScan at all coverage levels (see Additional File 1).
Frequency and distribution of heteroplasmies in M. myotis.
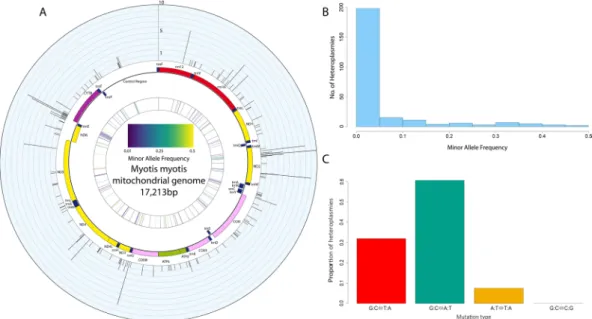
From 232 samples, 254 pointheter-oplasmies, across 143 sites in the mitogenome were discovered. Sites were called as heteroplasmic if they were heterozygous with an intra-individual minor allele frequency (MAF) greater than 1%, Fig. 1A. The frequency of minor alleles was strongly skewed toward low frequency variants. Figure 1B shows a histogram of number of heteroplasmies by MAF for all 254 heteroplasmies. The vast majority, 77.6%, of heteroplasmies were below 5% MAF. The low MAF found for the majority of heteroplasmies suggests these are likely somatic. However, it is not possible to distinguish between somatic and inherited heteroplasmies given the samples are from only one tissue and maternal relationships between individuals are unknown.
210 heteroplasmies were collected from 195 unique individuals, using the most recent sample from recaptured individuals. The difference between the frequency distribution of coding and non-coding heteroplasmies was approaching significance (Kolmogorov-Smirnov (KS) Test, p = 0.054) with non-coding heteroplasmies tending
Age Number of samples, N
Juvenile Samples (0 years old) 88 Adult Samples (>1 year old) 143
1 26 2 22 3 25 4 24 5 3 6+ 13 1+, 2+, 3+, 4+, 5+, 7+ 30 No age assigned 1
Table 1. Sample demography. Number of samples assigned to each age cohort.
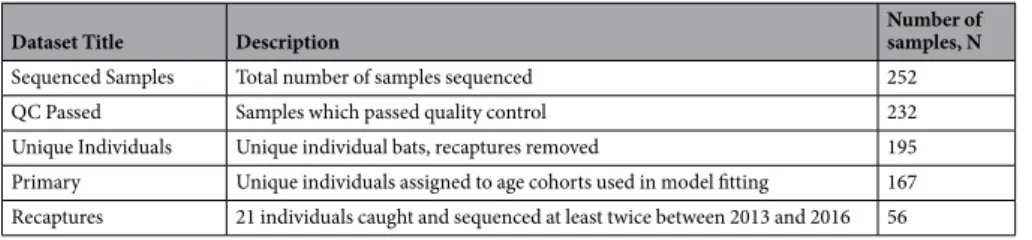
Dataset Title Description Number of samples, N
Sequenced Samples Total number of samples sequenced 252 QC Passed Samples which passed quality control 232 Unique Individuals Unique individual bats, recaptures removed 195 Primary Unique individuals assigned to age cohorts used in model fitting 167 Recaptures 21 individuals caught and sequenced at least twice between 2013 and 2016 56
Table 2. Analysed Datasets. Description of and number of samples in each datasets used for downstream
to be at lower frequencies. Closer investigation of coding heteroplasmies found nonsynonymous heteroplasmies were at a lower frequency on average than synonymous (Mann-Whitney U-test, p = 0.021 Supp. Fig. 2A).
This also drove the difference observed between coding and non-coding heteroplasmies, as a significant dif-ference was found between the frequency distributions of synonymous and non-coding heteroplasmies, but not between nonsynonymous and non-coding heteroplasmies (KS Test, p = 0.006 and p = 0.374 respectively) (Supp. Fig. 2A). There was also a difference in the frequency of heteroplasmies depending on the codon position with heteroplasmies at the second codon position at a lower frequency than position 1 or 3, which showed no dif-ference to each other (KS Test, p = 0.004, p = 0.005, p = 0.411 respectively) (Supp. Fig. 2B). To further explore the effect of heteroplasmies, all nonsynonymous heteroplasmies, excluding nonsense mutations, were scored as “Deleterious” or “Neutral”. Of the 62 nonsynonymous sites scored, 42 were found to be deleterious and 20 neutral. Deleterious heteroplasmies were at significantly lower frequency than neutral heteroplasmies (KS Test, p = 0.012).
Heteroplasmic sites were spread relatively evenly across the mitogenome. The numbers of heteroplasmic
ver-sus homoplasmic sites were used to construct a contingency table for each mitochondrial partition. Dividing
the mitogenome into tRNA, rRNA, protein coding and non-coding regions, showed enrichment for heteroplas-mic sites in tRNA genes (Χ2 (1, N = 143) > 10.828, p < 0.001). Analysis of individual genes revealed ND2, trnaE
and trnaN genes were enriched for heteroplasmic sites (Χ2 (1, N = 143) > 3.841, p < 0.05). The majority of sites,
72.7%, were only observed as heteroplasmic in one individual (Fig. 1A), hereafter called “private” heteroplasmies as opposed to “shared”. While shared heteroplasmies are more likely to be inherited, and shared between mater-nally related individuals, particular sites within the mitogenome show higher rates of heteroplasmy in unrelated humans13, we thus make no assumption as to whether shared and private mutations are somatic or inherited.
Private and shared heteroplasmies showed significantly different frequency spectra (KS Test, p = 0.005) with pri-vate heteroplasmies at lower average frequency. Pripri-vate and shared heteroplasmic sites showed similar propor-tions of synonymous and nonsynonymous mutapropor-tions and no bias toward coding versus non-coding sites (Χ2 (1,
N = 143) < 2.706, p > 0.1 in all comparisons).
Transitions are the primary source of heteroplasmies.
210 heteroplasmies from 195 unique individu-als were classified into 4 classes, 1 transition class (G:C ↔ A:T) and 3 transversion classes (G:C ↔ T:A, A:T ↔ T:A and G:C ↔ C:G), as shown in Fig. 1C. Transitions were the primary class of heteroplasmy at 60.6%. This was followed by G:C ↔ T:A transversions at 31.9%, which are characteristic of oxidative stress events. The remaining 7.5% of mutations were A:T ↔ T:A transversions. M. myotis showed a small transition to transversion (Ts/Tv) ratio, with a Ts/Tv of 1.8. Only 38 samples (16.4%) showed evidence of oxidative transversions, of which 33 were unique individuals. The 5 samples containing the highest number of oxidative transversions accounted for 37% of these transversions (30 of 81).Figure 1. Characteristics of heteroplasmy in M. myotis. (A) A circos plot of the mitogenome of M. myotis. In
the outer ring histogram, each bar is one of the 143 unique sites which were heteroplasmic in the population, with the height representing the number of individuals sharing the site. The middle ring is a schematic of the mitogenome generated with OGDRAW87. The inner most ring is a heat plot showing the average minor
allele frequency at each heteroplasmic site, with low frequencies in purple and high frequencies in yellow. (B) Histogram of minor allele frequencies of 254 heteroplasmies discovered. The vast majority of heteroplasmies were at a frequency below 5%. (C) Bar chart showing the proportion of mutations attributable to one of four transition or transversion classes. The transition transversion ratio (Ts/Tv) for M. myotis was 1.8. Oxidative mutations, G:C⇔T:A transversions, were at a higher level than reported previously in humans.
Association between heteroplasmy and age.
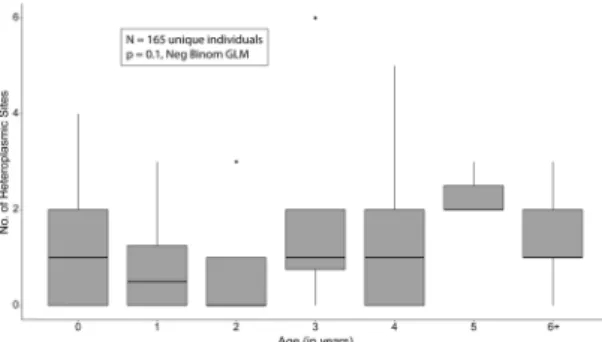
To test if the number of heteroplasmic sites within an individual showed an association with age we fitted a generalised linear mixed model. The model incorporated age as the sole fixed effect and included sequencing batch as a random effect, with the count of heteroplasmic sites as the negative binomial distributed response variable. Sequencing batch was included as samples from different batches exhibited significantly different numbers of heteroplasmies (Kruskal-Wallis test, p = 0.007). However, the magnitude of the difference in means was small, with a maximum difference of 1.7 heteroplasmies between two batches. Furthermore, batch as a random effect had an estimated variance of 0, indicating the model was degenerate. As such, the simpler generalized linear model with age as the sole fixed effect was retained for further analysis (Table 3). Two samples within the 6+ cohort were found to be unduly influential points using Cook’s Statistic (Supp. Fig. 3A,B). As such they were removed and the model fit again. With these two samples removed no significant association with age was found (ANOVA, p = 0.1), as shown in Fig. 2 and Table 3. Bootstrapping of the three fitted models also showed a decrease in the standard error and bias for the model estimates with the outliers removed, Table 3. Further, the two outlier samples contained primarily oxidative mutations, one of which contains the highest number of oxidative mutations in our data. To investigate any bias that may be introduced by choosing the most recent sample from recaptured individuals, we produced 1000 permutations in which the sam-ple from recaptured individuals of usable age was chosen at random, to produce a similar dataset of 165 unique individuals. 19.8% of samplings found a significant association between age and number of heteroplasmies (Supp. Fig. 4A), with an average slope 0.0969 and ranging from 0.0815 to 0.1237 (Supp. Fig. 4B).Longitudinal analysis of heteroplasmy.
From the 27 individuals sampled more than once, we were able to obtain samples from 21 individuals from at least two time-points, which passed quality control. 3 individuals were sampled at 4 time-points, 8 individuals sampled at 3 time-points and 10 individuals at 2 time-points, indi-viduals sampled at 3 or 4 time-points are shown in Fig. 3. The mean change in number of heteroplasmies between two consecutive years across individuals was 0.303 (standard deviation ± 2.52). Of the 33 consecutive intervals (e.g. 2013 to 2014 or 2014 to 2015 etc.) 15 showed no change, 10 showed a decrease and 8 showed an increase (Supp. Fig. 5). Not all heteroplasmies were shared between time-points. 14.7% of heteroplasmies were observed in at least two time-points, with 13% shared between all time-points for an individual. Shared sites ranged in frequency from 43.36% to as low as 1.02%. Some individuals were extremely consistent over all time points. For example, individual 000715B9C8, shown in Fig. 3, initially showed 2 heteroplasmies, but subsequently lost one. The remaining heteroplasmy was at a low frequency but was found at all 4 time-points and had an extremely consistent frequency, rangemaf 1.02–1.83%. However, some individuals were more dynamic. These “spikes” in thenumber of heteroplasmy was normally followed by a marked decrease the following year. Two bats, 000702E6B0 and 000702FF51 (also shown in Fig. 3), showed spikes and subsequent loss, though they retained a subset of the mutations acquired during the spike. Four individuals showing spikes in the number of heteroplasmy, with an increase of 4 or more sites between two subsequent years, were previously found to have some of the highest levels
Dataset Model N Fixed Effect Random Effect AICc Estimate Bootstrap Std. Error Bootstrap Bias p-value
Primary GLMM 167 InterceptAge Batch 482.09 −0.12880.1289 0.13830.0575 0.02210.0152 0.28090.0017 Primary GLM 167 InterceptAge NA 479.99 −0.12880.1289 0.11210.0465 −0.0094−0.0028 0.28360.0021 Influential points removed GLM 165 InterceptAge NA 456.80 −0.08430.0699 0.10940.0384 −0.00590.0002 0.45500.1000
Table 3. Modelling the relationship between age and heteroplasmy. Regression analyses revealed a significant
association with age, but this was due to the presence of two unduly influential points. Bias and standard error were estimated from 1000 parametric bootstrap replicates.
Figure 2. Heteroplasmy is not significantly associated with age in Myotis myotis. Boxplots of the distribution of
heteroplasmy counts in each age cohort used for age analysis. No significant association was found between age and heteroplasmy using a negative binomial generalized linear model, after the removal of unduly influential points.
of oxidative mutations. Interestingly, bat 000702EA84 showed a spike in heteroplasmy with little recovery the fol-lowing year. Instead, this bat may have experienced oxidative stress events during two consecutive field seasons.
Discussion
Comparative genomics has emerged as a powerful new tool in ageing research33,47. However, though
mitochon-drial dysfunction and heteroplasmy have been long implicated in ageing, there remains a paucity of data from non-human or non-model organisms to associate increased heteroplasmy as a mechanism underpinning the pro-gressive, ageing phenotype. To this end, for the first time we have deep sequenced, to an average depth of >3500X, whole mitogenomes from 195 M. myotis individuals, and investigated the association between heteroplasmy and age in these long-lived bats. After outlier removal, we found no evidence for an increase in heteroplasmy with age. We also found little to no evidence to support the Free Radical Theory of Ageing, finding no chronic increase in oxidative mutations with age. Through unique, longitudinal sampling we found bats may experience local oxida-tive stress events followed by removal of the majority of mutations. Nonsynonymous, protein coding mutations were also at a significantly lower frequency than synonymous, and those with predicted deleterious effects were lower again. Together our results suggest M. myotis may remove deleterious mitochondrial DNA mutations, pre-venting their expansion, to maintain mitochondrial homeostasis, and possibly promoting longevity. This hypoth-esis will need further investigation.
The FRTA posits oxidative mutations in the mitogenome should drive mitochondrial dysfunction3. However,
many studies have shown a dearth of oxidative mutations in mitochondrial DNA48. Studies in model and
long-lived non-model organisms have also led many to question this central tenets of the FRTA19,48–50. We found
little support for the FRTA in M. myotis. Transitions, not oxidative transversions, are the primary source of muta-tion. Transitions are likely due to errors during DNA replication or spontaneous deamination of nucleosides, rather than damage accrued by oxidative stress4,7. Still, the proportion of heteroplasmies owing to oxidative
trans-versions in M. myotis mitochondrial DNA is much higher than reported in humans13,15. However, the majority of
these oxidative mutations were concentrated in only a few individuals. These likely represent local oxidative stress events, rather than a population wide phenomenon. The longitudinal data supports this interpretation as two individuals exhibiting high numbers of oxidative transversions, and some of the highest levels of heteroplasmy, were also sampled the following year (individuals 000702E6B0 and 000702FF51, Fig. 3). They had cleared or repaired the majority of the oxidative damage, though each retained at least one of the heteroplasmies from the previous year. We suggest M. myotis experience local, transient oxidative stress followed by return to homeostasis and removal or repair of oxidative lesions.
As oxidative damage is concentrated, and transient, within a small proportion of individuals, it is unlikely to be the ultimate driver of ageing, as posited in the FRTA. It also seems unlikely that flight is the cause of this oxidative stress, as it should then be ubiquitous across the population rather than concentrated in few individu-als. There are multiple other explanations for the transient oxidative damage observed in only some individuals, including infection and recent reproductive effort51–53.
In recent years, the role of ROS as essential signalling molecules in immune cells has become clear. In vitro, macrophages recruit mitochondria to the phagosome where promotion of H2O2 production contributes to the Figure 3. Plots of heteroplasmy count against year sampled for 11 individuals. Heteroplasmy counts through
time for 11 individual bats which were sampled 3 or 4 times. Numbers above each plot indicate PIT number used to identify each individual. Some individuals were extremely consistent while others increased sharply, always followed by a decrease where subsequent samples were available.
control of Salmonella infection53. Activation of the NLRP3 inflammasome has also been shown to promote ROS
production52. It has been suggested that bats have a constitutively active innate immune system, possibly
explain-ing their unique ability to act as reservoirs for diverse viruses, such as SARS, which can be pathogenic in humans and other mammals54–57. The constitutive expression of interferon or the presence of circulating viruses in bats
may lead to acute levels of ROS production in bats enabling them to quickly mediate infection58,59. The long lived
bat species, Carollia perspicillata, has also been shown to experience increased oxidative stress during simulated bacterial infection60. Potentially, individuals showing increased oxidative damage were experiencing immune
related oxidative stress at the time of sampling, although this remains to be tested. This may also suggest that spikes in oxidative transversions are also a blood specific phenomenon; future studies incorporating different tissues may shed light on the role and effect of ROS in the bat immune system.
A second possibility is reproductive effort. It has been shown that reproductive effort increases oxidative stress in free living animals, though not unequivocally51. As the M. myotis sampled over the course of the study were
caught at maternity roosts, most females will have recently given birth to a pup, and may still be lactating. Under the disposable soma theory of ageing, reallocation of resources from self-maintenance to reproductive effort leads to increased damage of somatic tissue during reproductive phases, with unrepaired damage accumulating with time51,61. The spikes in oxidative damage followed by recovery as observed in our longitudinal sampling,
showed while most oxidative damage observed during the spike were eventually lost or removed, some mutations persisted, and could be detected the following year. Further longitudinal sampling, or sampling at different life history phases may help elucidate the cause of oxidative stress in these bats.
The relationship between age and heteroplasmy was unclear in bats. A positive correlation with age seen in our data was driven by two samples. These samples were clear outliers with a large effect on our regression. Removal of these samples also removed the association with age. The outliers were both in the oldest cohort and had two of the highest levels of heteroplasmy, primarily due to oxidative mutations. It seems likely these individuals may have been experiencing acute oxidative stress, and may have removed the majority of these oxidative mutations in following years, as seen in other individuals. However, this remains speculative as we have yet to re-sample these two individuals. Further, the observed dynamic nature of heteroplasmy questions the direct contribution of heteroplasmy to ageing in this species. However, as our study population has only been tagged since 2010 we have only sampled a small portion of the life span of these bats, which can live up to 37.1 years. It is possible accumu-lation of heteroplasmies is not detectable over this time scale, therefore further longitudinal analyses are required to sample individuals at known maximum age.
The question remains, how do bats maintain their efficient mitochondria, and how might this lead to an increased lifespan? Our data shows no support for flight induced oxidative damage accumulating in M.
myo-tis. However, oxidative stress is observed in numerous individuals, and those with samples from subsequent
time-points suggest possible removal of the majority of mutations, suggesting mitochondrial stress followed by repair or removal of damaged mitochondria. Further, nonsynonymous mutations were at significantly lower fre-quency than synonymous, suggesting purifying selection acting on these heteroplasmies. Nonsynonymous sites predicted to be deleterious were even lower in frequency again than those with little or no functional impact. This suggests M. myotis may prevent expansion of deleterious, nonsynonymous mutations which has been shown to contribute to the ageing phenotype in human and mouse models23,62. This may further contribute to the
mainte-nance of mitochondrial function with age.
There are multiple mechanisms by which M. myotis may remove and prevent expansion of mitochondrial mutations. One such mechanism is through direct repair of DNA damage. DNA repair genes and pathways have been shown to be evolving or expressed differently in bats compared to other mammals63–65, however,
many of these pathways are not active in the mitochondria. Base excision repair (BER) is the primary method of DNA repair in mitochondria. While double strand break repair operates in mitochondria, the mechanisms have not been fully characterised4. Another mechanism by which M. myotis may remove oxidative damage is
through mitophagy. Mitophagy is a form of autophagy through which cells remove dysfunctional mitochondria. Inhibition of autophagy, and so mitophagy, by knockdown of autophagosome genes has also been shown to lead to increased ROS production48. Mitochondria derived ROS have also been shown to promote autophagy during
starvation, through oxidation and inactivation of the ATG4 protein66. Long lived bats have also been shown
to have increased macroautophagy activity in comparison to a short-lived, phylogenetically close sister taxa. Interestingly, other homeostatic mechanisms such as chaperone protein levels and proteasome activity, showed no difference in long and short-lived bats67. This suggests long-lived bats rely on autophagy for maintaining
homeostasis. Indeed, previous studies have shown that autophagy genes are upregulated in the blood of M. myotis compared to other mammals65. Coupled with our results, this suggests M. myotis may possess stringent
mito-chondrial quality control to prevent accumulation and expansion of deleterious mutations, contrary to what has been shown in humans13,15,16. Continued longitudinal sampling and experimental validation are necessary to
determine if these mechanisms truly prevent or limit accumulation of heteroplasmies with age in M. myotis. Also, further comparative studies are needed to ascertain if this ‘maintenance phenotype’ is common across Chiroptera and amongst other long lived species.
In conclusion, we found little support for the long standing “Free Radical Theory of Ageing” in the excep-tionally long-lived bat, M. myotis. Instead, oxidative mutations were not the primary source of mutations and most seemed to be transient, arising from local oxidative stress events before disappearing. We did not find that accumulation of heteroplasmic sites in the mitogenome increases with age in these bats, however, we have only analysed a small portion of the lifespan of this species. Unique longitudinal sampling revealed the dynamic nature of heteroplasmy, with some bats gaining or losing up to 6 heteroplasmies between consecutive years. These drastic shifts in heteroplasmy suggest increases in heteroplasmy may not only be tolerable but removable in M. myotis. We propose that stringent mitochondrial quality control mechanisms drives mitochondrial health, potentially contributing to the exceptional longevity of M. myotis.
Methods
Capture and Sampling.
All procedures were carried out in accordance with the ethical guidelines and per-mits delivered by University College Dublin and the Préfet du Morbihan respectively. M. myotis were sampled in western France in 2013, 2014, 2015 and 2016 (detailed in Table 4) as previously described3.DNA Extraction.
Prior to DNA extraction all blood samples had RNA extracted using the RNAzol BD for blood kit (catalogue number RB 192, Molecular Research Centre, Inc.) using the manufacturers protocol with minor modification as previously described68. Post extraction of the RNA containing layer, the phenol phase/interphase, was placed at −80 °C. DNA was extracted from the phenol phase/interphase using the protocol detailed in the RNAzol BD kit manual with minor modifications. Briefly, for each original volume of blood, the DNA extraction buffer was prepared with 1 volume of 4 M guanidine thiocynate solution, 0.1 volumes of 3 M sodium hydroxide and 0.005 volumes of polyacryl carrier. Samples were allowed to thaw in the DNA extraction buffer and then were vortexed vigorously for 30 s. Samples were incubated at room temperature (RT) for 10 min-utes, then vortexed for 30 s. 0.2 volumes of chloroform was added to each sample, briefly vortexed, and centri-fuged at 12000 rpm for 20 mins at RT. The upper fraction was extracted, and extracted once more with an equal volume of chloroform where necessary, to produce a clear, aqueous DNA phase. DNA was precipitated overnight at −20 °C in an equal volume of isopropanol. DNA was pelleted by centrifugation at 12000 rpm for 20 mins at 4 °C. DNA pellets were washed twice with 75% ethanol and then resuspended in 30 µl nuclease free water.
mtDNA Enrichment and Sequencing.
The whole mitogenome of M. myotis was amplified and sequenced using the primers, and sequencing protocols outlined previously69. Briefly, samples were enriched formitochon-drial sequences using long range PCR, in two overlapping ~10 kb fragments. Both amplicons were successfully amplified for 252 samples. The two amplicons for each of the 252 samples were purified by vacuum filtration (MilliporeHTS Filtration Plate, cat. no. MAVM0960R), quantified using a nanodrop spectrophotometer and then pooled in equimolar amounts. Pooled amplicons were used to produce sequencing libraries using the Nextera XT preparation kit as per the manufacturer’s instructions. Varying numbers of samples were multiplexed and loaded onto an Illumina MiSeq.
Quality Control.
Raw reads were initially processed using a stringent quality control pipeline prior to variant calling. Samples were trimmed of Illumina and Nextera adapter sequences using Cutadapt (v1.8.3)70 and The NGSQC Toolkit71 was used to filter out reads for which 80% of bases had quality scores less than Q30. Due to extreme
sequence depths at small target regions in resequencing studies, it is possible that inserts will begin and end at the same position due to chance, called sampling coincidence. Reads from such inserts will be falsely identified as PCR duplicates. However, not removing true PCR duplicates may affect the accuracy of variant calling. In order to remove any potential bias introduced by duplicate removal or retention, we ran the heteroplasmy detection pipe-line with duplicates present and removed. As some samples showed extremely high levels of variation between treatments we used the interquartile range to identify and remove outliers. An outlier was defined as any value for which the count value was 2 interquartile ranges below the first quartile or above the third quartile. The mean and standard deviation of these filtered counts was then calculated. A cut-off value of two standard deviations from the mean was rounded down to the nearest integer value. Samples with a difference in counts between the two treatments, which was greater than this cut-off were deemed unreliable and removed from downstream analysis. Finally, average coverage was calculated for each sample using the depth command in samtools (v0.1.19)72. As all
variant callers exhibited power below 80% at coverage below 1000X (Fig. 2), samples with an average coverage below this threshold were removed.
Heteroplasmy Detection Pipeline.
The first and last 500 bp of the mitogenome were copied to the oppo-site ends, to extend the reference and account for circularity of the mitogenome. Reads were mapped against the extended M. myotis mitogenome using the BWA-MEM73 algorithm. Prior to variant calling BAM files werepro-cessed using Picard Tools (v1.90)74 and the Genome Analysis Tool Kit (GATK)75. Briefly, SAM files were sorted
and read groups added using Picard Tools. SAM files were then converted to BAM files and indexed. Prior to base quality recalibration a set of raw variants was produced using the chosen low frequency variant caller, either LoFreq Star76 or VarScan 277. These raw variants were used as the “known sites” necessary for the BQSR walker
in the GATK. As no databases of variants exist for most non-model organisms, these raw variants provide an ad
hoc solution. Final heteroplasmies were called on the recalibrated data again using the caller of choice. A third
variant caller, FreeBayes78, does not require recalibrated or realigned data, and so these steps were omitted when
FreeBayes was used. For the empirical data, variants with a minor allele frequency greater than 1% and at sites with greater than 1000X coverage were retained. These variants were then annotated, removing variants in primer
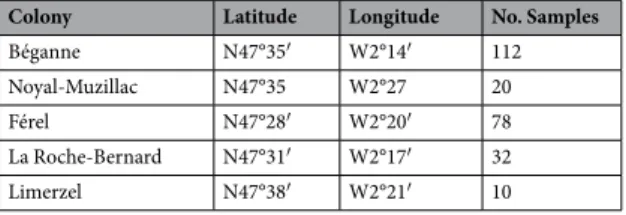
Colony Latitude Longitude No. Samples
Béganne N47°35′ W2°14′ 112 Noyal-Muzillac N47°35 W2°27 20 Férel N47°28′ W2°20′ 78 La Roche-Bernard N47°31′ W2°17′ 32 Limerzel N47°38′ W2°21′ 10
Table 4. Colony location and sample numbers. Latitude and longitude of 5 sampling colonies, and the total
binding sites and the two Myotinae repeats in the control region. An illustration of the bioinformatic workflow for a single sample from quality processing through to annotated variants is depicted in Supp. Fig. 6. GNU Parallel (v20170122)79 was used to parallelise the mapping and processing of SAM and BAM files, markedly decreasing
computational time. The number of samples to be run in parallel can be defined by the user.
Variant Simulation.
In order to gauge the sensitivity, accuracy and false positive rate of our bioinformatic pipeline, known variants and Illumina sequence data were generated in-silico using the GemSIM package (v 1.5)46.Sequence reads in FASTQ format from a reference individual (MMY104, used to generate the reference mitoge-nome for this species) were mapped to the previously published M. myotis mitogemitoge-nome69 using the BWA-MEM
algorithm, producing a SAM file which was used to produce a general error model using the GemErr.py module. The reference mitogenome was used to generate haplotype information for variant simulation with the GemHap. py module. In total 500 known variants were simulated, in sets of 100 at frequencies of 1%, 4%, 7%, 10% and 15%. 7 sites were found in two datasets and were excluded from the analysis, for a total of 486 heteroplasmic sites out of 17,211. The reference mitogenome, error profile and haplotype information were used to generate 250 bp paired end Illumina reads. Datasets were simulated at 50X, 100X, 250X, 500X, 1000X, 2500X, 5000X, 10,000X and 25,000X coverage. Predicted variant positions were checked against the known set. Power (proportion of true sites called), false positive rate (proportion of erroneous sites called) and accuracy (proportion of true sites with predicted frequency within ±0.01 of the true frequency) were calculated on each dataset for each caller, FreeBayes, LoFreq and VarScan2 (see Heteroplasmy Detection Pipeline). Finally a score between 0 and 1 was assigned to each caller defined as (Power*Accuracy)*(1-False Positive Rate). All variants called from empirical samples used the best performing caller.
Characterising heteroplasmy in M. myotis.
All filtered and annotated heteroplasmies were collected and manually inspected. Heteroplasmies were binned into several overlapping classes: protein-coding, synon-ymous, nonsynonsynon-ymous, non-protein-coding, tRNA, rRNA, non-coding, and by each mitogenome feature. Nonsynonymous mutations were further binned for possible effect as “Deleterious” or “Neutral” based on the PROVEAN algorithm as implemented on the dedicated web server. Default cut-offs were used such that a muta-tion was binned as “Deleterious” if the computed PROVEAN Score was greater than 2.5 or less than −2.580,81.Frequency distributions for each bin were compared using a two tailed non-parametric Kolmogorov-Smirnov Test or Mann-Whitney U-test. The number of unique heteroplasmic sites in a bin was tested for enrichment against the remainder of mitogenome sites analysed (length of mitogenome – primer regions – number of sites covered by bin), using Pearson’s Chi-Square test.
Association between heteroplasmy and age.
A primary dataset of n = 167 was constructed from unique individuals of known age and an oldest cohort, divided into cohorts from 0 to 6+, Tables 1 and 2, taking the most recent sample of an individual had the bat been sampled multiple times. The number of heteroplasmies for samples was compared between sequencing batches using Kruskal-Wallis test. The primary dataset was used to test for a significant association between number of heteroplasmic sites and age by fitting a generalised liner mixed model (GLMM) in R (v3.3.3) using the “lme4” package82 with age as the only fixed effect and incorporating sequencingbatch as a random effect, and number of heteroplasmic sites as the response variable modelled under a negative binomial distribution. A negative binomial distribution was used due the presence of overdispersion in the data making a Poisson distribution unsuitable. Subsequently a generalised linear model (GLM) was fit using the “MASS” package83 with age as the sole explanatory variable. The “boot” package84,85 in R (v3.3.3) was used to diagnose
sam-ples which may be unduly influential points using the Cook Statistic86. Influential points were removed and the
model was fitted again. 1000 bootstrap replicates were generated for each fitted model by randomly sampling with replacement from the datasets using the “boot” package in R. The standard error and bias for the Intercept and Age estimates were recorded. To investigate any bias that may be introduced by manually selecting a sample from recap-tured individuals, we performed 1000 samplings in which the sample from recaprecap-tured individuals of usable age was chosen at random, to produce 1000 datasets (of n = 165) and the model fit again.
Longitudinal Analysis.
M. myotis show natal philopatry, returning to the same roost or broad area to givebirth each year. As such, it was possible to recapture the same individuals almost every year. 27 individuals with samples from at least two time-points were sequenced; samples that passed quality control were retained, for a final set of 56 samples from 21 individuals (Tables 2 and 5). We calculated the mean change between any two consecutive years over all individuals, excluding 2 which were sampled non-consecutively. We also calculated the proportion of shared heteroplasmies between any two time-points, and those shared between all time-points.
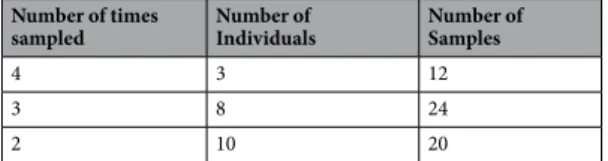
Number of times
sampled Number of Individuals Number of Samples
4 3 12
3 8 24
2 10 20
Table 5. Recaptured individuals and associated samples. Number of individuals sampled 4, 3 or 2 times
between 2013 and 2016. The final number of samples shown is for QC passed samples. Only these samples were used in recapture analysis.
Ethics approval.
All procedures were carried out in accordance with ethics approval issued by University College Dublin to Prof. Emma Teeling (AERC_1338_Teeling) and in accordance with Arrêté préfectoral permits issued by the Préfet de Morbihan to Frédéric Touzalin and Sébastien J. Puechmaille.Availability of Data and Material
Annotated variants and sample information used for statistical analyses are available within Additional File 1. The scripts and binaries for all dependencies needed to run the 3 ML pipeline are available at https://github.com/ jebbd/3 ML. Sequence data generated during the course of the project from empirical datasets are available via the Sequence Read Archive, SRP158182.
References
1. Rensch, T., Villar, D., Horvath, J., Odom, D. T. & Flicek, P. Mitochondrial heteroplasmy in vertebrates using ChIP-sequencing data.
Genome Biol. 17, 139 (2016).
2. Gustafsson, C. M., Falkenberg, M. & Larsson, N.-G. Maintenance and Expression of Mammalian Mitochondrial DNA. Annu. Rev.
Biochem. 85, 133–60 (2016).
3. Harman, D. Aging: a theory based on free radical and radiation chemistry. J. Gerontol. 11, 298–300 (1956).
4. Alexeyev, M., Shokolenko, I., Wilson, G. & LeDoux, S. The Maintenance of Mitochondrial DNA Integrity - Critical Analysis andUpdate. Cold Spring Harb. Perspect. Biol. 5, a012641–a012641 (2013).
5. Lagouge, M. & Larsson, N.-G. The role of mitochondrial DNA mutations and free radicals in disease and ageing. J. Intern. Med. 273, 529–43 (2013).
6. Barja, G. Free radicals and aging. Trends Neurosci. 27, 595–600 (2004).
7. Larsson, N. G. Somatic mitochondrial DNA mutations in mammalian aging. Annu. Rev. Biochem. 79, 683–706 (2010). 8. Lane, N. The problem with mixing mitochondria. Cell 151, 246–8 (2012).
9. Casoli, T., Spazzafumo, L., Di Stefano, G. & Conti, F. Role of diffuse low-level heteroplasmy of mitochondrial DNA in Alzheimer’s disease neurodegeneration. Front. Aging Neurosci. 7, 142 (2015).
10. Wang, Y., Picard, M. & Gu, Z. Genetic Evidence for Elevated Pathogenicity of Mitochondrial DNA Heteroplasmy in Autism Spectrum Disorder. PLoS Genet. 12, 1–24 (2016).
11. He, Y. et al. Heteroplasmic mitochondrial DNA mutations in normal and tumor cells. Nature 464, 610–614 (2010). 12. Payne, B. A. I. et al. Universal heteroplasmy of human mitochondrial DNA. Hum. Mol. Genet. 22, 384–390 (2013).
13. Li, M., Schröder, R., Ni, S., Madea, B. & Stoneking, M. Extensive tissue-related and allele-related mtDNA heteroplasmy suggests positive selection for somatic mutations. Proc. Natl. Acad. Sci. USA 112, 2491–6 (2015).
14. Ye, K., Lu, J., Ma, F., Keinan, A. & Gu, Z. Extensive pathogenicity of mitochondrial heteroplasmy in healthy human individuals. Proc.
Natl. Acad. Sci. USA 111, 10654–9 (2014).
15. Ding, J. et al. Assessing Mitochondrial DNA Variation and Copy Number in Lymphocytes of ~2,000 Sardinians Using Tailored Sequencing Analysis Tools. PLoS Genet. 11, e1005306 (2015).
16. Rebolledo-Jaramillo, B. et al. Maternal age effect and severe germ-line bottleneck in the inheritance of human mitochondrial DNA.
Proc. Natl. Acad. Sci. USA 111, 15474–9 (2014).
17. Keogh, M. J. & Chinnery, P. F. Mitochondrial DNA mutations in neurodegeneration. Biochim. Biophys. Acta (BBA)-Bioenergetics
1847, 1401–1411 (2015).
18. Kauppila, J. H. K. & Stewart, J. B. Mitochondrial DNA: Radically free of free-radical driven mutations. Biochim. Biophys. Acta
(BBA)-Bioenergetics 1847, 1354–1361 (2015).
19. Pérez, V. I. et al. Is the oxidative stress theory of aging dead? Biochim. Biophys. Acta 1790, 1005–1014 (2009).
20. Andziak, B. et al. High oxidative damage levels in the longest-living rodent, the naked mole-rat. Aging Cell 5, 463–471 (2006). 21. Fang, X. et al. Adaptations to a Subterranean Environment and Longevity Revealed by the Analysis of Mole Rat Genomes. Cell Rep.
8, 1354–1364 (2014).
22. Safdar, A. et al. Endurance exercise rescues progeroid aging and induces systemic mitochondrial rejuvenation in mtDNA mutator mice. Proc. Natl. Acad. Sci. USA 108, 4135–40 (2011).
23. Ross, J. M. et al. Germline mitochondrial DNA mutations aggravate ageing and can impair brain development. Nature 501, 412–5 (2013).
24. Fan, W. et al. A Mouse Model of Mitochondrial Disease Reveals Germline Selection Against Severe mtDNA Mutations. Sci. 319, 958–962 (2008).
25. Mao, X. et al. Heteroplasmy and ancient translocation of mitochondrial DNA to the nucleus in the Chinese Horseshoe Bat (Rhinolophus sinicus) complex. PLoS One 9, e98035 (2014).
26. Petri, B., Haeseler, Avon & Paabo, S. Extreme Sequence Heteroplasmy in Bat Mitochondrial DNA. Biol. Chem. 377, 661–667 (1996). 27. He, X. et al. High occurrence of length heteroplasmy in domestic Bactrian camel (Camelus bactrianus). Mitochondrial DNA Part A
0, 1–3 (2016).
28. Zhao, Y. J., Huang, Y. F. & others. Sheep mitochondrial heteroplasmy arises from tandem motifs and unspecific PCR amplification.
Mitochondrial DNA Part A 0, 1–5 (2016).
29. Fumagalli, L., Taberlet, P., Favre, L. & Hausser, J. Origin and evolution of homologous repeated sequences in the mitochondrial DNA control region of shrews. Mol. Biol. Evol. 13, 31 (1996).
30. Cook, C. E., Wang, Y. & Sensabaugh, G. A Mitochondrial Control Region and CytochromebPhylogeny of Sika Deer (Cervus nippon) and Report of Tandem Repeats in the Control Region. Mol. Phylogenet. Evol. 12, 47–56 (1999).
31. Hoelzel, A. R., Lopez, J. V., Dover, G. A. & O’Brien, S. J. Rapid evolution of a heteroplasmic repetitive sequence in the mitochondrial DNA control region of carnivores. J. Mol. Evol. 39, 191–199 (1994).
32. Lunt, D. H., Whipple, L. E. & Hyman, B. C. Mitochondrial DNA variable number tandem repeats (VNTRs): Utility and problems in molecular ecology. Mol. Ecol. 7, 1441–1455 (1998).
33. Austad, S. N. Methusaleh’s Zoo: how nature provides us with clues for extending human health span. J. Comp. Pathol. 142(Suppl), S10–21 (2010).
34. Brunet-Rossinni, A. K. & Austad, S. N. Ageing studies on bats: a review. Biogerontology 5, 211–22 (2004).
35. Seim, I. et al. Genome analysis reveals insights into physiology and longevity of the Brandt’s bat Myotis brandtii. Nat. Commun. 4, 2212 (2013).
36. Podlutsky, A. J., Khritankov, A. M., Ovodov, N. D. & Austad, S. N. A New Field Record for Bat Longevity. 60, 1366–1368 (2005). 37. Teeling, E. C. et al. Microbat paraphyly and the convergent evolution of a key innovation in Old World rhinolophoid microbats. Proc.
Natl. Acad. Sci. 99, 1431–1436 (2002).
38. Teeling, E. C. et al. A molecular phylogeny for bats illuminates biogeography and the fossil record. Science 307, 580–4 (2005). 39. Thomas, S. P. & Suthers, R. A. The physiology and energetics of bat flight. J. Exp. Biol. 57, 317–335 (1972).
40. Maina, J. N. What it takes to fly: the structural and functional respiratory refinements in birds and bats. J. Exp. Biol. 203, 3045–3064 (2000).
41. Munshi-South, J. & Wilkinson, G. S. Bats and birds: Exceptional longevity despite high metabolic rates. Ageing Res. Rev. 9, 12–9 (2009).
42. Brunet-Rossinni, A. K. Reduced free-radical production and extreme longevity in the little brown bat (Myotis lucifugus) versus two non-flying mammals. Mech. Ageing Dev. 125, 11–20 (2004).
43. Kerth, G., Mayer, F. & Konig, B. Mitochondrial DNA (mtDNA) reveals that female Bechstein’ s bats live in closed societies. Mol. Ecol.
9, 793–800 (2000).
44. Wilkinson, G. S., Mayer, F., Gerald, K. & Petri, B. Evolution of Repeated Sequence Arrays in the D-Loop Region of Bat Mitochondrial DNA. Genetics 146, 1035–1048 (1997).
45. Hoofer, S. R. & van den Bussche, R. A. Molecular phylogenetics of the chiropteran family Vespertilionidae. Acta Chiropterologica 5, 1–63 (2003).
46. McElroy, K. E., Luciani, F. & Thomas, T. GemSIM: general, error-model based simulator of next-generation sequencing data. BMC
Genomics 13, 74 (2012).
47. de Magalhães, J. P. & Kean, M. Endless paces of degeneration–applying comparative genomics to study evolution’s moulding of longevity. EMBO Rep. 14, 661–2 (2013).
48. Kauppila, T. E. S., Kauppila, J. H. K. & Larsson, N.-G. Mammalian Mitochondria and Aging: An Update. Cell Metab. 1–15 https:// doi.org/10.1016/j.cmet.2016.09.017 (2016).
49. Speakman, J. R. et al. Oxidative stress and life histories: Unresolved issues and current needs. Ecol. Evol. 5, 5745–5757 (2015). 50. Buffenstein, R., Edrey, Y. H., Yang, T. & Mele, J. The oxidative stress theory of aging: Embattled or invincible? Insights from
non-traditional model organisms. Age (Omaha). 30, 99–109 (2008).
51. Speakman, J. R. & Garratt, M. Oxidative stress as a cost of reproduction: Beyond the simplistic trade-off model. BioEssays 36, 93–106 (2014).
52. Nathan, C. & Cunningham-Bussel, A. Beyond oxidative stress: an immunologist’s guide to reactive oxygen species. Nat. Rev.
Immunol. 13, 349–61 (2013).
53. McGettrick, A. F. & O’Neill, La. J. How Metabolism Generates Signals during Innate Immunity and Inflammation. J. Biol. Chem. 288, 22893–8 (2013).
54. Li, W. Bats Are Natural Reservoirs of SARS-Like Coronaviruses. Science (80-.). 310, 676–679 (2005).
55. Wang, L. F., Walker, P. J. & Poon, L. L. M. Mass extinctions, biodiversity and mitochondrial function: Are bats ‘special’ as reservoirs for emerging viruses? Curr. Opin. Virol. 1, 649–657 (2011).
56. Calisher, C. H., Childs, J. E., Field, H. E., Holmes, K. V. & Schountz, T. Bats: Important reservoir hosts of emerging viruses. Clin.
Microbiol. Rev. 19, 531–545 (2006).
57. Luis, A. D. et al. A comparison of bats and rodents as reservoirs of zoonotic viruses: are bats special? Proc. R. Soc. B Biol. Sci. 280 (2013).
58. Zhou, P. et al. Contraction of the type I IFN locus and unusual constitutive expression of IFN-α in bats. Proc. Natl. Acad. Sci. 113, 2696–2701 (2016).
59. Sena, L. & Chandel, N. Physiological roles of mitochondrial reactive oxygen species. Mol. Cell 48, 158–167 (2012).
60. Schneeberger, K., Czirjak, G. A. & Voigt, C. C. Inflammatory challenge increases measures of oxidative stress in a free-ranging, long-lived mammal. J. Exp. Biol. 216, 4514–4519 (2013).
61. Garratt, M. et al. Tissue-dependent changes in oxidative damage with male reproductive effort in house mice. Funct. Ecol. 26, 423–433 (2012).
62. Greaves, L. C. et al. Clonal Expansion of Early to Mid-Life Mitochondrial DNA Point Mutations Drives Mitochondrial Dysfunction during Human Ageing. PLoS Genet. 10, e100420 (2014).
63. Zhang, G. et al. Comparative analysis of bat genomes provides insight into the evolution of flight and immunity. Science 339, 456–60 (2013).
64. Morgan, C. C. et al. Molecular adaptation of telomere associated genes in mammals. BMC Evol. Biol. 13, 251 (2013).
65. Huang, Z., Jebb, D. & Teeling, E. C. Blood miRNomes and transcriptomes reveal novel longevity mechanisms in the long-lived bat, Myotis myotis. BMC Genomics 17, 906 (2016).
66. Scherz-Shouval, R. et al. Reactive oxygen species are essential for autophagy and specifically regulate the activity of Atg4. EMBO J.
26, 1749–60 (2007).
67. Pride, H. et al. Long-lived species have improved proteostasis compared to phylogenetically-related shorter-lived species. Biochem.
Biophys. Res. Commun. 457, 669–675 (2015).
68. Huang, Z. et al. A non-lethal sampling method to obtain, generate and assemble whole-blood transcriptomes from small, wild mammals. Mol. Ecol. Resour. 16, 150–162 (2016).
69. Jebb, D., Foley, N. M., Puechmaille, S. J. & Teeling, E. C. The complete mitochondrial genome of the Greater Mouse-Eared bat, Myotis myotis (Chiroptera: Vespertilionidae). Mitochondrial DNA 28, 347–349 (2017).
70. Martin, M. Cutadapt removes adapter sequences from high-throughput sequencing reads. EMBnet.journal 17, 10 (2011). 71. Patel, R. K. & Jain, M. NGS QC toolkit: A toolkit for quality control of next generation sequencing data. PLoS One 7 (2012). 72. Li, H. et al. The Sequence Alignment/Map format and SAMtools. Bioinformatics 25, 2078–2079 (2009).
73. Li, H. Aligning sequence reads, clone sequences and assembly contigs with BWA-MEM. arXiv:1303.3997[q-bio.GN] (2013). 74. Picard tools version 1. 90. http://broadinstitute.github.io/picard at citeulike-article-id:12519005.
75. DePristo, M. A. et al. A framework for variation discovery and genotyping using next-generation DNA sequencing data. Nat. Genet.
43, 491–498 (2011).
76. Wilm, A. et al. LoFreq: a sequence-quality aware, ultra-sensitive variant caller for uncovering cell-population heterogeneity from high-throughput sequencing datasets. Nucleic Acids Res. 40, 11189–201 (2012).
77. Koboldt, D. C. et al. VarScan 2: Somatic mutation and copy number alteration discovery in cancer by exome sequencing. Genome
Res. 22, 568–576 (2012).
78. Garrison, E. & Marth, G. Haplotype-based variant detection from short-read sequencing. 9 at http://arxiv.org/abs/1207.3907 (2012). 79. Tange, O. GNU Parallel - The Command-Line Power Tool. login USENIX Mag. 36, 42–47 (2011).
80. Choi, Y. & Chan, A. P. PROVEAN web server: A tool to predict the functional effect of amino acid substitutions and indels.
Bioinformatics 31, 2745–2747 (2015).
81. Choi, Y., Sims, G. E., Murphy, S., Miller, J. R. & Chan, A. P. Predicting the Functional Effect of Amino Acid Substitutions and Indels.
PLoS One 7 (2012).
82. Bates, D., Mächler, M., Bolker, B. & Walker, S. Fitting Linear Mixed-Effects Models Using lme4. J. Stat. Softw. 67, 1–48 (2015). 83. Venables, W. N. & Ripley, B. D. Modern Applied Statistics with S. at http://www.stats.ox.ac.uk/pub/MASS4 (Springer, 2002). 84. Canty, A. & Ripley, B. D. boot: Bootstrap R (S-Plus) Functions (2017).
85. Davison, A. C. & Hinkley, D. V. Bootstrap Methods and Their Applications. at http://statwww.epfl.ch/davison/BMA/ (Cambridge University Press, 1997).
86. Cook, R. D. Influential Observations and Outliers in Linear Regression. Technometrics 19, 15–18 (1977).
87. Lohse, M., Drechsel, O. & Bock, R. OrganellarGenomeDRAW (OGDRAW): A tool for the easy generation of high-quality custom graphical maps of plastid and mitochondrial genomes. Curr. Genet. 52, 267–274 (2007).
Acknowledgements
The authors would like to thank the European Research Council for funding. For assistance in the field we would like to thank: members of Bretagne Vivante, Dr. Serena Dool, students from UCD and all owners/local authorities for allowing access to the sites. We would like to thank the members of the Teeling lab and Dr. John A. Finarelli for helpful discussion of the analyses. This project was funded by a European Research Council Research Grant ERC-2012-StG311000 awarded to E.C.T. The French field study is supported by a Contrat Nature grant awarded to Bretagne Vivante.
Author Contributions
E.C.T. and D.J. devised the study. All authors participated in the capture and sampling of M. myotis bats. D.J. and C.V.W. extracted DNA and prepared samples for sequencing. All sequence data was analysed by D.J. D.J. was responsible for statistical analyses. D.J. is responsible for the figures presented throughout. The manuscript was written by E.C.T. and D.J. with input from all authors.
Additional Information
Supplementary information accompanies this paper at https://doi.org/10.1038/s41598-018-31093-2.
Competing Interests: The authors declare no competing interests.
Publisher's note: Springer Nature remains neutral with regard to jurisdictional claims in published maps and
institutional affiliations.
Open Access This article is licensed under a Creative Commons Attribution 4.0 International
License, which permits use, sharing, adaptation, distribution and reproduction in any medium or format, as long as you give appropriate credit to the original author(s) and the source, provide a link to the Cre-ative Commons license, and indicate if changes were made. The images or other third party material in this article are included in the article’s Creative Commons license, unless indicated otherwise in a credit line to the material. If material is not included in the article’s Creative Commons license and your intended use is not per-mitted by statutory regulation or exceeds the perper-mitted use, you will need to obtain permission directly from the copyright holder. To view a copy of this license, visit http://creativecommons.org/licenses/by/4.0/.