Publisher’s version / Version de l'éditeur:
Vous avez des questions? Nous pouvons vous aider. Pour communiquer directement avec un auteur, consultez
la première page de la revue dans laquelle son article a été publié afin de trouver ses coordonnées. Si vous n’arrivez pas à les repérer, communiquez avec nous à PublicationsArchive-ArchivesPublications@nrc-cnrc.gc.ca.
Questions? Contact the NRC Publications Archive team at
PublicationsArchive-ArchivesPublications@nrc-cnrc.gc.ca. If you wish to email the authors directly, please see the first page of the publication for their contact information.
https://publications-cnrc.canada.ca/fra/droits
L’accès à ce site Web et l’utilisation de son contenu sont assujettis aux conditions présentées dans le site LISEZ CES CONDITIONS ATTENTIVEMENT AVANT D’UTILISER CE SITE WEB.
25th International Conference on Offshore Mechanics and Arctic Engineering [Proceedings], 2006
READ THESE TERMS AND CONDITIONS CAREFULLY BEFORE USING THIS WEBSITE. https://nrc-publications.canada.ca/eng/copyright
NRC Publications Archive Record / Notice des Archives des publications du CNRC : https://nrc-publications.canada.ca/eng/view/object/?id=3fe09ae1-fdff-4e30-8800-c90fd5149d46 https://publications-cnrc.canada.ca/fra/voir/objet/?id=3fe09ae1-fdff-4e30-8800-c90fd5149d46
NRC Publications Archive
Archives des publications du CNRC
This publication could be one of several versions: author’s original, accepted manuscript or the publisher’s version. / La version de cette publication peut être l’une des suivantes : la version prépublication de l’auteur, la version acceptée du manuscrit ou la version de l’éditeur.
Access and use of this website and the material on it are subject to the Terms and Conditions set forth at
A computational investigation of the effect of geometric parameters on the discharge rate of a ship opening
DRAFT
OMAE2006-92404
A Computational Investigation of the Effect of Geometric Parameters
on the Discharge Rate of a Ship Opening
Yasser Nabavi University of British Columbia
Mechanical Engineering Dept. Vancouver, BC, Canada
yasser@mech.ubc.ca
Sander M Calisal University of British Columbia
Mechanical Engineering Dept. Vancouver, BC, Canada calisal@mech.ubc.ca Ayhan Akinturk NRC-IOT St John’s, NL, Canada Ayhan.Akinturk@nrc-cnrc.gc.ca
Keywords: water discharge, numerical simulation, free surface, volume of fluid model
Abstract
The purpose of the research was to find a relationship between the geometric characteristics of an opening on deck and the water discharge rate. This study is aimed at the stability of open deck ferries and fishing vessels. The effective parameters on the discharge rate are the beam, depth of the water collected on the deck and the discharge gap height. In this study, CFD analyses for water discharge from a ship deck were conducted, and the commercial code FLUENT was used to conduct the simulations. A two dimensional unsteady 2nd order solver in time and space was used for the simulation. The two-phase free surface model was simulated by the Volume of Fluid (VOF) model.
Using the water discharge, the instantaneous depth Froude number was calculated as a part of the
non-dimensional simulation. The effect of geometric parameters on the water discharge rate was investigated by keeping two parameters fixed while changing the third parameter. For each parameter, three different values were evaluated and the comparisons of all the twenty seven possible combinations of the effective parameters were presented. Results were compared with the
experimental results obtained earlier at UBC.
Introduction
Water collection due to the interaction of vessels motion and ocean waves usually causes significant problems for ferries and fishing vessels. These problems can be in the forms of damage to people on deck, ship facilities, and loss of stability. In order to avoid water collection on the deck, several experiments were conducted and a minimum freeboard requirement was suggested [2-4]. There were also numerical simulations conducted to investigate the effect of the water collection on deck during roll motion of a ship [5] and to predict the green water and wave loading [6]. Experimental research at the University of British Columbia showed that the
discharge rate from an opening of a ship is dependent on certain geometric parameters of the opening as well as collected water on deck [1]. These parameters, as shown in Figure 1 are: the length of the tank (presenting half beam of the vessel), the opening height (gap height) and the height of the water collected initially.
Figure 1.a Schematic of the simulated area
Figure 1.b Model for water discharge
The purpose of the current research was to computationally investigate the effects of the above mentioned parameters on the discharge rate from a ship opening. This research also shows that a great deal of reduction in cost and time spent on experimental modeling can be achieved by conducting computational simulation. By choosing three different tank lengths, three collected water heights and three opening heights,
twenty seven combination models were built and the discharge rate was computed as a function of time. The results were then non-dimensionalised. Although the open channel flow theories state that in a steady-state open channel flow over a weir the Froude number is at most unity, numerical results show that the Froude number will exceed unity in unsteady conditions. This may be attributed to the generation of waves inside the tank created by the discharging water. These waves propagate back and forth in the tank and cause the Froude number at the outlet to exceed unity. The fact that the Froude number exceeds unity in unsteady condition has been shown previously in the experiments conducted at the University of British Columbia [1].
CFD Model
The commercial code, FLUENT, was used as the solver while GAMBIT was used as the modeling and meshing software. Twenty seven two-dimensional models were created to investigate the effect of three important parameters affecting the discharge rate from a tank. These changing parameters and their values are displayed in table 1.
Table 1
Parameter Values
Tank Length (L) [ft] 2,4, and 6
Water Height (H) [in] 6,10, and 14 Discharge Gap Height
(Hg) [in] 2,4, and 6
A quadrilateral structured grid with appropriate aspect ratio was used to mesh the domain (figures 2.a and 2.b). A grid refinement study was conducted to
ensure that the grid is sufficiently fine for the required accuracy (figures 3.a and 3.b). The final mesh includes 28800 to 115200 quadrilateral structured cells depending on geometry. An unsteady, two-dimensional, segregated, 2nd order in time and space solver was used for the simulation. Air and fresh water were used as the working fluids. In addition, a Volume Of Fluid (VOF) method was used to simulate the two-phase flow and the free surface. The free surface was defined as the region where the volume fraction of water is 0.5. To record the value of the instantaneous water level 100 nodes were defined at the rear part of the tank. The volume fraction of water at each node was recorded every 0.2 seconds and written to a file. The water level was determined by identifying the point at which the volume fraction of water was 0.5. The instantaneous water discharge rate was also recorded at each time step (0.001 seconds). The results were subsequently non-dimensionalised to obtain dimensionless time and Froude number at the outlet.
Figure 2.a Grid at the outlet
Figure 2.b Grid of the domain
Grid Refinement Study
-10 0 10 20 30 40 50 60 0 0.5 1 1.5 2 2.5 3 3.5 Time (Sec) Q (K g / S e c ) 4 "Coarse Grid" "Fine Grid"
Figure 3.a Grid refinement study for a coarse (28800 cells) and fine (115200 cells)
Grid Refinement Study Result
-6 -4 -2 0 2 4 6 8 0 0.5 1 1.5 2 2.5 3 3.5 4 Time (Sec) Er ro r ( % )
Figure 3.b Difference between the coarse grid results and fine grid results in percent
Results and Discussion
After obtaining the mass flow rate at the outlet , the instantaneous water height at the rear of the tank and given the outlet area and real time of the simulation , the depth Froude number and time were calculated using Equation 1 and Equation 2.
(1)
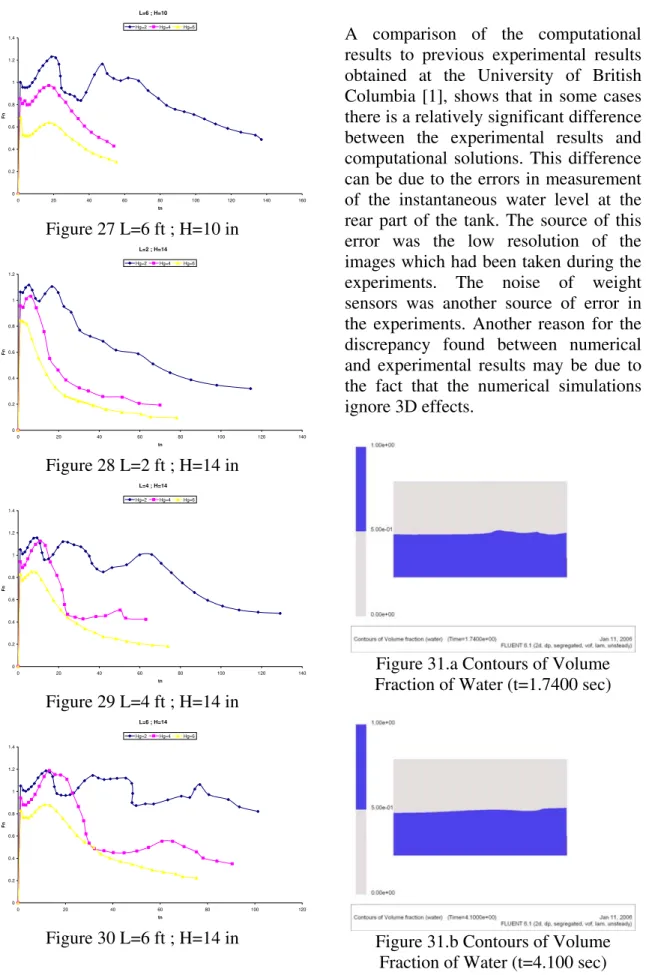
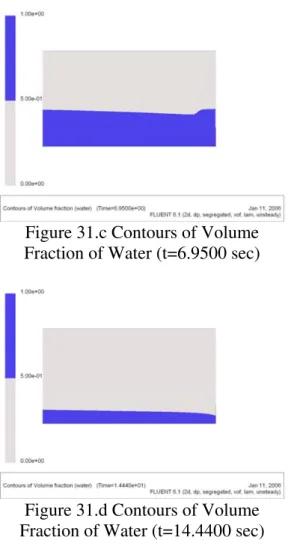
The non-dimensionalised results for all twenty seven combinations are presented in figures 4 to 30. Figures 4 to 12 show the effect of the tank length on the discharge rate from the opening. Figures 13 to 21 show the effect of the initial water height. Figures 22 to 30 show the effect of the gap height on the discharge rate. As an extension to the current research a much larger tank measuring twenty feet in length was examined with the initial water level set at 14 inches and the gap height set at 4 inches. Figures 31.a through 31.d show the contours of the volume fraction of water for this problem.
Tank Length Effect
Figures 4 through 12 reveal that in all cases Froude number starts from zero and reaches a maximum value (the first sharp peak point). This maximum value is almost the same for all the cases with the same initial water level and gap height. In other words, the value of the first maximum point is not highly dependent on the tank length. After the first maximum point, the tank length effect becomes more noticeable and different tank lengths generate different curves, each of which reach a specific second maximum point. The magnitude of these secondary peaks generally increases with an increase in tank length. In addition, it takes longer time for the longer tank to reach the second peak point. Thus, the longer the tank is, the longer it takes to reach the second peak, and the greater the second peak is. Another important fact that can be observed in these figures is that in some cases there is only two extremums while in others there are multiple extremums. The physical interpretation of this phenomenon can be explained by
observing an animation of the simulations results. The animation reveals that when the tank length or initial water height are large or when the gap height is small (which can result in slower water discharge) an extra pressure force is exerted at the outgoing flow and causes the Froude number exceed one (which is predicted for a steady state flow). If the discharge takes longer, waves start to slosh back and forth in the tank (see figures 31.a through 31.d). It can be seen from the animations that the number of times that these waves go back and forth is equal to the number of peak point of on the Froude number vs. non-dimensional time curve. The amplitude of the waves determines how sharp the curves are at the extremums. H=6;Hg=2 0 0.2 0.4 0.6 0.8 1 1.2 1.4 0 20 40 60 80 100 120 140 160 180 200 tn Fn L=2 L=4 L=6 Figure 4 H=6 in ; Hg=2 in H=10;Hg=2 0 0.2 0.4 0.6 0.8 1 1.2 1.4 0 20 40 60 80 100 120 140 160 tn Fn L=2 L=4 L=6 Figure 5 H=10 in ; Hg=2 in
H=14;Hg=2 0 0.2 0.4 0.6 0.8 1 1.2 1.4 0 20 40 60 80 100 120 140 tn Fn L=2 L=4 L=6 Figure 6 H=14 in ; Hg=2 in H=6 ; Hg=4 0 0.1 0.2 0.3 0.4 0.5 0.6 0.7 0 20 40 60 80 100 120 140 tn Fn L=2 L=4 L=6 Figure 7 H=6 in ; Hg=4 in H=10;Hg=4 0 0.2 0.4 0.6 0.8 1 1.2 0 10 20 30 40 50 60 70 80 9 tn Fn 0 L=2 L=4 L=6 Figure 8 H=10 in ; Hg=4 in H=14;Hg=4 0 0.2 0.4 0.6 0.8 1 1.2 1.4 0 10 20 30 40 50 60 70 80 90 100 tn Fn L=2 L=4 L=6 Figure 9 H=14 in ; Hg=4 in H=6;Hg=6 0 0.05 0.1 0.15 0.2 0.25 0.3 0.35 0.4 0.45 0 10 20 30 40 50 60 70 80 9 tn Fn 0 L=2 L=4 L=6 Figure 10 H=6 in ; Hg=6 in H=10;Hg=6 0 0.1 0.2 0.3 0.4 0.5 0.6 0.7 0.8 0 10 20 30 40 50 60 70 80 9 tn Fn 0 L=2 L=4 L=6 Figure 11 H=10 in ; Hg=6 in H=14;Hg=6 0 0.1 0.2 0.3 0.4 0.5 0.6 0.7 0.8 0.9 1 0 10 20 30 40 50 60 70 80 9 tn Fn 0 L=2 L=4 L=6 Figure 12 H=14 in ; Hg=6 in
Initial Water Height Effect
Figures 13 through 21 show that the increase in water height causes the value of the first peak point to increase. Moreover, the increase in the water height causes the second peak to occur earlier in all cases. In some cases, however, the maximum value of the second peak increases with the increase in water height (figures 16 to 21) while in other cases it decrease with the
increase in water height (figures 13 to 15). This behavior occurs as a result of a blockage of water discharge (chocking of the outlet) due to the small outlet gap height and causes a pressure pulse propagating back into the tank. On the other hand, when the gap height is large enough (figures 16 to 21) the discharge rate (Froude number) increases when the volume of water to be discharged increases. L=2;Hg=2 0 0.2 0.4 0.6 0.8 1 1.2 0 20 40 60 80 100 120 140 tn Fn H=6 H=10 H=14 Figure 13 L=2 ft ; Hg=2 in L=4;Hg=2 0 0.2 0.4 0.6 0.8 1 1.2 1.4 0 20 40 60 80 100 120 140 tn Fn H=6 H=10 H=14 Figure 14 L=4 ft ; Hg=2 in L=6;Hg=2 0 0.2 0.4 0.6 0.8 1 1.2 1.4 0 20 40 60 80 100 120 140 160 180 200 tn Fn H=6 H=10 H=14 Figure 15 L=6 ft Hg=2 in L=2;Hg=4 0 0.2 0.4 0.6 0.8 1 1.2 0 10 20 30 40 50 60 70 80 90 100 tn Fn H=6 H=10 H=14 Figure 16 L=2 ft ; Hg=4 in L=4;Hg=4 0 0.2 0.4 0.6 0.8 1 1.2 0 20 40 60 80 100 120 140 tn Fn H=6 H=10 H=14 Figure 17 L=4 ft ; Hg=4 in L=6;Hg=4 0 0.2 0.4 0.6 0.8 1 1.2 1.4 0 10 20 30 40 50 60 70 80 90 100 tn Fn H=6 H=10 H=14 Figure 18 L=6 ft ; Hg=4 in L=2;Hg=6 0 0.1 0.2 0.3 0.4 0.5 0.6 0.7 0.8 0.9 1 0 10 20 30 40 50 60 70 80 9 tn Fn 0 H=6 H=10 H=14 Figure 19 L=2 ft ; Hg=6 in
L=4;Hg=6 0 0.1 0.2 0.3 0.4 0.5 0.6 0.7 0.8 0.9 0 10 20 30 40 50 60 70 8 tn Fn 0 H=6 H=10 H=14 Figure 20 L=4 ft ; Hg=6 in L=6;Hg=6 0 0.1 0.2 0.3 0.4 0.5 0.6 0.7 0.8 0.9 1 0 10 20 30 40 50 60 70 80 H=6 H=10 L=14 Figure 21 L=6 ft ; Hg=6 in
Gap Height Effect
As it can be seen in figures 22 through 30 the smaller the gap height the larger the maximum Froude number. Also, when the initial water height increases, the effect of the gap height is minimized and the difference between the maximum Froude numbers becomes smaller. L=2 ; H=6 0 0.2 0.4 0.6 0.8 1 1.2 0 10 20 30 40 50 60 70 80 90 100 tn Fn Hg=2 Hg=4 Hg=6 Figure 22 L=2 ft ; H=6 in L=4 ; H=6 0 0.2 0.4 0.6 0.8 1 1.2 1.4 0 20 40 60 80 100 120 140 tn Fn Hg=2 Hg=4 Hg=6 Figure 23 L=4 ft ; H=6 in L=6 ; H=6 0 0.2 0.4 0.6 0.8 1 1.2 1.4 0 20 40 60 80 100 120 140 160 180 200 tn Fn Hg=2 Hg=4 Hg=6 Figure 24 L=6 ft ; H=6 in L=2 ; H=10 0 0.2 0.4 0.6 0.8 1 1.2 0 10 20 30 40 50 60 70 80 90 100 tn Fn Hg=2 Hg=4 Hg=6 Figure 25 L=2 ft ; H=10 in L=4 ; H=10 0 0.2 0.4 0.6 0.8 1 1.2 1.4 0 20 40 60 80 100 120 140 tn Fn Hg=2 Hg=4 Hg=6 Figure 26 L=4 ft ; H=10 in
L=6 ; H=10 0 0.2 0.4 0.6 0.8 1 1.2 1.4 0 20 40 60 80 100 120 140 160 tn Fn Hg=2 Hg=4 Hg=6 Figure 27 L=6 ft ; H=10 in L=2 ; H=14 0 0.2 0.4 0.6 0.8 1 1.2 0 20 40 60 80 100 120 140 tn Fn Hg=2 Hg=4 Hg=6 Figure 28 L=2 ft ; H=14 in L=4 ; H=14 0 0.2 0.4 0.6 0.8 1 1.2 1.4 0 20 40 60 80 100 120 140 tn Fn Hg=2 Hg=4 Hg=6 Figure 29 L=4 ft ; H=14 in L=6 ; H=14 0 0.2 0.4 0.6 0.8 1 1.2 1.4 0 20 40 60 80 100 tn Fn 120 Hg=2 Hg=4 Hg=6 Figure 30 L=6 ft ; H=14 in
A comparison of the computational results to previous experimental results obtained at the University of British Columbia [1], shows that in some cases there is a relatively significant difference between the experimental results and computational solutions. This difference can be due to the errors in measurement of the instantaneous water level at the rear part of the tank. The source of this error was the low resolution of the images which had been taken during the experiments. The noise of weight sensors was another source of error in the experiments. Another reason for the discrepancy found between numerical and experimental results may be due to the fact that the numerical simulations ignore 3D effects.
Figure 31.a Contours of Volume Fraction of Water (t=1.7400 sec)
Figure 31.b Contours of Volume Fraction of Water (t=4.100 sec)
Figure 31.c Contours of Volume Fraction of Water (t=6.9500 sec)
Figure 31.d Contours of Volume Fraction of Water (t=14.4400 sec)
Conclusion
This paper focused on numerically predicting the influence tank length, water height and opening size has on the discharge rate of water from a ship opening.. Twenty seven numerical models were created to study the relationship between the parameters. The results showed that depth Froude number exceeds unity in unsteady conditions. Furthermore, in certain cases, especially when the gap height is small, waves begin to propagate in the tank. These waves affect the discharge rate significantly. On the other hand, in most cases which included none or minimal wave propagation, the discharge rate increased when the tank length and water height increased or when the gap height decreased. CFD
simulations proved to be a very useful tool for this study and are warranted for use in further studies on this topic, especially for cases involving large tank sizes not feasible for studying experimentally.
Nomenclature
A Cross sectional area of the opening
L Flooded length of the tank
H Initial water height inside the tank Hg Height of the opening
Hr Instantaneous water height at the rear end of the tank
Fn Depth Froude Number tn Non-dimensional time Q Volume flow rate
t Real time of simulation G Gravitational acceleration
Reference
[1] Akinturk, A., Calisal, S. M., Sireli E.M., 2004. “Water collection and discharge from an opening in ships”. OMAE2003, 22nd Conference on Offshore Mechanics and Arctic Engineering, Cancun, Mexico
[2] Calisal, S. M., Akinturk, A., Roddan, G. and Stensgaard, G. N., 1997. “Occurrence of water-on-deck for large, open shelter-deck ferries”. STAB’97, Sixth International
Conference on Stability of Ships and Ocean Vehicles, Varna, Bulgaria.
[3] Molyneux, D. W., Cumming, D., and Rousseau, J., 1997, “The use of freeing ports to prevent the capsize of damaged RO-RO ferries”, 4th Canadian Hydrodynamics and
Structures Conference, Ottawa.
[4] Molyneux, D. W., Rousseau, J., Cumming D., and Koniecki, M., 1998, “Model experiments to determine the
survivability limits of damaged RO-RO ferries in waves”,
Transactions of SNAME, Vol 105, pp. 297-321.
[5] Belenky, V., Liut, D., Weems, K., and Shin, Y. S., 2002, ‘‘Nonlinear Ship Roll Simulation With Water-On-Deck”, Proceedings of the 2002 Stability Workshop, Webb
Institute, October 13-16, NewYork. [6] Kleefsman, K. M. T., Fekken, G., Veldman, A. E. P., Bunnik, T. H. J., Buchner, B., and Iwanowski, B., 2002, “Prediction of Green Water and Wave Loading Using a
Navier-Stokes Based Simulation Tool”, Proceedings of the 21st International Conference on Offshore Mechanics and Arctic Engineering, Oslo, Norway