OATAO is an open access repository that collects the work of Toulouse
researchers and makes it freely available over the web where possible
Any correspondence concerning this service should be sent
to the repository administrator:
tech-oatao@listes-diff.inp-toulouse.fr
Official URL:
https://doi.org/10.1002/jrs.5513
This is an author’s version published in: http://oatao.univ-toulouse.fr/27628
To cite this version:
Ciszak, Clément and Mermoux, Michel and Gutierrez, Gaëlle and
Leprêtre, Frédéric and Duriez, Christian and Popa, Ioana and
Fayette, Laurent and Chevalier, Sébastien Raman spectra analysis of
ZrO 2 thermally grown on Zircaloy substrates irradiated with heavy
ion: Effects of oxygen isotopic substitution. (2019) Journal of
Raman spectra analysis of ZrO
2
thermally grown on
Zircaloy substrates irradiated with heavy ion: Effects of
oxygen isotopic substitution
Clément Ciszak
1,2| Michel Mermoux
3| Gaëlle Gutierrez
4| Frédéric Leprêtre
4|
Christian Duriez
5| Ioana Popa
2| Laurent Fayette
1| Sébastien Chevalier
21Commissariat à l'Energie Atomique et aux
Energies Alternatives (CEA), DEN/DEC, Saint‐Paul‐lez‐Durance, France
2ICB Laboratory, UMR 6303 CNRS, Univ.
Bourgogne Franche‐Comté, Dijon cedex, France
3CNRS, Grenoble INP, LEPMI, Univ.
Grenoble Alpes, Univ. Savoie Mont Blanc, Grenoble, France
4Commissariat à l'Energie Atomique et
aux Energies Alternatives (CEA), DEN/DANS/DMN, Gif‐sur‐Yvette, France
5Institut de Radioprotection et de Sûreté
Nucléaire (IRSN), PSN‐RES, Centre de Cadarache, Saint‐Paul‐lez‐Durance, France
Correspondence
Clément Ciszak, CIRIMAT‐ENSIACET, UMR CNRS 5085, 31030 Toulouse, France. Email: clement.ciszak@ensiacet.fr
Abstract
Recently, unusual Raman signals were observed in different works conducted on thin zirconia layers grown on zirconium alloys simulating in‐reactor mate-rials after high fluence ion irradiation or for samples cut from fuel rods irradi-ated in nuclear plants. As such, these spectra clearly do not correspond to any known spectrum of a pure standard zirconia phase. Therefore, the analysis conducted in this paper aims to provide a better understanding of these pecu-liar Raman features. For that purpose, specific ion‐irradiated samples were analysed. In situ Raman spectroscopy was first used to follow the irradiation process. Then, samples were characterized using different excitation wave-lengths. Finally, the effects of oxygen isotopic substitution were examined in details. Results are discussed in terms of disorder and size‐related effects. K E Y W O R D S
18O labelling, ion irradiation, irradiation damage, Raman spectra, Zirconia
1 | I N T R O D U C T I O N
During in‐pressurized water reactor operations, both inner and outer sides of the zirconium alloy cladding, enclosing the fuel pellets, are subjected to oxidation by the fuel for the inner one and by the primary coolant for the outer one. This leads to the progressive develop-ment of ZrO2layers that may exhibit a more or less
com-plex structure depending on their growing environments and/or the origin of the corrosion processes, which obvi-ously includes the nature of the irradiation phenomena affecting them.[1,2] Indeed, monoclinic zirconia, that is the thermodynamically stable phase at ambient pressure and temperature, is known to be sensitive to ion irradia-tion. As a matter of fact, induced damages may cause a partial or quasicomplete phase transition from mono-clinic (m) to tetragonal (t) structure at sufficient
irradiation doses,[3–11] depending on the ion mass, energy, and fluence. This phase transition was usually evidenced with X‐ray diffraction (XRD) measurements. As the discrimination between tetragonal and cubic (c) structures may be questionable from the XRD data, Raman spectroscopy is usually considered to be a simple and efficient alternative tool to follow this phase transi-tion. However, this procedure may be much more com-plex than one simply expected because of the well‐ known strong difference of the characteristic spectra of the different zirconia polymorphs. Although the tetrago-nal phase in the irradiated commercial m‐ZrO2 powders
or ceramics samples was recognized without any ambigu-ity from their corresponding Raman spectra,[3–7]unusual
signals were recently observed on thin zirconia layers grown on zirconium alloys, simulating in‐reactor mate-rials after high fluence‐ion irradiation [1,2,12–15] or even
for samples cuts from fuel rods irradiated up to an aver-age burnup of 58.7 GWd.tU−1 in Gravelines 5 reactor
(Electricité de France, France).[1,2]As described in the fol-lowing, this peculiar Raman signature measured with 514 or 532 nm wavelengths is mostly composed by four appar-ent broad bands peaking approximately at about 185, 260, 615, and 705 cm−1. In addition to these main bands, some
smaller structures can also be seen. In the former case, par-tial XRD data tended to indicate a quasicomplete m‐ZrO2
to t‐ZrO2phase transition, but these analyses were not
sys-tematically conducted. Moreover, comparing the different irradiation protocols used in previous studies,[1,2,12–15]it is difficult to extract a trend between the appearance of these unusual signals and the irradiation conditions; that is, the mass, energy, and fluence of the incident ions or particles. They were observed for light as well as heavy ion‐ irradiation (H, He, Au, Zr, Xe) for ion energies higher than 1 MeV and for fluences above 1013/cm2. It seems that they were also partially observed for Ne irradiation at 150 Kev for fluences above 1015/cm2.[15]For samples extracted from nuclear plants, these signals were exclusively observed close to metal|oxide inner and outer interfaces, that is in regions a priori mainly subjected to neutron irradiation.[1,2] To our knowledge, only a few attempts were made to iden-tify the origin of these peculiar signals.
Therefore, the analysis conducted in this paper aims to provide a better understanding of the nature and the modifications of these peculiar Raman features. Thus, complementary Raman measurements were performed using different excitation wavelengths on both virgin and ion‐irradiated Zr16O2 and labelled 18O‐enriched,
thermally grown layers. Here, isotopic substitution was considered because it can bring different information.
First, isotope substitution is a unique tool for distinguishing different Raman active modes as it can lead to reliable mode assignments. This method provides a mass contrast: only vibrations involving the motion of the specific substituted atom will be shifted upon isotopic substitution. In the case of zirconia, the zone‐centre Raman modes due to vibrations involving O atoms and those due to vibrations involving Zr atoms were success-fully discerned using the Raman spectra of 18O‐labelled compounds.[16]This experimental assessment was further confirmed using ab initio calculations.[17] In addition, measurements of the zone‐centre Raman wavenumbers for zirconia can be used as a versatile method to deter-mine the isotopic concentration ratio with a fair accu-racy.[18–20] This might be directly applied in two‐stage oxidation experiments using isotopes as diffusion tracers, which are known in the corrosion community to give valuable inputs on diffusion processes.[21,22] For such a purpose, it has been demonstrated that18O concentration profiles or maps compare well with those that were
extracted from secondary ion mass spectroscopy analy-sis.[19,20] Finally, isotopic substitution can also be used to ascertain whether or not a given spectral structure is of vibrational origin or due to another type of excitation, for example, of electronic origin.
In this paper, following our previous report,[2] we focused on specific samples, thermally grown virgin and ion‐irradiated Zr16O2 and labelled, 18O‐enriched layers.
Xe ions were selected as a compromise to simulate as best as possible the damage induced on zirconia by real fission recoils. Indeed, among the created fission products (FP) in nuclear fuel, Xe is one of the heaviest emitted fission recoils. Moreover, Xe is also commonly considered as the major gaseous FP, according to its relative abundance versus Kr (about 90% for 10% respectively). Xe was also selected to avoid any chemical interference between the incident ions and the target elements. It was shown that these irradiation conditions make it possible to reproduce the particular spectra observed for the spent fuel samples.[2]
These specific, labelled and unlabelled, virgin and ion‐ irradiated samples were described and analysed. In situ Raman spectroscopy was first used to follow the irradiation process. Then, samples were analysed using different excita-tion wavelengths. The results are tentatively discussed in terms of disorder, according to published zirconia total and partial vibrational density of states (VDOS). A particular attention has been paid to the effects of isotopic substitution.
2 | S A M P L E S A N D E X P E R I M E N T A L
D E T A I L S
Samples were prepared from Zircaloy‐4 discs (8 mm in diam-eter and about 1 mm thick) that were mechanically mirror polished prior to be oxidized in a thermobalance at 600 °C for 16 h in pure16O2and18O2‐enriched atmospheres. It led
in each case to the formation of a black, sub‐stoichiometric, ZrO2 layer. In the following, these samples are named
Zr16O2and Zr18O2, respectively. In the last case, the18O
aver-age content in the layer was about 80%, as measured from mass spectrometry analysis of the gas phase used for the oxi-dation. The targeted zirconia scales thicknesses were in the 4–5 μm range, which has been further confirmed with opti-cal microscopy. The two irradiated samples were then irradi-ated at room temperature with a 27 MeV Xe9+ion beam with flux of 1 × 10¹¹ ion cm−2 s−1 up to a fluence of
2.5 × 10¹⁵ion cm−2. The irradiations were performed at the
Joint Accelerators for Nanoscience and Nuclear Simulation (JANNuS Saclay), CEA, France, on the EPIMETHEE accelerator. Using a specific cooling system, samples were maintained close to room temperature. The electronic and nuclear energy losses were calculated with the TRIM code,[1]and showed that the depth of the implanted Xe ions,
as expected, approximately corresponded to the film thicknesses, that is, approximately 4 μm. After implantation, samples were cut for surface and cross‐section examinations. Reference monoclinic, yttrium‐stabilized tetragonal and cubic zirconia samples were also available for com-parison purposes.
The JANNuS facility, which also includes the possibil-ity of in situ Raman monitoring during irradiation, was extensively described in the study of Miro et al.[13]Thus, Raman spectra were sequentially recorded during irradia-tion. The excitation wavelength was the 532 nm line of a Nd:YAG laser. Post irradiation analyses were performed using two different spectrometers. The first one was an InVia Renishaw spectrometer. This spectrometer was equipped with an air‐cooled CCD detector, 2,400 and 1,200 grooves mm−1gratings and a microscope. The
exci-tation wavelength used were the 532 and 785 nm lines of a Nd:YAG and a diode laser, respectively. Spectra were acquired using 50× and 100× (NA = 0.75 and 0.9 respec-tively) objectives. Again, because unusual broad signals were observed, it was necessary to discriminate between Raman and photoluminescence signals. For such a pur-pose, we also used a Jobin–Yvon T64000 triple monochro-mator spectrometer and the 514, 488, and 325 nm excitation lines of Ar+ion and He‐Cd laser, respectively. This spectrometer was equipped with a UV‐enhanced liq-uid nitrogen‐cooled CCD detector and a microscope. Spec-tra were acquired using a 50× or a 40× (NA = 0.75 and 0.5)
objective and 1,800 or 2,400 grooves mm−1gratings in a
subtractive configuration. Before each analysis, the output laser power was adjusted to avoid excessive heating of the sample. For this, the main criterion was to select a power density for which no evolution of the line shape of the spectra versus time was detectable. Indeed, the use of excessive incident power densities led to a fast and com-plete recovery of the m‐ZrO2phase.[2] Within the
excep-tion of the UV excitaexcep-tion, typical acquisiexcep-tion times of individual spectra were in the 10–120 s range.
XRD measurements were performed at ICB labora-tory with a Bruker D8 Advance diffractometer equipped with a LYNXEYE XE detector using Cu Kα (λ = 0.154 nm) radiation. The incidence angle has been varied in the 1–10° range, to probe different thicknesses in the materials. Using such conditions, the calculated X‐ray penetration depth was in the 400 nm – 4 μm range.
3 | R E S U L T S
3.1 | Particular effects of ion‐irradiation
on the Raman spectra of thermally grown
ZrO
2layers
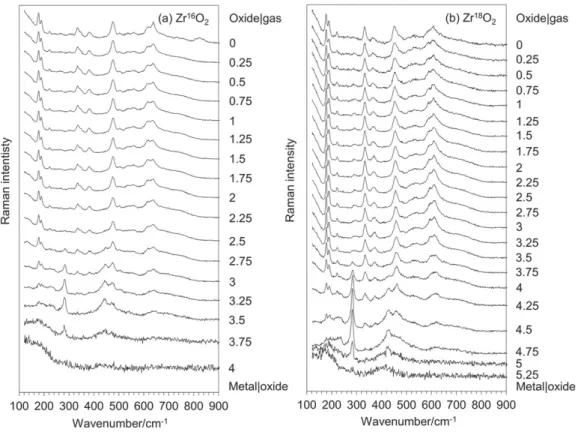
Figure 1 describes the cross‐section Raman profiles obtained on unirradiated Zr16O2(a) and Zr18O2(b) scales.
The oxide layers were mostly composed of m‐ZrO2, with a
FIGURE 1 Cross section Raman profiles obtained on unirradiated Zr16O2(a) and Zr18O2(b) scales. Corresponding positions are given in
minor contribution of t‐ZrO2, showing a good agreement
with the literature.[23] As already observed, t‐ZrO2 was
found to decorate the metal|oxide interface with its own characteristic spectral features, in particular, a line at about 280 cm−1,[24,25]not further discussed in this paper.
For the Zr18O2 sample (Figure 1b), the line shifts of the
high wavenumber m‐ZrO2lines due to isotopic
substitu-tion corresponded to the expected ones.[16,18] That point will be discussed later.
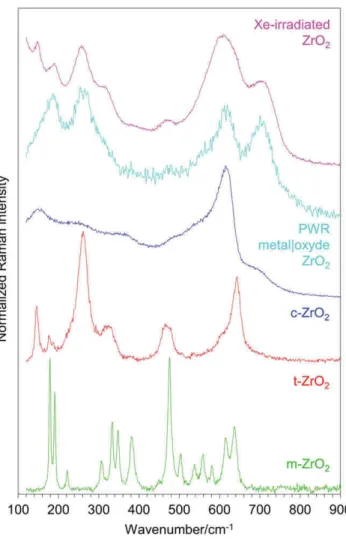
As illustrated in Figure 2, several changes were observed on the Raman spectra after Xe9+ ion beam irradiation. In that case, spectra were obtained with an excitation at 532 nm. For comparison purposes, a spec-trum recorded for a spent fuel material, close to the inner metal|oxide interface is also shown. It is seen that both spectra compare well. They systematically display broad and poorly resolved lines. This is a first strong indication of a high structural disorder and/or of materials with very small grains. For the spent fuel material, the aforemen-tioned apparent four broad bands peaking at about 185,
260, 615, and 705 cm−1 were clearly observed, in spite
of the low resolution of the spectrum that was obtained analyzing a highly radioactive material, in a hot cell.[1,2] The spectrum recorded for the “model” m‐Zr16O2 ion‐
irradiated material, of much higher quality, essentially reproduced the features observed for the spent fuel sam-ple. In addition to these peaks, some smaller structures at 315 and 475 cm−1can also be seen, whereas line fitting
procedures, always subjective in such a case, may suggest another apparent maxima, in particular at about 640 cm
−1. Figure 2 also shows the well‐known spectra of the
different ZrO2 polymorphs. Examination of the figure
suggests that particular maxima are peaking close to some expected features, characteristic of ZrO2
poly-morphs. Thus, the first maximum around 185 cm−1
may correspond to the low‐wavenumber doublet of the m‐ZrO2 structure, the second one around 260 cm−1 as
well as the 315 cm−1
shoulder to the t‐ZrO2 structure,
and the third one at about 615 cm−1coincides with the
expected most intense band of the c‐ZrO2 structure.
However, although three lines, more or less, match the positions expected for m‐ZrO2 and t‐ZrO2, or even
c‐ZrO2, as such, these spectra clearly do not correspond
to any known spectrum of a pure standard zirconia phase.[1,2,12–15] In particular, the last broad line at about 705 cm−1
does not correspond to any known zone‐centre Raman mode of a zirconia polymorph. The spectrum recorded for the m‐Zr18O2 ion‐irradiated material was
similar in shape. Again, line shifts due to 18O isotopic substitution will be discussed below.
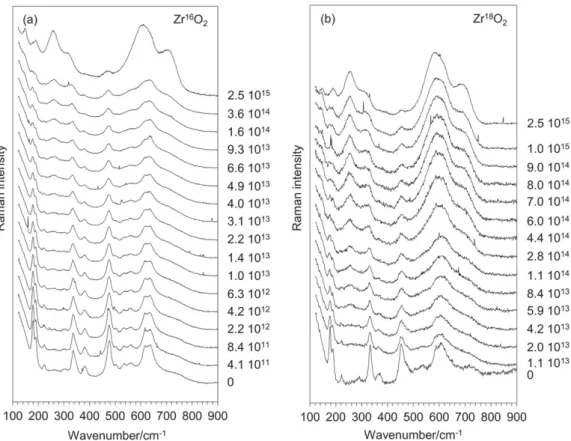
In situ monitoring of the spectra evolution during irradiation gave additional information. As described in the experimental part, both zirconia scales were irradi-ated with a 27 MeV Xe9+ion beam on the EPIMETHEE accelerator, using a flux of 1 × 10¹¹ ion cm−2 s−1 up to
a fluence of 2.5 × 10¹⁵ ion cm−2at the JANNuS Saclay
facility. Results obtained for the Zr16O2 sample already
described in the study of Ciszak et al.[2] are reported in Figure 3a for comparison. The results obtained on Zr18O2 sample confirm the main trends, again within
the exception of strong line shifts (Figure 3b). In both cases, the main evolution of the spectra is observed for fluences above ~ 1014/cm2. This evolution first suggests a decrease of the m‐ZrO2 lines and an increase of some
of the expected t‐ZrO2 lines. These intensity evolutions
versus the irradiation dose follow a sigmoid‐type law, as already observed from XRD data.[7] The diffraction pattern recorded after ion‐irradiation with a 1° incidence angle clearly evidenced the presence of t‐ZrO2with only a
minor content of m‐ZrO2: close to the sample surface, the
phase transition is almost complete, see Figure S1. In agreement with all available data, no sign of amorphisation was detectable. As expected, before
FIGURE 2 Raman spectra of m‐ZrO2, t‐ZrO2(Y‐stabilised), c‐
ZrO2(Y‐stabilised) references, PWR metal|oxide ZrO2from[1,2]and
Xe‐irradiated ZrO2[Colour figure can be viewed at
irradiation, the diffraction pattern was characteristic of the monoclinic phase, with a minor contribution of the tetragonal phase. This further suggests that the two max-ima observed at low wavenumber (185 and 206 cm−1)
may be interpreted as being characteristic of m‐ZrO2and
t‐ZrO2structures. On the other hand, this in situ
monitor-ing did not give more insight on the two broad lines observed at higher wavenumbers (615 and 705 cm−1).
In particular, the presence of the c‐ZrO2 structure
still cannot be excluded. From the figure, it is seen that both high wavenumber features tend to appear from the early beginning of the irradiation process and further gradually develop as the irradiation dose increases. Note also the high‐relative intensity of the high wavenumber part of the spectra, which is not usually seen in the t‐ZrO2spectra.
Cross‐sectional Raman analysis confirmed that this signal was more or less homogeneously seen throughout the thickness of the irradiated samples, even if slight var-iations were observable (Figure 4). First, a lower m‐ZrO2
content was found close to the sample surface, as judged from the intensity of the 185 cm−1broad line, whereas its
maximum intensity was found from and beyond the calculated maximum penetration depth of the incident Xe ions at about 4 μm. Diffraction patterns recorded for different incidence angles confirmed that trend, that is, a higher m‐ZrO2 content when the incidence angle was
increased from 1 to 10°, see Figure S2 and Figure S3. Second, slight variations of the line profile of the high wavenumber 615 and 705 cm−1 lines were observed in
the form of line shifts as well as line intensity ratio varia-tions. More in details, for the Zr16O2 sample, going
from the metal|oxide interface up to the surface, there is a small upshift of the 705 cm−1and a small downshift of
the 615 cm−1line. Deeper in the layer, a shoulder at about
570 cm−1is now clearly observable. In that last case, the
shape of the signal between 500 and 650 cm−1overlaps
almost perfectly with which is known for the c‐ZrO2.
3.2 | Excitations at different wavelengths
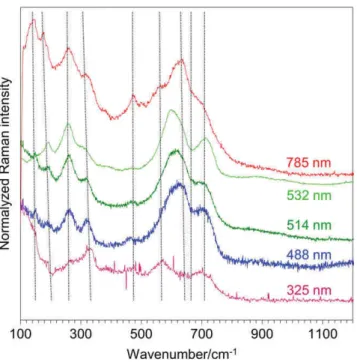
To ascertain the origin of all the observed features, a first and necessary step was to exclude the presence of some possible photoluminescence lines in this wavenumber range. Thus, spectra were recorded using different excita-tion wavelengths, from 325 up to 785 nm. Main trends are summarized in Figure 5. First, the comparison of the spectra excited at 488, 514, and 532 nm and the absence of any significant signal in the 500–600 nm range when excited at 488 nm convincingly show that this particular signal was due to light scattering.[2]Second, there is a clear change in the line shape of the spectrum using an
FIGURE 3 In situ Raman monitoring of ZrO2 scales irradiated with 27 MeV Xe9+. (a) Zr16O2 scale from.[1,2] (b) Zr18O2 scale.
Corresponding fluences are given in ion. cm−2next to their respective spectrum. In both cases, a strong evolution of the spectra is
excitation wavelength at 785 nm. In this last case, the spectrum was closer to the usual characteristics of t‐ZrO2, with a minor contribution of m‐ZrO2, in agreement
with the diffraction data. Again, a strong broadening of the
main residual m‐ZrO2and t‐ZrO2 lines, up twice as large
as compared with a reference Y‐doped t‐ZrO2 sample,
reveals the disorder induced by the irradiation process. Furthermore, from the line shape of this particular spec-trum, that is, the apparent maximum at about 615 cm−1
and a clear shoulder at about 560 cm−1, the presence of
c‐ZrO2 cannot be excluded. We give for information an
example of spectrum obtained at 325 nm. This spectrum was very difficult to get, requiring very long acquisition times, up to 3,600 s. On the contrary, UV‐excited spectra were readily obtained for the standard reference m‐ZrO2,
t‐ZrO2, and c‐ZrO2samples within short acquisition times.
In all cases, these spectra exhibited their expected charac-teristics. First, this is an indication of a strong optical absorption of the irradiated materials at the analysis wave-length, which also means that the UV excitation leads to a near‐surface analysis. This reflects a strong modification of the electronic properties of the irradiated‐ZrO2, normally
little absorbent in this wavenumber range. Second, this lack of signal is also an indication of a strong structural disorder at the sample surface.
3.3 | Excitations at different power
densities
Another information was extracted from the line shape evo-lution versus the excitation power density. Most probably
FIGURE 5 Raman spectra of the Xe‐irradiated Zr16O 2 layer
obtained for excitation wavelengths of 325, 488, 514, 532, and 785 nm (from bottom to top) [Colour figure can be viewed at wileyonlinelibrary.com]
FIGURE 4 Cross section Raman profiles obtained on Xe‐irradiated Zr16O
2(a) and Zr18O2(b) scales. Corresponding positions are given in
because the ion‐irradiated zirconia layer strongly absorbs vis-ible and UV wavelengths, an increase of the excitation power density immediately led to a strong local heating of the sam-ple. Within the exception of the 785 nm excitation, most of the measurements showed that the irradiated samples were unstable upon heating; the m‐ZrO2was systematically
recov-ered between 300 and 500°C, with kinetics that depended of the power density, that is, of the local temperature reached in the focused laser spot. In these experiments, the temperature was evaluated from the shift of the low frequency monoclinic lines and was therefore only a first rough estimate of the true sample temperature.[2]This was also an unexpected result while the t‐ZrO2stabilized either with aliovalent dopants or
small grain size is perfectly stable upon heating in this temperature range. Thus, this specific phase transition is not driven by macroscopic thermodynamic law, but rather by short‐range effects at the nanometric scales.
At this stage, it is difficult to comment in more details the evolution of spectra line shapes as a function of the excitation wavelength, which may be due to variation in probing depth and/or to particular resonant scattering events. However, the absence of a clear signal evolution when near‐IR excitation are used, that is, lower sample heating, if any, is an argument in favor of a significant change in probing depths with the excitation wavelength.
3.4 | Effects of the isotopic substitution
Considering the potential effects of irradiation, even if XRD did not evidence a strong sample amorphization, disorder considerations or static deformations of the zirconia lattice may be invoked for the understanding of those peculiar Raman signals. The translational disorder introduced by vacancies and/or interstitials atoms gener-ated by ion‐irradiation may obviously lead to a break-down of selection rules. First, loss of translational order may allow symmetry‐forbidden modes to be detected. Second, in the case of a strong disorder, the reduced Raman spectra ultimately represent the frequency distri-bution of the phonon density of states (VDOS). In the present case, the observed broad signal has an apparent cut‐off wavenumber at about 830 cm−1, which matches
the cut‐off frequencies of the m‐ZrO2, t‐ZrO2, and even
c‐ZrO2 polymorphs calculated VDOS.[26–30] Thus, it is
tempting to interpret these spectra in terms of disorder. To get further answer elements, characteristic spectra of the Zr16O2 and Zr18O2 scales were compared before
and after the irradiation process. As a matter of fact, phonon frequencies are directly affected by changes of the average mass of the whole crystal or its sub‐lattices, in a way that is usually described using the virtual crystal approximation (VCA), which implies that the force
constants do not depend on isotopic mass. The VCA approximation is usually introduced for a crystal contain-ing several isotopes in order to recover the translational invariance lifted by the isotopic disorder. Masses of these isotopes are simply replaced by their average weighted by their relative abundances. For a monoatomic lattice with atoms of an average mass μ in the harmonic approximation, any of the phonon frequencies, and not only the zone‐centre ones, simply depend on the inverse of the square root of the average mass μ−12, for all
wavevectors q.[31]In a lattice with different elements in the primitive cell, each element acts differently on the VCA frequencies, and this simple relation a priori does not hold for binary compounds; for which the changes of the phonon frequencies and atomic displacements with the mass of the constituent atoms are specific to each phonon branch and wave vector q. In contrast to elemental crystals, the mass dependence becomes q dependent.[31]Instead of phonon frequencies and disper-sions, for example, given by ab initio calculations, the displacement patterns, that is, the phonon eigenvectors, have received much less attention and are not generally known. Information about the corresponding phonon eigenvector can be obtained by measuring the phonon frequency shifts induced by the atom mass change if sam-ples with different isotopic compositions are available.
Thus, as a rule, the frequency of each line is expected to vary as μ−12
eff, where μeff is the effective mass of the
vibration. Again, a precise result interpretation requires a complete normal coordinate analysis to determine the effective masses for each mode. However, for our purpose, it is sufficient to make rough estimates based on limiting cases referring to the partial VDOS available from the literature.[26–29] In these partial VDOS and for all ZrO2 phases, the heavier metal‐dominated modes lie
in the low energy part of the VDOS, whereas the lighter oxygen atoms tend to dominate in the high energy part of the frequency spectrum, more or less schematically above ~ 400–450 cm−1, slightly depending on the specific
polymorph. Therefore, according to this first approxima-tion, in the high wavenumber range the shift induced by isotopic substitution of the Raman lines characteristic of all ZrO2phases should be estimated according to
ω!Zr18O2" ω!Zr16O2" e ffiffiffiffiffiffiffiffiffiffiffiffiffiffi μ!16O" μ!18O" s ; (1)
where μ(16O) and μ(18O) are the masses calculated in both samples using the actual atomic percentage of 16O
and18O in the samples and ω(Zr16O2) and ω(Zr18O2) the
corresponding mode frequencies. Here, the 0.2% natural abundance of18O can be neglected.
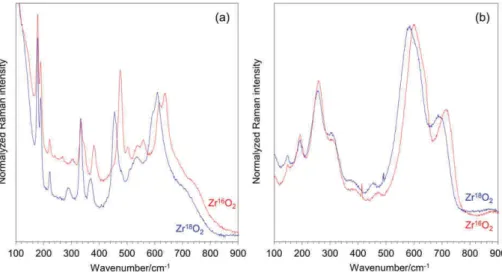
As expected, this is what is first seen in Figure 6a, the line shift of the six ZrO2zone center Raman modes above
400 cm−1 shift towards low wavenumbers in amounts
consistent with the square root of the mass ration16O to
18O, and consistently gave the 18O content of the gas
phase used for the oxidation (around 80%).[16,18] The seventh mode at 758 cm−1 is not clearly resolved here.
In agreement with previous studies,[16,18] only four zone‐centre modes, located at about 178, 191, 220, and 333 cm−1, are unaffected by isotopic substitution that
are close to pure Zr vibrations. Here, the 532 nm excita-tion was used.
Moreover, it is very clear that there is a continuous background of the spectrum superimposed on the Raman lines in the 400–830 cm−1range, which also exhibits an
apparent maximum above 700 cm−1 (Figure 6a). This
broad signal was already observed on zirconia thin layers thermally grown on zirconium alloys. It was attributed to a strong substoichiometry in the layers, due to the anionic growth process, which implies oxygen vacancy migration from the metal|oxide interface to the film surface.[20]Thus, the 400–900 cm−1range in the spectrum was fitted to a μ−12
law. As well as for zone‐centre modes, the whole high‐ frequency part of the spectrum may be scaled with the mass law given in Equation 1: with the “mass correction” of the frequency scale, the two spectra are superimposed, see Figure S4. Again, the fit reasonably well agrees to esti-mate the18O average content of sample around 80%. As
more or less expected from the examination of the partial VDOS, this dependence on the isotopic composition con-firmed the vibrational origin of the modes involved in this frequency range, mostly relevant to pure O vibrations.
After irradiation, the overall observation was quite similar (Figure 6b). The high‐wavenumber part of the spectrum was found to depend on the isotopic
composition, and could be consistently scaled with a sim-ilar, O‐dominated, mass law. However, the 18O content extracted from the fitting process gave a concentration significantly lower than that expected around 65% instead of 80%. Among other reasons, a small contribu-tion from the Zr atoms mocontribu-tion may explain this discrep-ancy, even if the modes remain dominated by the motion of O atoms. Tuning the excitation wavelength to 785 nm confirmed this trend. Again, the high‐frequency part of the spectrum was found to depend on the isotopic composition. Scaling the spectra also gave a value close to 65%.
Thus, isotopic substitution unambiguously reveals phononic contributions to the Raman spectrum; all the Raman contributions having wavenumber higher than 400 cm−1
mainly correspond to O‐related vibrations.
4 | D I S C U S S I O N
As described throughout this paper, a peculiar Raman signature, mostly composed of four apparent broad signals peaking approximately at 185, 260, 615 and 705 cm−1
, was observed for ion‐irradiated zirconia layers thermally‐grown on Zircaloy‐4 substrates. A similar signature was observed for spent fuel materials, close to the inner and outer metal|oxide interfaces.
The evolution of the spectra with the excitation wave-length and the effects of O isotopic substitution show unambiguously that the peculiar ZrO2 signals described
here are of vibrational origin. As they were observed for various implanted elements, any chemical interference between incident ions and target atoms can be ruled out. Moreover, they were consistently observed for differ-ent zirconium alloys, Zircaloy‐4 and M5.[12] This means
FIGURE 6 Raman spectra of the virgin Zr16O2(red trace) and Zr18O2layers (blue trace) (a) and Xe‐irradiated Zr16O2(red trace) and Zr18O2
that the effect of the alloying elements is weak, if any. As a consequence of the irradiation process, we can discuss this particular signal in terms of structural disorder. XRD results help to precise the “location” of this struc-tural disorder in terms of anionic and cationic sublattices. Indeed, in the case of ZrO2, the high X‐ray scattering
factor of Zr versus O leads the diffraction pattern to be mainly representative of the Zr sublattice structure. Unlike Raman spectra, clear diffraction patterns were obtained before and after ion irradiation. Therefore, it is likely that the induced structural disorder mainly affects the O sublattice.
A first manifestation of such a disorder was a clear broadening of the observed Raman lines after the irradia-tion process. However, the in situ spectra evoluirradia-tion dur-ing the irradiation suggested that the first two broad bands at ~ 85 and 260 cm−1 likely correspond to
unre-solved zone‐centre, low frequency lines characteristic of m‐ZrO2 and t‐ZrO2. The attribution of the third line is
more uncertain insofar as it can correspond to broadened characteristic modes of the three polymorphs. The coexis-tence of the three ZrO2 polymorphs would explain the
small variations of its profile during the analysis of the cross‐sections. From the line shape of this particular line, the presence of c‐ZrO2cannot be excluded.
The second manifestation of this disorder is the additional features appearance in the spectra, in particu-lar above 700 cm−1. This supplementary signal is
par-tially seen before irradiation, but is clearly resolved at the end of the irradiation process. In this frequency range, the modes remain dominated by the motion of O atoms. At this point, two different interpretations may be offered.
On one hand, the observed additional features simply reflect a strong translational disorder in the O sublattice. It may be interpreted as disorder/defect‐induced vibra-tional modes, normally symmetry‐forbidden, which can become Raman active through a loss of symmetry because of a breakdown in the selection rules. This expla-nation may also hold, at least partially, for the 615 cm−1
broad line. A similar signal, observable as a shoulder, was identified for the layers before irradiation superimposed on the usual m‐ZrO2characteristic Raman
spectrum. For a further analysis of these signals, refer-ence may be made to the calculated VDOS. Maxima in the 600–710 cm−1range are effectively found in the
calcu-lated oxygen partial VDOS of both m‐ZrO2, t‐ZrO2, and
even c‐ZrO2 at ~ 700 and 730 cm−1 (m‐ZrO2), 615 and
700 cm−1
(t‐ZrO2), and 640 cm−1(c‐ZrO2). Thus, if this
hypothesis in terms of VDOS arguments is correct, the observation of this broad signal should reflect a strong disorder within the O sublattice, due to O vacancies in the case of the thermally grown scales or to ballistic
disorder in the case of the irradiated scales. Note that a similar shoulder at about 700 cm−1 is found on the
Raman spectra of stabilized c‐ZrO2, whereas its Raman
spectrum is in part interpreted in terms of VDOS. In this last case, disorder in the O sublattice due to a high amount of O vacancies was also mentioned as the origin of such a broad signal.[32]
On the other hand, a model in which a substantial fraction of the O atoms are located in nonideal sites, giving rise to additional local vibrational modes cannot be excluded.
From our data, it is still not straightforward to explain the variability of the data available in the literature. In particular, this signal type has been seen on layers ther-mally grown on zirconium alloys and not on irradiated ceramics for which “conventional” t‐ZrO2 signals were
unambiguously recorded after irradiation, without any clear indication of a strong disorder in their spectra. Up to now, bulk ZrO2 exhibited no evidence of irradiation‐
induced amorphization at very high doses. The material did not demonstrate a tendency towards amorphization, even in the most extreme irradiation conditions. However, at the smallest grain sizes, it was shown that radiation damage effects can be strongly enhanced.[33] In this paper, irradiation with 1.0 MeV Xe2+ ions of ~ 3 nm diameter ZrO2 nanocrystals of tetragonal
struc-ture first led to a transition to the cubic strucstruc-ture and then to an amorphous state at the highest doses. Here, in the same way, it is perhaps possible to invoke the char-acteristic small grain size, in the 10–50 nm range of the thermally‐grown oxidation layers, the presence of a high density of grain boundaries and their inherent substoichiometry,[23] which may amplify this disorder effect. At present, this size‐related effect cannot be ruled out. This opens the way to many complementary studies, TEM measurements in particular.
5 | S U M M A R Y
A peculiar Raman signature mostly composed of four apparent broad signals peaking approximately at about 185, 260, 615, and 705 cm−1
was observed for ion‐ irradiated zirconia layers thermally‐grown on Zircaloy‐4 substrates. A similar signature was observed for spent fuel materials close to the inner and outer metal|oxide inter-faces. To reproduce those Raman spectra, thermally grown zirconia layers were irradiated with a 27 MeV Xe9+ ion beam up to a fluence of 2.5 × 10¹⁵ ion cm−2.
After irradiation, as already widely reported, XRD indi-cated a quasicomplete m‐ZrO2to t‐ZrO2phase transition.
The evolution of the spectra with the excitation wave-length and the effects of O isotopic substitution show
unambiguously that the peculiar ZrO2 signals described here are of vibrational origin. The first two broad bands at ~ 185 and 260 cm−1 likely tracks the presence of
m‐ZrO2 and t‐ZrO2. From the line shape of the third
band, the presence of c‐ZrO2in the irradiated layers
can-not be excluded. The last feature peaking at ~ 710 cm−1is
likely a disorder/defect induced band, normally symmetry‐forbidden, which can become Raman‐active through a loss of symmetry due to the breakdown in the selection rules. This explanation may also hold, at least partially, for the 615 cm−1line. However, a model
where a substantial fraction of the O atoms is located in nonideal sites, giving rise to additional local vibrational modes, cannot be excluded. To date, this peculiar signal seems to be essentially observed for oxidation layers, one of whose characteristics is their small grain size. Thus, we could suppose that this low grain size, along with the presence of a high density of grain boundaries and their inherent sub‐stoichiometry, may amplify this disorder effect.
A C K N O W L E D G E M E N T S
EDF and Framatome are acknowledged for their techni-cal and financial support. The authors would also like to thank Eric BORDAS for his technical support at the JANNuS Saclay facility. Likewise, the authors would like to thank Alexandre CRISCI (SIMAP, Grenoble, France) for technical support during some of the Raman experi-ments and special attention for this work.
O R C I D
Clément Ciszak http://orcid.org/0000-0003-4097-1015
R E F E R E N C E S
[1] C. Ciszak, Etude de l'accrochage pastille/gaine des crayons combustibles des réacteurs à eau pressurisée, PhD, Université de Bourgogne Franche‐Comté, Dijon, France 2017.
[2] C. Ciszak, M. Mermoux, S. Miro, G. Gutierrez, F. Lepretre, I. Popa, K. Hanifi, I. Zacharie‐Aubrun, L. Fayette, S. Chevalier, J. Nucl. Mater.2017, 495, 392.
[3] D. Simeone, J. L. Bechade, D. Gosset, A. Chevarier, P. Daniel, H. Pilliaire, G. Baldinozzi, J. Nucl. Mater. 2000, 281, 171. [4] A. Benyagoub, F. Levesque, F. Couvreur, C. Gibert‐Mougel, C.
Dufour, E. Paumier, Appl. Phys. Lett. 2000, 77, 3197.
[5] J.‐M. Costantini, A. Kahn‐Harari, F. Beuneu, F. Couvreur, J. Appl. Phys.2006, 99, 123501.
[6] B. Schuster, F. Fujara, B. Merk, R. Neumann, T. Seidl, C. Trautmann, Nucl. Instrum. Methods Phys. Res. Sect. B beam interact. Mater. At.2012, 277, 45.
[7] C. Gibert‐Mougel, F. Couvreur, J. M. Costantini, S. Bouffard, F. Levesque, S. Hémon, E. Paumier, C. Dufour, J. Nucl. Mater. 2001, 295, 121.
[8] D. Simeone, D. Gosset, J. L. Bechade, A. Chevarier, J. Nucl. Mater.2002, 300, 27.
[9] D. Simeone, G. Baldinozzi, D. Gosset, S. LeCaër, L. Mazerolles, Phys. Rev. B2004, 70, 134116.
[10] B. Schuster, M. Lang, R. Klein, C. Trautmann, R. Neumann, A. Benyagoub, Nucl. Instrum. Methods Phys. Res. Sect. B beam interact. Mater. At.2009, 267, 964.
[11] A. Sharma, M. Varshney, H.‐J. Shin, Y. Kumar, S. Gautam, K. H. Chae, Chem. Phys. Lett. 2014, 592, 85.
[12] R. Verlet, Influence de l'irradiation et de la radiolyse sur la vitesse et les mécanismes de corrosion des alliages de zirconium, PhD, EMSE, Saint‐Etienne, France 2015.
[13] S. Miro, E. Bordas, L. Thomé, J.‐M. Costantini, F. Leprêtre, P. Trocellier, Y. Serruys, L. Beck, D. Gosset, R. Verlet, J. Huguet‐Garcia, M. Tupin, M. Belleil, J. Raman Spectrosc. 2016, 47, 476.
[14] R. Verlet, M. Tupin, G. Baldacchino, K. Wolski, S. Miro, D. Gosset, K. Colas, M. Jublot, F. Jomard, Corros. Sci. 2015, 98, 327. [15] J. A. Valdez, Z. Chi, K. E. Sickafus, J. Nucl. Mater. 2008, 381, 259. [16] B.‐K. Kim, H. Hamaguchi, Phys. Status Solidi B 1997, 203, 557. [17] D. A. Daramola, M. Muthuvel, G. G. Botte, J. Phys. Chem. B
2010, 114, 9323.
[18] M. Guerain, M. Mermoux, C. Duriez, Corros. Sci. 2015, 98, 140. [19] A. Kasperski, M. Guérain, M. Mermoux, F. Jomard, Oxid. Met.
2017, 87, 501.
[20] A. Kasperski, C. Duriez, M. Mermoux, Zircon. Nucl. Ind. 18th Int. Symp.2018.
[21] S. Chevalier, G. Strehl, J. Favergeon, F. Desserrey, S. Weber, O. Heintz, G. Borchardt, J. P. Larpin, Mater. High Temp. 2003, 20, 253.
[22] S. Chevalier, J. Favergeon (Eds), French Activity on High Tem-perature Corrosion in Water Vapor, Trans Tech Publ, Durnten‐Zurich 2014.
[23] A. Motta, A. Yilmazbayhan, R. Comstock, J. Partezana, G. Sabol, B. Lai, Z. Cai, J. ASTM Int. 2005, 2, 12375.
[24] P. Barberis, T. Merle‐Méjean, P. Quintard, J. Nucl. Mater. 1997, 246, 232.
[25] I. Idarraga, M. Mermoux, C. Duriez, A. Crisci, J. P. Mardon, J. Nucl. Mater.2012, 421, 160.
[26] X. Zhao, D. Vanderbilt, Phys. Rev. B 2002, 65, 075105. [27] M. Sternik, K. Parlinski, J. Chem. Phys. 2005, 122, 064707. [28] A. Kuwabara, T. Tohei, T. Yamamoto, I. Tanaka, Phys. Rev. B
2005, 71, 064301.
[29] C. W. Li, H. L. Smith, T. Lan, J. L. Niedziela, J. A. Muñoz, J. B. Keith, L. Mauger, D. L. Abernathy, B. Fultz, Phys. Rev. B 2015, 91, 144302.
[30] G. Wang, G. Luo, Y. L. Soo, R. F. Sabirianov, H.‐J. Lin, W.‐N. Mei, F. Namavar, C. L. Cheung, Phys. Chem. Chem. Phys. 2011, 13, 19517.
[32] A. Feinberg, C. H. Perry, J. Phys. Chem. Solids 1981, 42, 513. [33] A. Meldrum, L. A. Boatner, R. C. Ewing, Phys. Rev. Lett. 2001,
88, 025503.
S U P P O R T I N G I N F O R M A T I O N
Additional supporting information may be found online in the Supporting Information section at the end of the article.
How to cite this article: Ciszak C, Mermoux M, Gutierrez G, et al. Raman spectra analysis of ZrO2
thermally grown on Zircaloy substrates irradiated with heavy ion: Effects of oxygen isotopic substitution. J Raman Spectrosc. 2019;50:425–435.