HAL Id: hal-03030829
https://hal.archives-ouvertes.fr/hal-03030829
Submitted on 30 Nov 2020HAL is a multi-disciplinary open access
archive for the deposit and dissemination of sci-entific research documents, whether they are pub-lished or not. The documents may come from teaching and research institutions in France or abroad, or from public or private research centers.
L’archive ouverte pluridisciplinaire HAL, est destinée au dépôt et à la diffusion de documents scientifiques de niveau recherche, publiés ou non, émanant des établissements d’enseignement et de recherche français ou étrangers, des laboratoires publics ou privés.
Eomes-Dependent Loss of the Co-activating Receptor
CD226 Restrains CD8+ T Cell Anti-tumor Functions
and Limits the Efficacy of Cancer Immunotherapy
Marianne Weulersse, Assia Asrir, Andrea Pichler, Lea Lemaitre, Matthias
Braun, Nadège Carrié, Marie-Véronique Joubert, Marie Le Moine, Laura Do
Souto, Guillaume Gaud, et al.
To cite this version:
Marianne Weulersse, Assia Asrir, Andrea Pichler, Lea Lemaitre, Matthias Braun, et al.. Eomes-Dependent Loss of the Co-activating Receptor CD226 Restrains CD8+ T Cell Anti-tumor Func-tions and Limits the Efficacy of Cancer Immunotherapy. Immunity, 2020, 53 (4), pp.824-839.e10. �10.1016/j.immuni.2020.09.006�. �hal-03030829�
Eomes-dependent loss of the co-activating receptor CD226 restrains CD8+ T cell anti-tumor functions and limits the efficacy of cancer Immunotherapy
Marianne Weulersse1,8,Assia Asrir1,8, Andrea C Pichler1,8, Lea Lemaitre1, Matthias Braun2,
Nadège Carrié1, Marie-Véronique Joubert1,3, Marie Le Moine4, Laura Do Souto1,3, Guillaume
Gaud5, Indrajit Das2, Elisa Brauns4, Clara M. Scarlata1,3, Elena Morandi5, Ashmitha
Sundarrajan2, Marine Cuisinier1,3, Laure Buisson1,3, Sabrina Maheo1,3, Sahar Kassem1, Arantxa
Agesta5, Michaël Pérès1,3, Els Verhoeyen6,7, Alejandra Martinez1,3, Julien Mazière1,3, Loic
Dupré5, Camille Guillerey2, Maha Ayyoub1,3, Anne Dejean5, Abdelhadi Saoudi5, Stanislas
Goriely4, Hervé Avet-Loiseau1,3, Tobias Bald2 , Mark J. Smyth2 and Ludovic Martinet1,3*. 1Cancer Research Center of Toulouse (CRCT), Institut National de la Santé et de la Recherche Médicale
(INSERM) UMR 1037, Centre National de la Recherche Scientifique (CNRS), Université Paul Sabatier (UPS), Toulouse, France.
2QIMR Berghofer Medical Research Institute, Herston, Queensland, Australia. 3Institut Universitaire du Cancer, CHU Toulouse, Toulouse France.
4Université Libre de Bruxelles, Institute for Medical Immunology (IMI), Gosselies, 6041 Belgium and UCR-I (ULB
Centre for Research in Immunology)
5Centre de physiopathologie de Toulouse Purpan (CPTP), Institut National de la Santé et de la Recherche
Médicale (INSERM) UMR 1043, Centre National de la Recherche Scientifique (CNRS) UMR 5282, Université Paul Sabatier (UPS), Toulouse, France.
6Université Côte d’Azur, INSERM, C3M, Nice, France.
7CIRI, Université de Lyon, INSERM U1111, ENS de Lyon, CNRS UMR 5308, Lyon, France 8These authors contributed equally
*Lead contact
Full correspondence
Lead contact: Dr Ludovic Martinet, INSERM UMR 1037, Cancer Research Center of Toulouse, 2 av Hubert Curien, 31037 Toulouse, France. E-mail address: ludovic.martinet@inserm.fr; Phone: +33-5-8274-1757
8 Figures, 8 Supplementary Figures, 96 References.
Key words: CD8+ T lymphocytes, TCR signaling, Co-stimulation, CD226 (DNAM-1), tumor
IN BRIEF
Through complementary approaches, involving cancer patients’ samples and relevant mouse tumor models, this study reveals that the Eomes-dependent loss of the activating receptor CD226 (DNAM-1) represents a critical determinant of tumor infiltrating CD8+ T cell dysfunction
potentially affecting immune checkpoint blockade efficacy. GRAPHICAL ABSTRACT
HIGHLIGHTS
• The absence of CD226 impedes TCR signaling and effector program of CD8+ T cells.
• Dysfunctional CD226-negative CD8+ T cells accumulate in tumors.
• Tumor-induced CD226-loss depends on Eomes transcription factor. • CD226 loss limits CD8+ T cell response to Immune checkpoint blockade.
ABSTRACT
Although anti-PD-1 and anti-CTLA-4 based immune checkpoint blockade (ICB) has represented a turning point in cancer care, clinical responses are observed only in a fraction of cancer patients. Most research focuses on the identification of additional inhibitory receptors restraining the anti-tumor functions of CD8+ T cells. By contrast, herein, we found that loss of
the activating receptor CD226 (DNAM-1) was a critical mechanism affecting CD8+ T cell
responsiveness to TCR stimulation. Using cancer patients’ samples and preclinical mouse models, we discovered that dysfunctional CD226-negative CD8+ T cells progressively
accumulated in the tumor microenvironment through a mechanism involving the T-box transcription factor Eomesodermin (EOMES). More importantly, we demonstrated that CD226-negative tumor infiltrating lymphocytes had reduced anti-tumor functions and failed to respond to ICB. Altogether, our results revealed that CD226 loss is a critical immune escape mechanism restraining CD8+ T cell function and potentially affecting the therapeutic efficacy
INTRODUCTION
CD8+ T lymphocytes play a critical role in limiting tumor progression and represent the most
promising therapeutic host immune target against cancer (Schumacher and Schreiber, 2015). CD8+ T cell activation is mainly triggered by TCR recognition of MHC-I-peptide complexes but
additional signals provided through a wide array of stimulatory and inhibitory molecules critically influence CD8+ T cell anti-tumor functions (Chen and Flies, 2013). In the past decade,
an extensive number of studies demonstrated the key role played by inhibitory receptors such as PD-1 (CD279) and CTLA-4 (CD152) in driving a state of CD8+ T cell hypo-responsiveness
called T cell exhaustion, frequently observed in chronic viral infections and cancer (Wherry and Kurachi, 2015). Some previous striking clinical results achieved with monoclonal antibodies (mAbs) blocking these receptors in metastatic melanoma illustrated the therapeutic promise of targeting inhibitory receptors to restore cytotoxic lymphocyte anti-tumor reactivity (Robert et al., 2011; Topalian et al., 2012). Still, clinical responses are observed only in a fraction of cancer patients treated with Immune checkpoint blockers (ICB). While most of the experimental strategies actually focus on the identification of additional inhibitory receptors restraining anti-tumor reactivity of CD8+ T cells, the importance of
activating receptors with regards to anti-tumor CD8+ T cell functions and ICB efficacy remains
to be better understood.
CD226 (DNAM-1, PTA-1, TLiSA1) is an adhesion molecule initially described for its ability to stimulate NK cell- and CD8+ T cell-mediated cytotoxicity (Martinet and Smyth, 2015; Shibuya
et al., 1996). Its ligands, the nectin and nectin-like receptors CD112 and CD155, are often expressed on cancer cells as a consequence of cellular stress (Chan et al., 2014b) and CD226 deficiency was shown to reduce tumor immunosurveillance in a wide number of solid and lymphoid tumor mouse models (Chan et al., 2014a; Gilfillan et al., 2008; Guillerey et al., 2015; Iguchi-Manaka et al., 2008; Tahara-Hanaoka et al., 2006). TIGIT (T cell immunoreceptor with Ig and ITIM domains) and CD96, two inhibitory receptors that compete with CD226 for the same ligands, were recently identified as promising immunotherapeutic targets to restore immune reactivity against tumors (Blake et al., 2016a; Blake et al., 2016b; Chan et al., 2014a; Guillerey et al., 2018; Kurtulus et al., 2015) highlighting the importance of the CD226 axis in the regulation of anti-tumor immune responses. The CD226 pathway may also represent an important determinant of ICB efficacy as evidenced by a recent study demonstrating that the
PD-1/PD-L1 pathway is a negative regulator of CD226 signaling and that PD-1 and GITR (glucocorticoid-induced tumor necrosis factor receptor-related protein) dual blockade fail to promote mouse tumor regression in the absence of CD226 (Wang et al., 2018).
Despite the critical role of CD226 in the T cell-dependent control of malignancies, the underlying mechanisms remain to be further addressed. Indeed, besides the ability of CD226 to regulate target cell adhesion and killing, there is now accumulating evidence indicating that this molecule may influence additional aspects of T cell biology such as terminal maturation of CD8+ thymocytes (Danisch et al., 2013; Qiu et al., 2010), T helper cell differentiation (Gaud
et al., 2018; Lozano et al., 2012; Lozano et al., 2013; Shibuya et al., 2003) and Treg suppressive functions (Koyama et al., 2013). In addition, although recent evidence suggests that CD226 contains an intracellular signaling domain that closely resembles CD28 (Zhang et al., 2015), the importance of this molecule in TCR activation remains poorly understood. In this study, we demonstrate, using complementary set of experiments involving human samples and mouse tumor models, that the absence of CD226 identifies a subset of CD8+ T cells with
severely impaired effector functions that accumulates in the tumor microenvironment through an Eomes-dependent mechanism. More importantly, we found that CD226-negative tumor infiltrating lymphocytes have altered TCR signaling, reduced anti-tumor functions and fail to respond to anti-PD-1 immunotherapy. Altogether, our results reveal a yet unappreciated mechanism restraining CD8+ T cell functions and ICB efficacy initiated by the
RESULTS
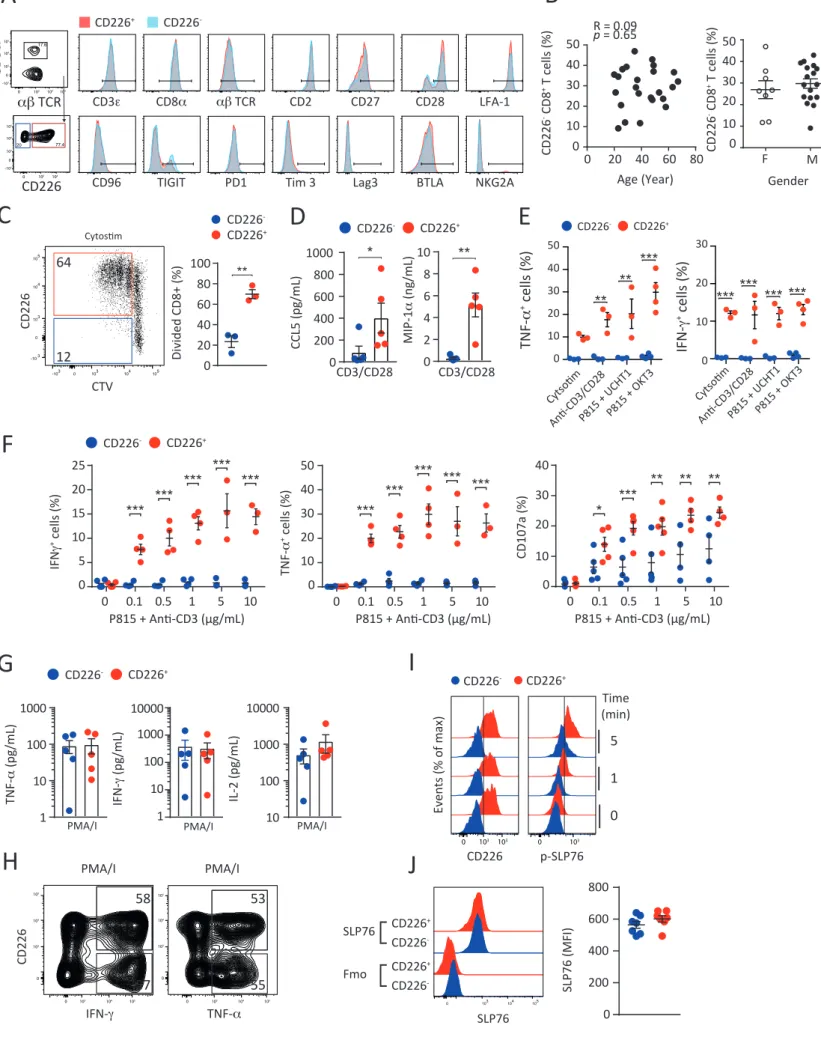
The absence of CD226 expression identifies hypo-reactive human CD8+ T cells.
Despite the importance of the CD226 pathway in cancer immunosurveillance and its emerging role in autoimmune disorders and infections (Martinet et al., 2015; Martinet and Smyth, 2015), little information was available regarding the expression of this receptor on human CD8+ T cells. Interestingly, we observed in the peripheral blood of healthy donors (HD) the
presence of two distinct CD8+ T cell populations based on CD226 expression (Figure 1A).
CD226- and CD226+ CD8+ T cell populations expressed comparable levels of most classical CD8+
T cell markers (Figure S1A) and had similar TCR V beta repertoires (Figure 1B). These subsets were also similarly present across the different CD8+ T cell maturation stages including naïve
(Tn, CD62L+CD45RA+); central memory (Tcm, CD62L+CD45RA-); effector memory (Tem, CD62L
-CD45RA-); terminal effector memory (Temra, CD62L-CD45RA+) (Figure 1C) and their frequency
was independent of the age and gender of the different donors analyzed (Figure S1B). The contrasting expression of CD226 on CD8+ T cells with identical phenotype and maturation
questioned about the potential functions of these two subsets. To exclude any analytic bias inherent to mixed CD8+ T maturation stages, we first separated CD226- and CD226+ CD8+ Tn,
Tcm and Tem subsets by flow cytometry. Analysis of TCR-induced proliferation using anti-CD2/CD3/CD28 microbeads revealed that CD226- CD8+ T cells had strikingly lower
proliferation capacities than CD226+ CD8+ T cells regardless of the differentiation stage (Figure
1D). Lower CD226- CD8+ T cell proliferation was confirmed in unsorted CD8+ T cell cultures
stimulated with more physiological stimuli such as allogeneic monocyte-derived dendritic cells, CMVpp65 peptide pools or TCR-MHCI crosslinking reagent CytoStim (Figure 1E and
Figure S1C). CD226- CD8+ Tems also produced a considerably lower amount of IL-2, IFN-g,
TNF-a, GM-CSF, CCL5 and MIP-1a than CD8+ CD226+ Tems upon TCR stimulation (Figure 1F and Figure S1D). Similar results were obtained when we assessed the intracellular production of IFN-g, TNF-a, or CD107a degranulation marker by CD226- and CD226+ CD8+ T cells upon
stimulation with diverse TCR stimuli including CytoStim, anti-CD2/CD3/CD28 microbeads or FcgR+ P815 cell line coated with increasing concentrations of anti-CD3 mAbs (Figure 1G and
Figure S1E-F). By contrast, CD226- and CD226+ CD8+ T cells had comparable cytokine
production upon stimulation with PMA/ionomycin (Figure S1G-H) suggesting that both CD226- and CD226+ CD8+ T cells have similar intrinsic functional capacities. Altogether, these
including defective proliferation, cytokine secretion and degranulation in response to TCR stimulation.
These data suggested that CD8+ T cells lacking CD226 may have an altered TCR signaling. To
test this hypothesis, we first monitored the influx of intracellular Ca2+ in CD226- and CD226+
CD8+ T cells, a key event in TCR signaling cascade. We observed that Ca2+ influx triggered by
anti-CD3 stimulation was reduced in CD226- CD8+ T cells as compared to CD226+ CD8+ T cells
(Figure 1H). In concert, we found that proteins implicated in proximal TCR signaling such as SLP76, ZAP70 and LAT were less phosphorylated in purified CD226- CD8+ Tems as compared
to CD226+ cells upon CD3 stimulation (Figure 1I-J and Figure S1I). Lower phosphorylation of
key TCR downstream signaling proteins, such as mitogen-activated protein kinases ERK1/2 and the PI3K target Akt, was also observed after anti-CD3 stimulation in sorted CD226- CD8+ Tems
as compared to CD226+ CD8+ Tems (Figure 1K). Altogether, these results establish that the
absence of CD226in healthy individualsidentifies a subset of CD8+ T cells with reduced TCR
signaling.
The absence of CD226 alters the TCR-induced CD8+ T cell transcriptional program.
To better understand the molecular differences between CD226- and CD226+ CD8+ T cells, we
performed a global transcriptional analysis of purified CD226+ and CD226- CD8+ Tems before
and after TCR activation using next generation RNA sequencing. To our surprise, resting CD226- and CD226+ CD8+ Tems displayed relatively similar gene expression profiles with only
76 genes differentially expressed (fold change >2; Adjp <0.01) (Figure 2A-D). Of note, CD226 was the most differentially expressed gene between CD226- and CD226+ CD8+ T cells (fold change = 55 Adjp = 4.5x10-50) (Figure 2C). Similar results were obtained comparing
transcriptomic profiles of resting Tn, Tcm and Temra CD226- and CD226+ CD8+ T cell subsets
(Figure S2A-B) thus indicating that CD226 absence on CD8+ T cells was not only due to
ligand-induced protein internalization as shown by Braun et al. but rather resulted from transcriptional regulation of this gene. Although functional analysis suggested that CD226-
CD8+ T cells were hypo-responsive to TCR stimulation, our global transcriptional analysis
revealed that both CD226- and CD226+ CD8+ Tems displayed signs of activation upon
anti-CD2/CD3/CD28 stimulation with respectively 5850 and 6577 genes differentially expressed between the resting and activation states (fold change > 2 ; Adjp <0.01) (Figure 2A-B). Still,
differences between anti-CD2/CD3/CD28 activated CD226+ and CD226- CD8+ Tems with 1209
up-regulated and 880 down-regulated genes (fold change > 2 ; Adjp <0.01) between both subsets (Figure 2 A-D and Figure S2C). In line with our previous findings (Figure 1), GSEA and Go term analysis confirmed that activated CD226+ CD8+ Tem specific genes were enriched in
gene signatures related to cell cycle, protein synthesis, TCR activation, TH1 differentiation and
IL-2/IL-15 signaling (Figure 2E-F and Figure S2D). Conversely, activated CD226- CD8+ Tem
specific genes were enriched in gene signatures related to resting T cells, regulatory T cells and TGF-b signaling (Figure 2E-F and Figure S2D) thus validating at the transcriptional level the functional advantage of CD226+ over CD226- CD8+ T cells upon TCR stimulation.
Mechanisms underlying CD226- CD8+ T cell hypo-responsiveness.
To establish the link between CD226 expression and TCR induced effector program of CD8+ T
cells, we transduced purified CD226- and CD226+ CD8+ Tems with GFP lentiviral vector
encoding or not for CD226 and analyzed their effector functions in response to TCR stimulation. Consistent with our previous results, we found that CD226- CD8+ Tems cells,
transduced or not with GFP control vectors, had a reduced ability to proliferate, to produce pro-inflammatory cytokines such as IFN-γ, TNF-α and poorly expressed the CD107a degranulation marker in response to TCR stimulation as compared to CD226+ CD8+ T cells
(Figure 3A-B and Figure S3A-B). By contrast, CD226- CD8+ Tems that ectopically expressed
CD226 (GFP+ cells) underwent several cell divisions and produced significantly higher levels of
IFN-γ, TNF-α and CD107a than cells that were not transduced or transduced with a GFP control vector (Figure 3A-B and Figure S3A-B). Altogether, these results highlight the implication of of CD226 loss in the functional impairment of CD8+ T cells in response to TCR stimulation.
We next investigated the molecular mechanisms underlying CD226- CD8+ T cell functional
defects. Given the importance of LFA-1 in T cell adhesion and TCR signaling (Bachmann et al., 1997; Dustin and Springer, 1989) and the tight link between this integrin and CD226 signaling (Shibuya et al., 1999; Shibuya et al., 2003), we hypothesized that CD226 absence might directly impact LFA-1 functions. LFA-1 is maintained in an inactive bent conformation on resting T lymphocytes and its extension and head-opening is required to increase LFA-1 affinity and binding to ICAM-1 (Comrie et al., 2015). These conformational changes of LFA-1 that expose different epitopes were thus evaluated on CD226- and CD226+ CD8+ T cells. We found that
activation state (Figure S3C-D). By, contrast, CD226+ CD8+ T cells expressed significantly higher
levels of “extended open” high affinity LFA-1 than their CD226- counterparts both in steady
state conditions and upon TCR stimulation (Figure 3C and Figure S3C-D). These results were further confirmed by confocal microscopy imaging that also revealed important co-localization between CD226 and high affinity LFA-1 at the cellular interface between anti-CD3 activated CD8+T cells (Figure 3D-E). To directly establish a link between CD226 expression
and LFA_1 activation, we analyzed the TCR induced activation of LFA-1 by CD226- and CD226+
CD8+ T cells that were transduced with GFP lentiviral vector encoding or not for CD226 (Figure
3F). We found that CD226- CD8+ T cells transduced with CD226 lentiviral vectors had a
significantly higher expression of LFA-1 open conformation as compared to CD226- CD8+ T cells
transduced with GFP control vectors (Figure 3F). To investiagte the importance of LFA-1 in CD226+ TCR-induced functions, we analyzed cytokine production by CD226+ and CD226- CD8+
T cells in the presence of blocking antibodies or pharmacological inhibitors of LFA-1 (Figure 3G and Figure S3F). Consistent with the well documented role of LFA-1 in efficient TCR signaling (Bianchi et al., 2000; Perez et al., 2003), we found that inhibiting LFA-1 significantly decreased the proliferation and the production of IFN-g and TNF-a by CD226+ CD8+ Tems
(Figure 3G and Figure S3F). Altogether these results imply that alteration in LFA-1 signaling due to CD226 loss might be involved in CD226- CD8+ T cell dysfunction.
By contrast, we provided several evidences showing that CD226 negative regulators, CD96, TIGIT or PVRIG (CD112R) (Chan et al., 2014a; Johnston et al., 2014; Zhu et al., 2016), may not directly account for CD226- CD8+ T cell hypo-responsiveness. First, CD96 or TIGIT blockade did
not restore TCR-induced proliferation nor IFN-g secretion by CD226- CD8+ T cells (Figure
S3G-H) and PVRIG transcripts were almost undetectable on purified CD226+ and CD226- CD8+ T
cells (Figure S3I). Second, CD226+ Tems had significantly higher proliferation than their CD226
-counterparts upon anti-CD2/CD3/CD28 microbeads stimulation regardless of TIGIT expression (Figure S3J). Finally, their common ligands CD112 and CD155 were hardly detectable at the mRNA level in purified CD8+ T cells (Figure S3I) and CD112 and CD155 in vitro blockade did not
reduce CD226+ CD8+ T cell functions induced by TCR stimulation (Figure S3G-H). This also
implies that CD226 may act independently of its ligands as evidenced by pioneer studies from
CD226absence identifiesdysfunctional human CD8+ tumor infiltrating lymphocytes.
We next addressed the importance of CD226 expression in the tumor context. We first compared CD226 expression on bone marrow (BM) CD8+ isolated from HD and patients newly
diagnosed with multiple myeloma (MM; IFM 2009 (Attal et al., 2017)), a frequent yet incurable hematological malignancy (Figure S4A). We found that the percentage of BM CD8+ T cells
lacking CD226 expression was significantly increased in MM patients as compared to HD (Figure 4A and Figure S4B-C). CD226- percentages were also significantly higher among CD8+
tumor infiltrating lymphocytes (TILs) than PBMCs in MM patients (Figure 4B). Of note, we didn’t observe any correlation between the age, the gender and the percentages of BM infiltrating CD226- CD8+ T cells among MM patients and HD (Figure S4D). By contrast, the
percentage of CD226expressingCD8+ T cells significantly correlated with myeloma CD8+ T cell
infiltration (Figure S4E) and CD226 gene expression was strongly associated with the expression of cytotoxic lymphocyte functional genes including CD2, CD3E, CD3D, TBX21, CD8B,
PRF1, GZMA, and GZMB in MM patient’s samples (Figure S4F). These data suggested a
relationship between CD226 loss and CD8+ T cell dysfunction in the tumor microenvironment.
Functional analysis of myeloma infiltrating CD8+ T cells upon in vitro re-stimulation with
anti-CD2/CD3/CD28 microbeads confirmed that CD226- CD8+ T cells had significantly lower
TCR-induced proliferation, IFN-g and TNF-a production and degranulation than CD226+ CD8+ T cells
(Figure 4C-D and Figure S4G-H). Of note, CD226+ TILs produced significantly higher cytokine
levels than their CD226- counterparts both in the TIGIT- and TIGIT+ fractions thus excluding the
role for this negative regulator of CD226 in the hypo-responsiveness of CD226- TILs (Figure S4I). Interestingly, for patients with a detectable population of NY-ESO-1 specific TILs, the frequency of CD226- cells was significantly higher among NY-ESO-1 specific TILs than among
polyclonal TILs (Figure 4E and Figure S4J). The absence of CD226 expression was again associated with reduced cytokine production by CD8+ T cells upon stimulation with NY-ESO-1
peptide (Figure 4F). CD226- CD8+ T cells with reduced effector functions also represented a
significant fraction of TILs isolated from other cancer types including non-small cell lung cancer (NSCLC), breast adenocarcinoma and ovarian carcinoma (Figure 4G and Figure S4K). In these tumors, CD226- percentages were also significantly higher among TILs than CD8+ T cells
isolated from healthy distant tissues or PBMCs (Figure 4G). In invasive breast cancer (BRCA) cohorts from the TCGA data base, CD226 expression was also associated with significantly
decreased disease-free (DFS) and overall survival (OS) (Figure 4I and Figure S4L). Altogether, these results demonstrate that the absence of CD226 expression, (1) identifies TILs with severely impaired functions across diverse malignancies, (2) could impact patient clinical outcome.
Tumor microenvironment drives the differentiation of dysfunctional CD226- CD8+ T cells.
To understand the link between tumor progression, CD226 loss and CD8+ T cell dysfunction,
we explored CD226 expression in well characterized preclinical mouse cancer models. As described previously (Seth et al., 2011), we found that most CD8+ T cells isolated from the
spleen C57BL/6 WT mice expressed homogeneous levels of CD226. By contrast, we observed the progressive emergence of a CD226negative population among CD8+ Tems infiltrating
B16F10 melanoma and VK12653 myeloma tumors (Figure 5A-E and Figure S5A). In both models, the percentage of CD226- CD8+ TILs significantly correlated with tumor size (Figure 5D-E and Figure S5B-C) confirming the link between CD226 loss and tumor development. As in humans, CD226- CD8+ T cells accumulating in mouse tumor microenvironment were
characterized by significantly decreased proliferation as evidenced by reduced Ki67 staining (Figure 5F). Upon in vitro re-stimulation with anti-CD3/anti-CD28 mAbs, they also produced significantly less IFN-g and TNF-a than their CD226+ counterparts (Figure 5G). These results
confirm that the absence of CD226 in CD8+ T cells marks a dysfunctional population associated
with tumor progression.
To address the question of CD226- TIL antigen specificity, ova-specific OT-1 CD8+ T cells were
transferred into WT mice that were subsequently injected with B16F10 expressing or not ova antigen (Figure 5H). We detected an accumulation of TCRa2+/Vb5+ OT-1 CD8+ Tems with a low
CD226 expression within B16F10-ova tumors (Figure 5I). OT-1 CD8+ Tems were also present
in B16F10 tumors, although at lower frequencies (Figure S5D-E). Yet, in the absence of their cognate antigen, most of the B16F10 intratumor OT-1 CD8+ Tems retained a high CD226
expression (Figure 5I). Of note, CD226-OT-1 CD8+ Tems were also almost undetectable in the
spleen of B16F10 and B16F10-ova bearing mice (Figure 5I). More importantly, we found that the percentage of CD226- cells was significantly higher among TCRa2+/Vb5+ OT-1 cells than
among TCRa2-/Vb5- T cells in the B16F10-ova model confirming that CD226 loss preferentially
cells isolated from the spleen of OT-1 mice into immunodeficient Rag2-/-gc-/- bearing B16F10
or B16F10-ova tumors (Figure S5F-H). Taken together these results demonstrate that tumor microenvironment drives the differentiation of CD226+ CD8+ T cells into CD226- CD8+ T cells in
a tumor-antigen dependent manner.
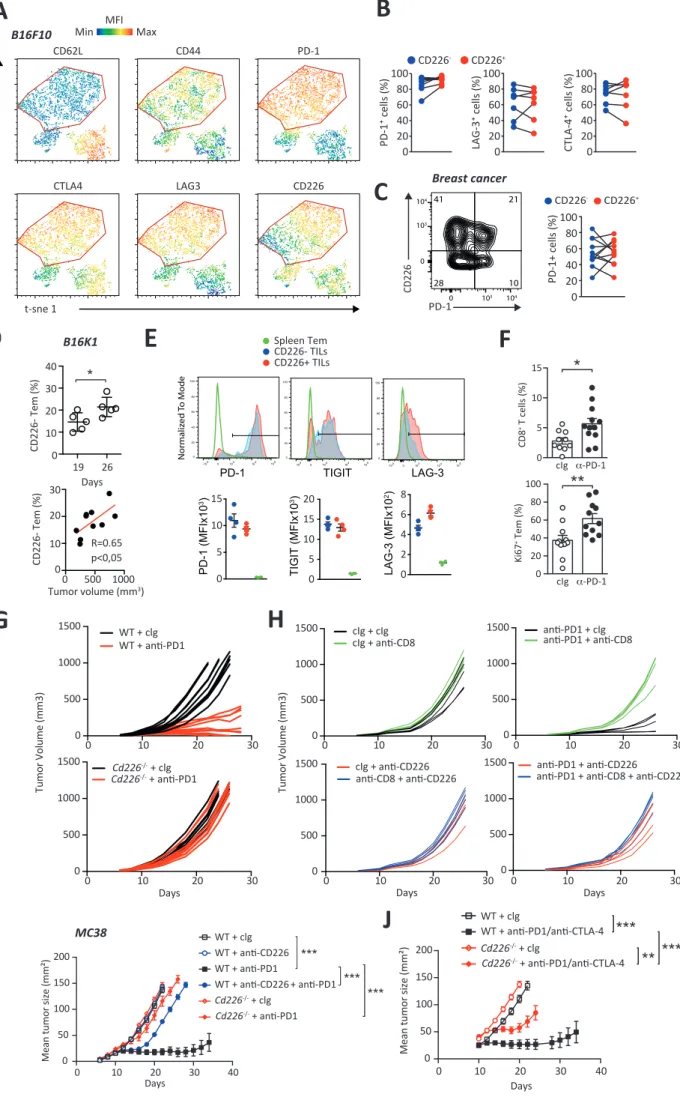
Immune checkpoint blockade efficacy relies on CD226.
We analyzed whether the expression of CD226 is implicated in the exhaustion of CD8 T cells. Phenotypic analyses revealed that both CD226- and CD226+ CD8+ TILs isolated from B16F10
bearing mice had a phenotype consistent with Tex cells characterized by a high expression of PD-1, TIGIT, LAG-3 and CTLA-4 (Figure 6A and Figure S6A, B). CD226- and CD226+ OT-1 cells
infiltrating B16F10-ova tumors upon adoptive transfer into WT mice also expressed similar levels of PD-1 and Tim-3 (Figure 6B). These immune-checkpoints were also equally present on CD226- and CD226+ TILs isolated from breast and ovarian cancer patients (Figure 6C and Figure
S6C). Therefore, we hypothesized that CD226 expression might impact CD8+ T cell response
to immune checkpoint blockade. To test this hypothesis, we analyzed CD226- and CD226+ CD8+
Tem cell responsiveness to anti-PD-1 blockade using a B16K1 melanoma variant overexpressing MHC-I (Bertrand et al., 2017). Of note, CD226- CD8+ TILs that progressively
accumulated in this model correlated with tumor size and displayed similar immune checkpoint expression with their CD226+ CD8+ counterparts (Figure S6D-E). As expected
(Bertrand et al., 2017), anti-PD-1 mAbs injection led to a significant decrease in tumor growth as compared to control Ig treatment that was abrogated upon monoclonal antibody based depletion of CD8+ T cells (Figure 6D-E). A concomitant increase in the percentage of tumor
infiltrating CD8+ T cells and proliferating Ki67+ CD8+ TILs was also observed (Figure S6F). Still,
while anti-PD-1 increased the in vivo proliferation of CD226+ TILs, the proliferation of CD226
-CD8+ TILs was not significantly affected by this treatment (Figure 6F). In addition, unlike their
CD226+ counterparts, anti-PD-1 treatment failed to increase ex vivo IFN-g production by
CD226- CD8+ TILs (Figure 6G). Altogether, these results suggest that anti-PD-1 treatment may
not reverse CD226- CD8+ T cells dysfunction suggesting that CD226 expression may be critical
for anti-PD-1 efficacy. To confirm this hypothesis, WT or Cd226-/- mice bearing B16K1 tumors
were treated with anti-PD-1 or control Ig antibodies. PD-1 blockade resulted in significant reduction in tumor growth in WT mice while it only had minor effects in CD226-/- mice (Figure 6H and Figure S6G). Tumor-bearing WT mice injected with anti-CD226 blocking mAbs also
failed to respond to anti-PD-1 treatment (Figure 6I and Figure S6H). Of note, CD226 blockade had quite similar negative impact on anti-PD1 treatment as CD8+ T cell depletion in these
experiments (Figure 6I and Figure S6H) underlining the critical role of CD226 expressed by CD8+ T cell for anti-PD1 efficacy. Similar results were obtained using MC38 model upon
treatment with PD-1 alone or in combination with anti-CTLA-4, thus confirming the importance of CD226 in the efficacy of ICB (Figure S6I-J). Altogether, these results highlight that the accumulation of defective CD226- CD8+ TILs may represent an important parameter
limiting the efficacy of ICB.
Tumor-induced CD226- CD8+ T cells accumulation depends on Eomes expression.
Although RNAseq analysis revealed that human resting CD226+ and CD226- CD8+ T cells have
similar transcriptional program, several genes differed between these two subpopulations (Figure S2C). In particular, we found that Eomesodermin (Eomes) transcription factor (TF) mRNA was expressed significantly higher in the CD226- fraction of both resting and activated
human CD8+ T cells (Figure 7A). Similar observations were made at the protein level in CD8+ T
cells isolated from HD or cancer patient’s samples (Figure 7B). Together with previous evidence showing that high Eomes expression limits TILs responsiveness to ICB (Blackburn et al., 2008; Paley et al., 2012), these results questioned the role of this TF in the accumulation of dysfunctional CD226- CD8+ Tems in tumors. To address this point, we analyzed the
tumor-induced differentiation of CD226- CD8+ T cells in CD4crexEomesfl/fl mice (EomesKO) that have T
cell specific deletion of Eomes. First, we confirmed that CD226- TILs expressed significantly
higher levels of Eomes in both B16F10 (Figure 7C-D and Figure S7A-C) and Vk12653 (Figure
S7D-G) bearing CD4WTxEomesfl/fl controlmice (EomesWT). More importantly, in both tumor
models, the percentage of CD226- CD8+ TILs was strongly reduced in EomesKO mice as
compared to EomesWT mice (Figure 7C, E and Figure S7G). Of note, the absence of Eomes did
not significantly affect tumor size, nor tumor CD8+ Tem percentage ruling out a potential
impact of these parameters in the observed differences between EomesKO and EomesWT mice
(Figure S7A-F). To confirm the role of Eomes in CD226- CD8+ T cell development, we next
analyzed CD226 expression by CD8+ T cell in mice overexpressing Eomes under the hCD2
promoter (Istaces et al., 2019). As expected, we found that splenic CD8+ T cells isolated from
higher Eomes expression than their CD226+ counterparts confirming the link between Eomes
overexpression and CD226 loss (Figure 7F-G). In order to determine the mechanisms underlying Eomes regulation of CD226 expression we analyzed ATAC-Seq, Eomes ChIP-Seq and H3K27 histone acetylation profile of Cd226 locus in CD8+ T cells (Figure S7H). ChIP-Seq
data from ectopic or endogenous Eomes in CD8 T cells (GSE122895; PMID: 30619337 and GSE124914; PMID 31341159) both revealed a clear fixation peak in an accessible intronic region of Cd226, indicating that Eomes is able to directly interacts with regulatory elements of the Cd226 gene (Figure S7H).
CD226loss restrains CD8+ T cells antitumor functions during CD137 immunotherapy.
Agonist antibodies against CD137 (TNFRSF9, 4-1BB) represent promising immunotherapeutic agents previously shown to induce Eomes up-regulation in T cells (Curran et al., 2013) that could thus affect CD226 expression by CD8+ T cells. Indeed, we found that anti-CD137
treatment resulted in the expansion of CD8+ T cells with an effector memory phenotype that
expressed high levels of Eomes in the different lymphoid organs tested (Figure 8A-B and Figure S8A). Remarkably, anti-CD137-induced Eomes over-expression was accompanied by the progressive emergence of CD8+ Tems lacking CD226 expression in a dose dependent
manner (Figure 8A-B and Figure S8B-C). By contrast, agonist mAbs targeting other immunostimulatory members of the TNF receptor family such as GITR or OX40 did not increase Eomes expression nor the frequency of CD226- CD8+ T cells (Figure S8D-E). Once
again, CD226- CD8+ T cells were characterized by higher Eomes levels (Figure 8C) and Eomes
deficiency significantly abrogated CD226loss induced by anti-CD137 mAb treatment (Figure S8F) thus confirming the importance of this TF in the program leading to CD226 loss. Interestingly, CD226 loss induced by anti-CD137 mAb treatment was also abrogated in
CD4crexEomesfl/wt (Eomeshet) mice (Figure 8D) that were characterized by lower Eomes level as
compared to EomesWT but induced similar effector CD8+ T cell expansion upon CD137
treatment (Figure S8G). By contrast, anti-CD137 induced CD226- CD8+ T cell accumulation was
not affected by CD155deficiency, ruling out any critical role of CD226/CD155 interactions in the emergence of CD8+ T cells lacking CD226 expression upon CD137 stimulation (Figure 8E).
To confirm whether anti-CD137 agonists promoted the differentiation of CD226+ T cells into
CD226- T cells as shown in the tumor context, we transferred purified CD226+ naïve CD8+ T
cells into Rag2-/-gc-/- mice (Figure S8H). A few days after cell transfer, most CD8+ T cells had
undergone several rounds of division as a result of homeostatic expansion. They had also acquired a CD44hi memory T cell phenotype but remained CD226+ T cells, ruling out that the
emergence of CD226- cells only resulted from CD8+ T cell division or memory T cell
differentiation (Figure S8I). By contrast, the subsequent injection of anti-CD137 mAbs promoted the accumulation of CD226- CD8+ Tems confirming that the accumulation of CD226
-CD8+ T cells upon CD137 activation resulted from the CD226+ CD8+ T cell differentiation (Figure S8J). The emergence of OT-1 cells lacking CD226 expression was also observed following adoptive transfer of CD226+ OT-1 cells into WT mice upon treatment with anti-CD137 mAbs
(Figure S8K). Altogether, these results demonstrate that Eomes over-expression induced by CD137 immunotherapy drives the differentiation of CD226+ into CD226- CD8+ T cells.
Given the overall clinical interest around CD137 agonists as immunotherapeutic agents in cancer, we next analyzed the functions of CD226- and CD226+ CD8+ Tems induced upon
anti-CD137 treatment. We found that purified CD226- CD8+ Tems from anti-CD137-treated mice
divided less and produced lower levels of IFN-g and TNF-a than their CD226+ counterparts in
response to CD3/CD28 stimulation (Figure 8F-G). Using OT-1 mice treated with anti-CD137, we confirmed that anti-CD137 induced CD226- CD8+ OT-1 cells have lower effector
functions than their CD226+ counterparts in response to their cognate antigen (Figure 8H). It
is worth mentioning that CD226- CD8+ Tems isolated from anti-CD137-treated mice had
strongly reduced CD226 mRNA levels as compared to CD226+ CD8+ Tems confirming, as in
humans, that CD226 loss process occurs at the transcriptional level (Figure S8L).
Finally, to gain clear insight whether CD226 loss may affect the in vivo anti-tumor functions of CD8+ T cells that expand upon anti-CD137 immunotherapy, Pmel-1 transgenic mice, that all
harbor CD8+ T cells specific for the B16 gp100 melanoma antigen, were treated with
anti-CD137 mAbs. Sorted CD226- or CD226+ CD8+ Tems were transferred into B16F10 melanoma
bearing mice according to previously described adoptive cell transfer (ACT) protocol (Landsberg et al., 2012)(Figure 8I). Consistent with their reduced effector capabilities in vitro, CD226- CD8+ T cells only mildly reduced tumor development while the transfer of CD226+ CD8+
T cells resulted in a drastic reduction in tumor growth and significantly prolonged survival of mice (Figure 8J-K). These results confirm that Eomes dependent CD226 loss induced by anti-CD137 treatment could limit the anti-tumor efficacy of this treatment in vivo.
DISCUSSION
The mechanisms underlying the lack of responsiveness of anti-tumor CD8+ T cells are still
poorly understood and finding additional signals that regulate their functions has become a major priority. In the present study, we found that loss of the activating receptor CD226 is a critical mechanism that alters CD8+ T cell responsiveness to TCR stimulation. Pre-clinical tumor
mouse model confirmed that tumor development drives the accumulation of dysfunctional CD8+ T cell lacking CD226 expression through an Eomes-dependent mechanism. More
importantly, our results demonstrated that CD8+ T cells fail to respond to ICB in the absence
of CD226 and that CD226 loss affects anti-CD137 agonist efficacy. Taken together our study suggests that CD226 loss represents an underappreciated determinant of CD8+ T cell
dysfunction in the tumor microenvironment that may impact cancer patient response to immunotherapy.
The profound cancer-immunosurveillance defects depicted by our group and others in diverse tumor mouse models (Gilfillan et al., 2008; Guillerey et al., 2015; Iguchi-Manaka et al., 2008) in the absence of CD226 suggested this receptor might exert central functions in T lymphocyte biology. The implication of this receptor in CD4+ T helper cell differentiation (Gaud et al., 2018;
Lozano et al., 2012; Lozano et al., 2013) and the association between CD226 gene single nucleotide polymorphism (SNP) with increased development of autoimmune pathologies (Maiti et al., 2010; Song et al., 2012; Todd et al., 2007) supported this hypothesis. Yet, initial studies using CD226-deficient mice indicated that CD226 is not formally required for antigen-specific CD8+ T cell activation and no striking immune defects were found in the absence of
CD226 (Gilfillan et al., 2008). Based on this evidence, this receptor was so far mainly considered as a co-stimulatory receptor increasing cytotoxic T lymphocyte- and NK cell-mediated cytotoxicity against CD112- and CD155-expressing targets (Martinet and Smyth, 2015). Herein, using diverse TCR triggering agents, in the presence or absence of CD28 co-stimulation, we presented compelling evidence that CD8+ T cells that do not express CD226
are hypo-responsive to TCR stimulation and have limited effector functions. These results imply that CD226 plays a more central role than originally thought in CD8+ T cell activation
The phenotype of CD8+ T cells expressing CD226 or not were very similar for the different
healthy donors and cancer patients analyzed in our study. These results were confirmed by RNAseq analysis of freshly purified peripheral blood CD226- and CD226+ CD8+ T cells with only
76 genes differentially expressed between both subsets. It is unlikely that these subtle differences at the resting state may be responsible for the divergent functional outcomes observed between CD226- and CD226+ CD8+ T cells upon TCR stimulation since we found that
CD226 forced expression through lentiviral vectors restored CD226- CD8+ T cells functions in
response to TCR stimulation. These results together with the reduced phosphorylation of several key TCR downstream signaling molecules observed upon anti-CD3 stimulation in the absence of CD226 strongly argue for a key role of CD226 in CD8+ T cell TCR signaling. Although
CD226- and CD226+ CD8+ T cells both underwent important transcriptional modifications upon
anti-CD2/CD3/CD28 stimulation, archetypal effector T cell-associated genes were only detected in stimulated CD226+ T cells. Such results suggest that the presence of CD226 directly
impacts TCR induced CD8+ T cell effector program. Understanding how CD226 modulate TCR
signaling in CD8+ T cells may provide new approaches to restore T cells functions especially in
tumor context.
Several pieces of evidence indicate that CD226 is implicated in LFA-1 functions (Shibuya et al., 1999; Shirakawa et al., 2005; Shirakawa et al., 2006). LFA-1 binding to ICAM-1 on contacting cells represents a critical early event driving actin-cytoskeleton reorganization, immune synapse formation, and co-stimulation ultimately lowering TCR activation threshold (Bachmann et al., 1997; Bianchi et al., 2000; Perez et al., 2003). We brought significant evidence that LFA-1 functions are affected by the absence of CD226. Indeed, we found that TCR induced LFA-1 activation into its high-affinity conformation (Dustin and Springer, 1989), was greatly reduced in the absence of CD226 in CD8+ T cells and that CD226 forced expression
restored these defects. In addition, we observed that LFA-1 inhibition reduced CD8+ T cell
activation similar to CD226 loss. Thus, our results suggest that LFA-1 defects owing to CD226 loss may represent an important mechanism of TCR hypo-responsiveness and CD8+T cell
dysfunction in tumors. The observations from Braun et al. showing actin cytoskeleton reorganization and LFA-1 polarization defects in Cd226-/- CD8+ T cells support this hypothesis
(Braun et al.). Future work will be needed to better understand how CD226 intrinsic signaling connects with TCR signaling and LFA-1 in CD8+ T cells. CD226 contains at least two
phosphorylation sites on tyrosine residue 322 and on serine residue 329 in its intracellular domain (Martinet and Smyth, 2015; Shibuya et al., 1996). A recent study stressed the importance of the conserved Y322XN324X immunoglobulin tyrosine tail (ITT) motif in the NK cell
cytolytic functions of CD226 (Zhang et al., 2015). This typical consensus binding sequence was indeed shown to connect CD226 with Grb2 SH2 domain, subsequently leading to the activation of Vav-1, phospholipase C-γ1 and ERK1,2 (Zhang et al., 2015). CD226 ITT motif could therefore represent a critical relay to amplify TCR downstream signaling. The decreased phosphorylation of ZAP-70, SLP76, LAT and ERK1,2 observed in CD8+ T cells lacking CD226 and
the recent evidence that Vav-1 associates with CD226 in CD4+ T cells may support this
hypothesis (Gaud et al., 2018). Surprisingly, no immune synapse, nor functional defects were observed by Braun et al. in CD8+ T cells isolated from Cd226Y mice harboring a point of
mutation on the Y319 of CD226 (mouse equivalent Y322) suggesting that this signaling is
dispensable for CD226 synergy with LFA-1 and TCR co-stimulation (Braun et al.). Although the importance of Ser 329 phosphorylation in the propagation of CD226 downstream signaling remains a matter of debate (Zhang et al., 2015), this residue could represent a critical link between TCR signaling, CD226 and LFA-1. Indeed, Ser 329 of CD226 was found to be phosphorylated upon CD3/CD28 stimulation and was required for CD226 physical association with LFA-1 in lipid raft (Shibuya et al., 1999; Shirakawa et al., 2005; Shirakawa et al., 2006). Besides, CD226 may also play a critical role in cytoskeleton remodeling, a central process for TCR signaling and LFA-1 conformational activation. This hypothesis is supported by a study from Ralston and colleagues showing that CD226 could bind tightly to the actin cytoskeleton through its interaction with the MAGUK homologue human discs large (hDlg) and the actin-binding protein 4.1G (Ralston et al., 2004).
It is now well established that many human tumors express specific antigens that can elicit CD8+ T cell activation and the accumulation of CD8+ effector T cells in the tumor
microenvironment (Schumacher and Schreiber, 2015). Unfortunately, successful eradication of tumor cells by these TILs is often limited by diverse immunosuppressive mechanisms (Thommen and Schumacher, 2018). Among them, the up-regulation of multiple inhibitory receptors such as PD-1, Tim-3, TIGIT, and LAG-3 at the cell surface of TILs has emerged as major mechanisms of T cell dysfunction protecting tumors from immune attack (Thommen
escape other than the classical immune checkpoints through the loss of a critical activation receptor, CD226. We presented considerable new evidence that tumor development favors the accumulation of dysfunctional CD8+ T cells lacking CD226 expression. While almost all
mouse CD8+ T cells expressed CD226 in steady-state conditions, we found the progressive
accumulation of TILs lacking CD226 with a CD62L-CD44hi effector memory phenotype in the
different tumor mouse models tested. Of note, CD226 loss mainly affected tumor antigen-specific CD8+ T cells since we observed that ova-specific purified CD226+ OT-1 cells only
converted into CD226- effector cells when transferred into ova-tumor bearing mice. Still, the
differentiation of CD8+ T cells into hypo-reactive CD226- CD8+ T cells may occur in other
contexts as dysfunctional CD226- CD8+ T cells were detectable in most healthy donors.
Whether this reflects a previous immune history of each individual or whether this represents a mechanism ensuring immune homeostasis by preventing over CD8+ T cell activation remains
to be more deeply investigated in the future.
Sustained expression of inhibitory receptors was so far considered as a key parameter allowing the identification of exhausted T cells in chronic infectious disease and cancer (Ahmadzadeh et al., 2009; Blackburn et al., 2009; Thommen et al., 2018). The successful reinvigoration of Tex functions by anti-PD-1 mAbs in chronic viral infections (Barber et al., 2006) and the impressive clinical results obtained by ICB in cancer patients (Robert et al., 2015; Robert et al., 2011; Topalian et al., 2012) support the importance of inhibitory receptors in T cell dysfunctions. Still, recent studies suggest that intratumor PD-1+ exhausted T cells comprise
a large spectrum of dysfunctional states (Bengsch et al., 2018; Thommen et al., 2018). More importantly, it becomes evident that the potential of reinvigoration by ICB differs between CD8+ Tex subpopulations, meaning that additional alterations restrain exhausted T cell
functions (Pauken et al., 2016; Philip et al., 2017; Scott et al., 2019). Interestingly, both CD226
-and CD226+ cells were found among tumor infiltrating Tex cells with similar IC expression. Still,
CD226- TILs consistently had lower effector functions and proliferation than their CD226+
counterparts. In addition, anti-PD-1 immunotherapy failed to restore effector functions of TILs lacking CD226 expression. Thus, the absence of CD226 activation receptor might represent a yet underappreciated molecular mechanism limiting intratumor T cell responsiveness and correlating with their exhausted state independently of inhibitory receptors.
Although several predictive factors such as CD8+ T cell infiltration (Tumeh et al., 2014), PD-L1
expression (Larkin et al., 2015) as well as tumor neo-antigen load (Rizvi et al., 2015) were identified in the past, it remains still unclear why some patients respond to ICB therapy while others do not. Thus, understanding the molecular mechanisms underlying effective responses to ICB therapy remains an intense field of investigation. Recently, it was demonstrated that PD-1/PD-L1 signaling suppresses T cell function via inactivation of CD28 signaling rather than TCR signaling (Hui et al., 2017) and that CD28/B7 pathway plays a crucial role in the efficacy of anti-PD-1 treatment (Kamphorst et al., 2017). However, the efficacy of anti-PD-1 may also rely on additional co-stimulatory signals as demonstrated by a recent study showing that PD-1/PD-L1 pathway is a negative regulator of CD226 signaling and that the anti-tumor effect of PD-1 and GITR antibody combination was abrogated in the absence of CD226 (Wang et al., 2018). Our study demonstrating that anti-PD-1 immunotherapy fails to restore effector functions of TILs lacking CD226 expression not only confirms the importance of signals provided by CD226 in anti-PD-1 efficacy but also highlights a novel mechanism of tumor resistance to ICB through the loss of CD226 expression. Thus, the extent of CD226- CD8+ T cells
accumulating in the tumor microenvironment may represent an attractive parameter to consider for predicting anti-PD-1 efficacy in cancer patients especially given the high CD226 variability observed among cancer patients in our study.
A better understanding of the tumor signals involved in CD226 loss is required as they may represent interesting target to restore CD8+ T cell anti-tumor functions and immune
checkpoint efficacy. CD226 engagement by its ligands, especially CD155, was previously shown to decrease CD226 density at the cell surface of NK and T cells (Li et al., 2018b). The chronic stimulation of CD226 by tumors that frequently overexpress CD155 may therefore participate in CD226 loss as shown by Braun et al. (Braun et al.). Although, ligand induced CD226 recycling may account for CD226 loss, especially in the tumor context, our results suggest the existence of additional mechanisms occurring at the transcriptional level. Interestingly, we found that tumor induced CD226 loss was blunted in the absence of Eomes. Conversely, Eomes overexpression promoted the accumulation of dysfunctional CD226-CD8+
T cells and once again this phenomenon was blunted in the absence of Eomes. While these results demonstrate the implication of Eomes in CD226 loss, the mechanisms underlying
Eomes fixation pic in a regulatory region of Cd226 gene suggest that Eomes may directly repress CD226 expression. Several studies suggested that the level of Eomes expression may distinguish two different T cell exhaustion stages induced by chronic antigen exposure (Blackburn et al., 2008; Buggert et al., 2014; Paley et al., 2012). In chronic viral infections, Eomeshi Tex cells expressed higher levels of inhibitory receptors, had reduced effector
functions, and did not respond to anti-PDL1-mediated reinvigoration as compared to Eomeslo
Tex cells (Blackburn et al., 2008; Paley et al., 2012). Dissecting the exact role of Eomes in T cell dysfunction was complicated by the function of this TF in effector CD8+ T cell program and
memory maintenance (Intlekofer et al., 2005; Kaech and Cui, 2012). Recent evidence suggests that low Eomes expression is required for anti-tumor effector T cell expansion and tumor control, while its overexpression favors T cell exhaustion and tumor outgrowth (Li et al., 2018a). Although Eomes was implicated in the up regulation of several immune checkpoints such as PD-1 and Tim-3, our results suggest that CD226 loss may also participate to the terminal exhaustion program associated with Eomes overexpression.
CD137 agonists was shown to stimulate CD8+ T cell dependent antitumor immune response
and promote tumor regression in a variety of mouse tumors (Guillerey et al., 2015; Melero et al., 1997). Still, early clinical trials revealed limited anti-CD137 mAb efficacy until now in cancer patients (Chester et al., 2018) and anti–CD137 agonists were shown to suppress clinical symptoms in several mouse models of autoimmunity (Choi et al., 2006; Kim et al., 2011; Seo et al., 2004; Sun et al., 2002). Some of the beneficial effects of anti-CD137 agonists in autoimmune models were ascribed to the expansion of a regulatory population of CD8+ T cells
that express CD11c producing high levels of IFN-γ (Choi et al., 2006; Kim et al., 2011). Our results suggest that CD226 loss induced by Eomes overexpression may also account for the immune regulatory function of CD137 and that preserving CD226 expression may increase the efficacy of this treatment in human cancer patients.
Although immunotherapy has represented a major breakthrough in cancer treatment, clinical responses are observed only in a fraction of treated patients and cancer types. Therefore, one of the major current research challenges now resides in the identification of novel mechanisms restraining anti-tumor immune functions. We and Braun et al. have demonstrated that CD226 expression represents a critical rheostat for anti-tumor functions
of CD8+ T cells and that Eomes-dependent and/or CD155-induced CD226 loss represents a
major tumor immune escape mechanism. AUTHOR CONTRIBUTION
Study conception and design: A.C.P., M.W., A.A., S.G., T.B., M.J.S and L.M. Acquisition of data: A.C.P., M.W., A.A., L.L., M.B., N.C, M-V.J., M.L.M, G.G., I.D., E.B, C.M.S., E.M., L.B, S.M., A.S., A.A, M.P., S.K., M.C., C.G., M.J.S and LM. Analysis and interpretation of data: A.C.P., M.W., A.A., M.B., T.B., L.D.S., S.G., M.J.S and L.M. Drafting of manuscript: L.M. Critical revision and editing: A.C.P., M.W., A.A., L.D., L.L., A.D., A.S., T.B., M.J.S and L.M. Provision of key materials: B.C., E.V., A.M., A.D., M.A., J.M., M.P., and H.A.L.
ACKNOWLEDGEMENT
We thank Marie Tosolini, Laetitia Ligat, Liam Town and Brodie Quine and the members from the core facilities at the Cancer Research Center of Toulouse and QIMR Berghofer. We acknowledge the contribution of Gisèle Froment, Didier Nègre and Caroline Costa from lentivectors production facility of SFR Biosciences (UMS3444/CNRS, US8/Inserm, ENS de Lyon, UCBL). We thank Nathalie Rufer for providing PE-labeled NY-ESO-1 multimers and Céline Colacios for breast cancer sample data. We thank Pierre Cordelier and Bettina Couderc for their help on lentiviral vector. The “Genomic and Immunology of myeloma” laboratory at CRCT is supported by the “Fondation ARC pour la Recherche sur le Cancer” Program Grants (ARC PGA1-20160203788 and PGA1-20190208630). This work was supported by grants from the Institut National du Cancer (PLBIO R16100BB), Cancer Research Institute/Bristol-Myers Squibb CLIP Grant, the “Fondation Toulouse cancer santé” IUCT-O translational research program. A.S. and A.D. were supported by “Fondation pour la Recherche Médicale (DEQ20170336727)” and ARSEP. M.W and A.C.P were supported by la Ligue contre le cancer PhD fellowships. T.B. was supported by an EMBO long-term Fellowship (ALT945-2015) and a National Health and Medical Research Council of Australia (NH&MRC) Early Career Fellowship (1124690). M. J. S. was supported by a NH&MRC Senior Principal Research Fellowship (1078671) and Program Grant (1132519) and E.M was supported by a grant from ECTRIMS. S.G, M.L and E.B were supported by Fonds National de la Recherche Scientifique (FRS-FNRS, Belgium) and the European Regional Development Fund (ERDF) of the Walloon Region (Wallonia-Biomed
portfolio, 411132-957270). The results shown here are in part based upon data generated by the TCGA Research Network: https://www.cancer.gov/tcga.
CONFLICT DISCLOSURE
M.J. Smyth has research agreements with Bristol Myers Squibb and Tizona Therapeutics. L.M has research agreements with Bristol Myers Squibb, Sanofi-Aventis and Roche.
FIGURE LEGENDS
Figure 1: The absence of CD226 identifies hypo-responsive human CD8+ T cells.
(A) Representative FACS histogram and graph showing the expression of CD226 by healthy donor (HD) peripheral blood CD8+ T cells. n=77 HD. (B) Graph showing the relative frequency
of the indicated TCRvb among CD226- (blue)and CD226+(red) CD8+ T cells. Representative
from n=20 HD. (C) Representative FACS histograms and graph showing the percentages of CD226- in the indicated CD8+ T cell subsets. n = 77 HD. (D) Representative FACS histograms
and graph recapitulating the proliferation of purified CD226- and CD226+ CD8+ Tn, Tcm and
Tems activated by α-CD2/CD3/CD28 microbeads for 6 days. n=7-14 HD. (E) Representative FACS plots showing the proliferation of purified CD8+ T cells activated by allogeneic DCs or
CMVpp65 peptides for 6 days. n = 3 HD. (F) Graph showing the concentrations of the indicated cytokines in the culture supernatants of purified CD226- and CD226+ CD8+ Tems
stimulated with α-CD2/CD3/CD28 microbeads for 48 hrs. From n=5 HD. (G) Representative FACS plots showing the expression of CD107a degranulation marker and the intracellular production of IFN-g and TNF-a by CD226- and CD226+ CD8+ T cells activated by FcgR+ P815 cell
line coated with α-CD3 mAbs (OKT3, 1µg/ml). n=5 HD. (H) Representative graph showing calcium influx by CD226- and CD226+ CD8+ T cells activated with α-CD3 (OKT3, 10µg/ml).
Representative from n=4 HD. (I) Graph showing the expression of phosphorylated (p) SLP76 by CD226- or CD226+ CD8+ Tems stimulated with α-CD3 (OKT3, 10µg/ml) for 0, 1 or 5 minutes.
n=5 HD. (J-K) Purified CD226- or CD226+ CD8+ Tems were stimulated with α-CD3 (OKT3, 10
µg/ml) for 0, 1 or 5 minutes. Western blots using antibodies directed against the indicated total and phosphorylated (p) proteins are shown. Representative experiment from n=3 HD. Data are presented as mean ± SEM with each symbol representing an individual HD. Statistical differences between multiple groups were determined by one-way ANOVA with Tukey’s correction (C). Statistical differences between two groups were determined using Mann-Whitney test (D), unpaired (F) or paired T test (I). * p<0.05, ** p<0.01, *** p<0.001.
Figure 2: The absence of CD226 alters TCR-induced effector program of CD8+ T cells.
sequencing. (A) PCA analysis showing different expression gene profiles between CD226- and
CD226+ CD8+ Tem samples activated or not. (B) Venn diagram showing the number of genes
differentially expressed between the indicated groups of CD8+ Tems (p<0.01, FC> 2). (C)
Volcano plots showing differentially expressed genes between CD226- and CD226+ CD8+ Tem
samples, activated (ACT) or not. (D) Log-normalized gene-expression heatmap showing the hierarchical clustering of CD226- and CD226+ CD8+ Tem samples according to differentially
expressed genes between ACT CD226- and ACT CD226+ CD8+ Tems. (E) Graph showing gene
set enrichment of ACT CD226+ vs ACT CD226- CD8+ Tem specific genes analyzed in C7 immune
data sets. (F) Table showing GO term analysis performed on ACT CD226+ vs ACT CD226- CD8+
Tem differentially expressed genes. The associated NES and Adjusted p value was indicated. NES and FDR were plotted for each comparison.
Figure 3: Mechanisms underlying CD226- CD8+ T cell dysfunction.
(A-B) CD226- and CD226+ CD8+ Tems were stimulated with IL-7 (2ng/ml) for 24hrs and
transduced with GFP control or CD226-GFP lentiviral vectors (LVs) for 48hrs. (A) FACS histograms and graphs showing the expression of CD226, CD107a, IFN-g and TNF-a in transduced cells (GFP+) and untransduced cells (GFP-) after stimulation with α-CD2/CD3/CD28
microbeads. From n=4. (B) Representative FACS histograms and graphs showing the expression of CD226 and the proliferation of transduced (GFP+) and untransduced (GFP-)
CD226+ and CD226- cells upon stimulation with α-CD2/CD3/CD28 microbeads. From n=4. (C)
Representative FACS plots and graph recapitulating the percentages of CD226- and CD226+
CD8+ Tems stained with m24 mAbs against LFA-1 “extended open” high affinity conformation
after 2hrs in presence of α-CD2/CD3/CD28 microbeads or not (NS). From n=5 HD. (D) Representative confocal microscopy images showing the expression of CD226 and open LFA-1 (m24) by CD226- and CD226+ CD8+ Tems after 2hrs on α-CD3 (OKT3, 10µg/ml) coated wells.
(E) Graphs showing the mean fluorescence intensity of the indicated markers by CD226- and
CD226+ CD8+ Tems quantified on 15 representative field from 3 different experiments as in
(D). (F) CD226- and CD226+ CD8+ Tems were transduced with GFP control or CD226-GFP LVs
for 48hrs as in (A). Representative FACS plot and graphs recapitulating the percentages of transduced CD226- and CD226+ CD8+ T cells (GFP+) expressing CD226 and m24 LFA-1 high
affinity open conformation upon stimulation with α-CD2/CD3/CD28 microbeads for 2hrs. From n = 5-7 HD.(G) Graph recapitulating the intracellular production of IFN-g and TNF-a by
CD226- and CD226+ CD8+ Tems cells activated by α-CD3 (OKT3, 10µg/ml) for 6hrs in the
presence of control Ig (cIg) or blocking anti-LFA-1 mAbs (α-LFA-1). n=8 HD. Statistical differences between multiple groups were determined by one-way ANOVA with Tukey’s post-test analysis. Statistical differences between two groups were determined using Mann Whitney test. * p<0.05, ** p<0.01, *** p<0.001.
Figure 4: CD226absence identifiesdysfunctional CD8+ tumor infiltrating lymphocytes.
(A) Representative FACS histogram and graph showing the percentage of CD226- CD8+ T cells
isolated from the bone marrow (BM) of newly diagnosed multiple myeloma patients (MM; n=177) and healthy donors (HD; n = 20). (B) Representative FACS histogram and graph showing the percentage of CD226- CD8+ T cells by paired BM (TIL) or blood (PBMC) CD8+ T cells
isolated from MM patients (n = 10). (C) MM patient CD138- BM cells were stained with CTV
and stimulated with a-CD2/CD3/CD28 microbeads for 5 days. Representative histogram and graph recapitulating the proliferation of CD226- and CD226+ CD8+ TILs. n=20 MM patients. (D)
Representative FACS plots and graphs recapitulating the expression of CD107a degranulation marker and the intracellular production of IFN-g and TNF-a by MM patients’ CD226- and
CD226+ CD8+ TILs stimulated with a-CD2/CD3/CD28 microbeads for 6 hours. n = 36 MM
patients. (E) Representative FACS plot and graph showing CD226- frequency by polyclonal and
NY-ESO-1 specific CD8+ TILs among HLA-A*02+ MM patients with detectable
HLA-A*02-NY-ESO-1-PE multimers staining. (F) MM patient CD138- BM cells were stimulated with
HLA-A*02-NY-ESO-1 specific peptide (1μg/ml) for 6hrs. Representative FACS plots as well as pooled data from n=5 HLA-A2+ MM patients with positive NY-ESO response are shown. (G)Representative
histograms and graphs comparing the percentage of CD8+ T cells lacking CD226 expression in
the blood, healthy distant tissue and tumor biopsies of patients newly diagnosed with lung cancer (n=3), breast cancer (n = 10) or ovarian cancer (n=7). (I) CD226 expression correlates with breast cancer prognosis. Graph showing Kaplan–Meier disease-free (left) and overall (right) survival estimates for CD226high (>median value, n=503) and CD226low (<median value, n=503) Breast Cancer patients. RNA sequencing data involving 1006 invasive breast Cancer (BRCA) patients from the TCGA database. Data are presented as mean ± SEM with each symbol representing an individual cancer patient. Statistical analyses between two groups were performed using a Mann Whitney U test (A, C, D) or paired T test (B, E, F). Statistical