Use of EpiAlveolar Lung Model to Predict
Fibrotic Potential of Multiwalled Carbon
Nanotubes
Hana Barosova, Anna G. Maione, Dedy Septiadi, Monita Sharma, Laetitia Haeni, Sandor Balog,
Olivia O’Connell, George R. Jackson, David Brown, Amy J. Clippinger, Patrick Hayden, Alke Petri-Fink,
Vicki Stone, and Barbara Rothen-Rutishauser*
Cite This:ACS Nano 2020, 14, 3941−3956 Read Online
ACCESS
Metrics & More Article Recommendations*
sı Supporting InformationABSTRACT:
Expansion in production and commercial use of
nanomaterials increases the potential human exposure during the
lifecycle of these materials (production, use, and disposal).
Inhalation is a primary route of exposure to nanomaterials;
therefore it is critical to assess their potential respiratory hazard.
Herein, we developed a three-dimensional alveolar model
(EpiAlveolar) consisting of human primary alveolar epithelial
cells,
fibroblasts, and endothelial cells, with or without
macro-phages for predicting long-term responses to aerosols. Following
thorough characterization of the model, proin
flammatory and
pro
fibrotic responses based on the adverse outcome pathway
concept for lung
fibrosis were assessed upon repeated subchronic
exposures (up to 21 days) to two types of multiwalled carbon
nanotubes (MWCNTs) and silica quartz particles. We simulate occupational exposure doses for the MWCNTs (1
−30 μg/cm
2)
using an air
−liquid interface exposure device (VITROCELL Cloud) with repeated exposures over 3 weeks. Specific key events
leading to lung
fibrosis, such as barrier integrity and release of proinflammatory and profibrotic markers, show the
responsiveness of the model. Nanocyl induced, in general, a less pronounced reaction than Mitsui-7, and the cultures with
human monocyte-derived macrophages (MDMs) showed the proin
flammatory response at later time points than those
without MDMs. In conclusion, we present a robust alveolar model to predict in
flammatory and fibrotic responses upon
exposure to MWCNTs.
KEYWORDS:
human primary cells, lung model, pulmonary
fibrosis, multiwalled carbon nanotubes, air−liquid interface,
long-term repeated exposures
P
rogress in nanotechnology has led to increased
production of various types of nanomaterials with
unique properties. Thermal stability, electrical
con-ductivity, and mechanical durability have made carbon
nanotubes (CNTs) one of the most widely used nanomaterials,
especially in the
field of energy, electronics, and material
composites.
1−5The industrial use of CNTs could potentially
cause adverse biological and environmental impact throughout
their life cycle (i.e., from production to use and disposal). The
biopersistence and high aspect ratio of CNTs is particularly of
concern because exposure to these materials might induce
pulmonary pathologies (e.g., pulmonary inflammation, fibrosis,
mesothelioma, and other cancers) resembling those observed
with micrometer-sized asbestos
fibers.
6−8A growing number of
animal tests demonstrate that exposure to multiwalled CNTs
(MWCNTs) potentially triggers airway injury, in
flammation,
fibrosis, and granuloma formation.
9−12In particular, Mitsui-7
MWCNTs (henceforth referred to as Mitsui-7) have been
shown to induce progressive
fibrotic response in mice.
12−14Pulmonary
fibrosis can be induced in response to a specific
stimulus or as a consequence of the interactions of a substance
with alveolar epithelium.
15,16Nanomaterials can reach the
deepest regions of the lung (alveoli), depending on their
Received: August 29, 2019Accepted: March 13, 2020
Published: March 13, 2020
Article
www.acsnano.org
This is an open access article published under a Creative Commons Non-Commercial No Derivative Works (CC-BY-NC-ND) Attribution License, which permits copying and redistribution of the article, and creation of adaptations, all for non-commercial purposes.
Downloaded via UNIV DE FRIBOURG on June 2, 2020 at 11:50:22 (UTC).
physicochemical properties, and induce a cascade of cellular
responses
17that lead to pulmonary
fibrosis.
15,18−20This
cascade of events can be organized into an adverse outcome
pathway (AOP) framework. AOPs provide a means to organize
existing knowledge about an adverse health e
ffect starting with
a molecular initiating event (MIE) that triggers subsequent key
events (KEs) that occur at di
fferent levels of biological
organization, which ultimately lead to an adverse outcome
(AO). Organizing mechanistic information into an AOP helps
identify causally connected KEs and informs the choice of the
cell systems and assays best suited for investigating the
biological outcome.
An AOP describing the mechanism of pulmonary
fibrosis is
being developed as a part of the Organisation for Economic
Co-operation and Development (OECD) AOP Development
E
ffort overseen by the Extended Advisory Group on Molecular
Screening and Toxicogenomics. Several putative AOPs for
pulmonary
fibrosis with the potential MIE and KEs such as the
one shown in
Supplementary Figure 1
have been described
previously.
15,18,19,21Of note here is that some of the KEs
presented in
Supplementary Figure 1
could overlap or occur
simultaneously. Brie
fly, when a substance comes in contact
with cellular membranes (MIE), a number of danger markers,
called alarmins (an umbrella term for endogenous molecules
that signal tissue and cell damage), are released as a part of an
in
flammatory response (KE1). The inflammatory response
includes release of proin
flammatory cytokines (e.g., tumor
necrosis factor
α (TNF-α), interleukin (IL)-1β, and IL-8) and
an in
flux of leukocytes to the alveolar space, which precedes
loss of alveolar barrier integrity (KE2). The purpose of the
in
flammatory response is to clear the foreign material from the
tissue and to initiate repair, which is facilitated by growth
factors, such as transforming growth factor
β (TGF-β). The
repair process involves proliferation and migration of epithelial
cells and di
fferentiation of fibroblasts into myofibroblasts
(KE3), which produce extracellular matrix (ECM)
compo-nents (KE4) to repair the damage. Under physiological
conditions, inflammation is resolved and normal alveoli
structure and function is restored. However, in case of
exposure to high doses or persistent stimulus, the repair
process does not proceed properly. As a result, continued
in
flammation and excessive fibroblast and myofibroblast
activation lead to increased ECM deposition and thickening
of alveolar walls and, ultimately, to pulmonary
fibrosis (AO).
Choosing an assay or a battery of assays to measure the KEs
along an AOP can help in designing testing strategies to
predict complex outcomes such as pulmonary
fibrosis.
While rodents have been used to characterize the whole lung
response, these experiments are time-consuming, expensive,
and of questionable human relevance and raise ethical
concerns. As a result, in vitro lung systems are being
increasingly used to investigate mechanisms of human toxicity
following particle exposure.
22,23One example of widely used in
vitro systems are three-dimensional (3D) reconstructed human
respiratory tissue models that are grown at the air
−liquid
interface (ALI) and exhibit morphological and functional
characteristics similar to the in vivo microenvironment.
Reviews of in vitro models and recommendations on how to
apply them to predict complex human outcomes have been
described previously.
22,24In addition to choosing assays to measure speci
fic KEs along
an AOP, it is critical to consider test substance concentration
and exposure methods that mimic human exposure conditions.
Many in vivo and in vitro studies were not designed to re
flect a
real-life occupational setting where exposures are likely to
occur repeatedly over a long time frame.
25For example, several
studies have been carried out using relatively high material
doses, which may overwhelm normal defense mechanisms,
thus resulting in signi
ficant initial pulmonary
inflamma-tion.
26−28Additionally, many existing in vitro studies have
been conducted under submerged conditions, which are less
physiologically relevant than cells grown at the ALI since lung
tissue is exposed to air on its apical surface. ALI exposure
approaches provide a key strategy for mimicking inhalation
toxicity.
29−33The aim of this study was to design a test system of the
lower respiratory tract that could be used to assess the
fibrotic
potential of substances. The use of an alveolar model in this
study was important because the small size of MWCNTs
allows them to penetrate deeply into the lung and probably
deposit in the alveoli. We developed, characterized, and tested
EpiAlveolar, a 3D reconstructed model of human alveolar
tissue consisting of alveolar epithelial cells,
fibroblasts, and
endothelial cells, for its ability to recapitulate aspects of
pulmonary
fibrosis. In addition, human monocyte-derived
macrophages (MDMs) were cocultured with the tissues to
examine their potential role in the proin
flammatory and
pro
fibrotic response. TGF-β was used as a positive fibrotic
control because of its involvement in the development of
fibrosis in different organs, disturbances of the homeostatic
microenvironment, promotion of cell activation, migration, and
invasion, and excessive extracellular matrix production.
34Dörntruper quartz (DQ12) particles were selected as a
positive control because they have been widely used in vitro
to stimulate the proin
flammatory response
35−37and have been
shown to stimulate the development of
fibrosis in vivo.
38−40Two types of MWCNTs, Mitsui-7 and Nanocyl, were chosen
as test materials because of the di
fferences in their
physicochemical properties. They have also been shown to
induce the release of pro
fibrotic mediators (TGF-β, platelet
derived-growth factor, and osteopontin)
9,41−43and up-regulate
transcriptional and histological markers of
fibrosis in vitro.
Intratracheally instilled Nanocyl revealed a
fibrotic response 28
days postexposure in mice.
44Mitsui-7 showed the potential to
cause pulmonary
fibrosis in mice in several studies,
12,13,45,46investigating gene regulation,
46lung burden, and thickness of
connective tissue.
12,13In this study, the EpiAlveolar tissues
were exposed to test aerosolized materials using a
VITRO-CELL Cloud exposure system (VITROVITRO-CELL Systems,
Germany) allowing a dose-controlled deposition of the
materials at the ALI. To mimic a realistic human exposure
scenario, repeated, long-term exposures were conducted at low
concentrations.
RESULTS AND DISCUSSION
Reliable testing approaches are needed to predict the risk, to
support the safe-by-design concept, and for sustainable
development of nanomaterials. Emerging tissue engineering
technologies have resulted in e
ffective and efficient
human-relevant methods that align with the 3Rs principles.
47Human
cell-based models (e.g., 3D lung tissue models) and ALI
exposure devices have been developed during the past years,
allowing for direct aerosolization of nanomaterials onto the
surface of lung cells.
33,48The choice of test systems (i.e., cell types) and end points is
speci
fic to the research question and can be optimized by
considering the corresponding AOP. For example, the AOP for
pulmonary
fibrosis as depicted in
Supplementary Figure 1
shows the development of
fibrosis (the AO) preceded by key
events (KEs), such as chronic in
flammatory reactions, tissue
remodeling, and repair processes, which are prerequisites for
the development of the AO.
Submerged cell cultures using cell lines have revealed robust
results with clear pathways such as direct exposure of
fibroblasts to singlewalled CNTs increasing collagen type I
and III production
49or exposure of epithelial cells (BEAS-2B)
to singlewalled CNTs signi
ficantly increasing TGF-β release.
50To predict further profibrotic events, the EpiAlveolar model
was developed to mimic the in vivo human alveolar
microenvironment, which includes cell types relevant to
fibrosis, that is, human primary epithelial cells, endothelial
cells, and
fibroblasts. Our approach can build on data from
submerged cell cultures by adding insights into further key
events such as barrier properties and extracellular matrix
tissues, two additional highly relevant KEs for the
fibrotic
adverse outcome.
Characterization of EpiAlveolar Model. EpiAlveolar is
an in vitro organotypic model of the human alveolar tissue
composed of primary human alveolar epithelial cells and
pulmonary
fibroblasts grown on the apical surface of a
Transwell insert and primary pulmonary endothelial cells
grown on the basal surface of the insert. The tissues were
cultured at the ALI to induce di
fferentiation and to simulate in
vivo-like aerosol exposures.
The EpiAlveolar tissue model was evaluated for its ability to
mimic characteristics of the alveolar microenvironment in vivo.
The alveoli consist of an extremely thin epithelial layer
surrounded by a network of capillaries to enable gas exchange.
To evaluate if the overall morphology of the EpiAlveolar
tissues is similar, tissue cross sections were stained by
hematoxylin and eosin (H&E).
Figure 1
a shows that the
EpiAlveolar tissues are approximately 2
−4 cell layers thick on
the apical surface with a thin monolayer of endothelial cells on
the basal surface. Furthermore, tissue sections were stained by
an epithelial marker, cytokeratin 19 (CK19), and a
mesenchymal cell marker, vimentin (VIM), to show the layer
of alveolar epithelial cells on top of the
fibroblast (apical side)
and endothelial cell (basal side) layers (
Figure 1
b). The in vivo
alveolar epithelium consists of two cell types, type I (ATI) and
type II (ATII). The presence of both cell types was verified in
EpiAlveolar tissues by positive staining for cytokeratin 19
(CK19), an ATI marker, and cytokeratin 8 (CK8), an ATII
marker (
Figure 1
c). Transmission electron microscopy
micro-graphs con
firmed the presence of lamellar bodies (
Supple-mentary Figure 2a
), membrane-bound structures containing
stacked membranes of surfactant lipids.
51This result was
further verified by whole mount staining of the tissues for
expression of prosurfactant C (pSP-C), a critical feature of type
II alveolar epithelial cells (
Figure 1
d). Additionally, surface
tension of EpiAlveolar tissues, which is directly related to
surfactant production, was evaluated at day 2 (
Supplementary
Figure 2b,c
) as previously described in the literature.
52−54The
method relies on the fact that the diameter (d) of a deposited
droplet decreases with decreasing surface tension and vice
versa. EpiAlveolar tissues were tested in three biological
replicates (n = 3), while A549 cells served as assay control and
were measured only once (n = 1). The graph (
Supplementary
Figure 2b
) presents the relationship between drop ratio and
surface tension. Surface tension of EpiAlveolar tissues is
slightly higher than that measured in A549 cells,
52which could
Figure 1. Characterization of EpiAlveolar model. (a) Hematoxylin and eosin staining showing the thickness of the tissues, that is, 2−4 cell layers thick on the apical surface and a thin monolayer of endothelial cells on the basal surface. (b) Tissue sections showing the cell location within the tissue, that is, the layer of alveolar epithelial cells on top of thefibroblast (apical side) and endothelial cell (basal side) layers: epithelial marker cytokeratin 19 (CK19, red), mesenchymal cell marker vimentin (VIM, green), and DAPI (blue) staining cell nuclei. (c) Alveolar epithelial cell staining: ATI (CK19, red) and ATII cytokeratin 8 (CK8, green). (d) Whole mount staining of prosurfactant C (pSP-C, red), a functional marker of ATII cells, and DAPI (blue) staining cell nuclei. (e) Immunofluorescsent staining for the epithelial tight junction marker ZO-1 (red) and cell nuclei (DAPI, blue). (f) Transepithelial electrical resistance values for up to 42 days after tissue development; data are presented as mean± standard deviation, n = 3. Data obtained in Laboratory 1.
be attributed to the fact that EpiAlveolar tissue consists of a
mixture of alveolar epithelial type I and II cells. Although the
measured surface tension is higher than seen in vivo,
54it is low
enough to keep regular shape of a drop (
Supplementary Figure
2c
), which con
firms the presence of surfactants on the cellular
surface.
52,53Further quanti
fication of the ratio of the cell types,
surface tension, and secretion of surfactant is ongoing. Having
demonstrated the presence and spatial organization of the
di
fferent alveolar cell types, we wanted to determine if the
EpiAlveolar tissues form a barrier, which is an important
function of the in vivo tissue and is not well developed when
using alveolar cell lines, such as A549 cells.
55Barrier function
was assessed by visualization of tight junctions (
Figure 1
e) and
measuring the transepithelial electrical resistance (TEER) over
time. A TEER value
≥300 Ω·cm
2was considered indicative of
an intact barrier based on previous manufacturer experiments
and recommendations. The mean TEER value of EpiAlveolar
tissues was highest the
first week after completing
differ-entiation, decreased slightly, and then stabilized around 1000
Ω·cm
2(
Figure 1
f). TEER remained high for approximately one
month in culture, indicating that the tissue barrier remained
intact. This is important because it allows barrier integrity to
be assessed throughout long-term, repeated exposure
experi-ments. Following characterization of the EpiAlveolar model,
the tissues were challenged with di
fferent treatments and end
points were assessed related to the pulmonary
fibrosis pathway
in humans as depicted in the AOP schematic (
Supplementary
Figure 1
).
Cellular Interaction of the Substance (MIE). Pulmonary
fibrosis is initiated by a variety of stimuli including persistent
infections, autoimmune reactions, allergic responses, chemical
insults, radiation, and tissue injury. MWCNTs have also
previously been shown to reach the lower respiratory tract and
cause lung
fibrosis in vivo.
12,42It is worth mentioning that deposited materials on the
cellular surface can trigger a cascade of inflammatory mediator
and growth factor release, which activates
fibroblast
prolifer-ation and extracellular matrix production, and therefore, uptake
by cells or translocation to cells located beneath the alveolar
epithelial layer is not the only condition for development of
pulmonary
fibrosis. In addition, the barrier impairment could
increase the translocation of the materials across the alveolar
tissue, but with the herein used inserts having small pore sizes
(0.4
μm), this might be less probable.
Positive Controls Induced Proin
flammatory and
Pro
fibrotic Responses in the EpiAlveolar Model. Before
testing the e
ffects of aerosol exposure to nanomaterials, it was
first necessary to demonstrate that a profibrotic phenotype
could be induced in the EpiAlveolar tissues. Toward this goal,
barrier function, tissue morphology, and pro
fibrotic markers
Figure 2. Characterization of EpiAlveolar model response. (a) Transepithelial electrical resistance value for untreated tissues and tissues upon exposure to TGF-β. Data are presented as mean ± standard deviation, n = 3. Data marked with # were considered statistically significantly decreased (p < 0.05). (b) Hematoxylin and eosin staining showing the thickness of the untreated tissues, and nodule formation and tissue contraction upon exposure to TGF-β. (c) Fluorescent micrographs of untreated and TGF-β treated tissues (scanned in two different areas) presenting α-SMA (red) and fibronectin (green) expression, as well as nodule formation, upon exposure to TGF-β. Fibrotic response of tissues upon exposures to TGF-β compared to untreated tissues: (d) fibronectin release; (e) COL1 release; data presented as cumulative dose during 21 days, mean± standard deviation, n = 3. Data marked with * were considered statistically significantly increased (p < 0.05). Data obtained in Laboratory 1.
were assessed following treatment with TGF-
β, a known
chemical inducer of
fibrosis.
34,56−59To ensure the
reproduci-bility of the result, characterization experiments were
conducted independently in three laboratories (MatTek
Corp. (Laboratory 1), Adolphe Merkle Institute (Laboratory
2), and Heriot-Watt University (Laboratory 3)).
After approximately 12 days of 10 ng/mL TGF-
β treatment,
EpiAlveolar tissues began to contract away from the Transwell
insert and round up. This contraction resulted in reduced
TEER and, subsequently, complete loss (statistically significant
decrease,
∼10 Ω·cm
2) of TEER at day 21 (
Figure 2
a, data from
Laboratory 1). Conversely, the untreated tissues maintained
barrier function for 21 days, with no signi
ficant difference
between the two untreated conditions (
∼1000 Ω·cm
2). Similar
to Laboratory 1, there was an evident drop in TEER upon
exposure to TGF-
β compared to untreated cells at day 21 in
Laboratory 2 and at days 12 and 21 in Laboratory 3
(
Supplementary Figure 3
).
Homeostasis in the lung tissue depends on tightness of the
alveolar lining layer to provide a tight barrier against inhaled
foreign substances (e.g., microorganisms and particulate
matter).
60Treatment of EpiAlveolar with TGF-
β abolished
the TEER after day 7. In comparison, untreated tissues
sustained a TEER of 1000
Ω·cm
2, indicating an intact barrier
for the entire duration of the experiment (21 days). It was
previously shown that primary human ATI cells can develop
resistance between 1000 and 2000
Ω·cm
2when cultured in
vitro,
51which correlates with our results over the entire 3 week
period in culture at the ALI and was con
firmed in three
independent laboratories. Treatment with MWCNTs and
DQ12 showed a slight decrease in TEER after 21 days, but
clear conclusions could not be drawn because of variability
between the readings.
EpiAlveolar tissues began showing a slightly denser ECM
around 7 days of treatment as shown in the H&E-stained cross
sections. By 12 days of treatment, large nodules of tissue were
visible, likely due to tissue contraction and increased ECM
deposition (data not shown, data from Laboratory 1). These
nodules were more prevalent at day 21 of TGF-
β treatment,
and the centers of the nodules began to look somewhat
necrotic, perhaps due to their large size (
Figure 3
b).
Furthermore, TGF-
β-treated tissues exhibited increased
expression of
α smooth muscle actin (α-SMA,
Figure 2
c), a
major constituent of the contractile apparatus found in
Figure 3. Exposure scenario and characterization of investigated particles inside the VITROCELL Cloud exposure chamber. (a) MDM seeding and exposure scenario. MDMs were seeded every Sunday (days (D) 1, 6, and 13) prior to starting each week of exposures. EpiAlveolar tissues (with (+) and without (−) MDMs) were exposed every working day from Monday to Friday (5 times per week) for 3 consecutive weeks. For each experiment, the exposure chamber was wiped and the medium in the exposure chamber was changed between exposures. (b) TEM micrographs of deposited particles (DQ12, Nanocyl, and Mitsui-7) on TEM grids placed at the bottom of the VITROCELL Cloud exposure chamber. Upper line corresponds to deposited amount of particles in 1 day; lower line corresponds to overall deposition during whole experiment, that is, after 3 weeks (15 days of exposures). Data obtained in Laboratory 2.
myo
fibroblasts during wound healing and fibrosis, compared to
untreated cells. The contracted tissue morphology following
TGF-β was not evident in Laboratory 2 via laser scanning
microscopy (LSM), which could be due to the technical
di
fficulty of preserving the nodules during tissue preparation.
Laboratory 3 con
firmed the results of Laboratory 1, seeing
contraction and nodule formation following 21 days of TGF-
β
exposure (
Supplementary Figure 3
). It should be noted that
once the tissues started to contract, they were extremely prone
to detachment from the insert membrane.
TGF-
β treatment of EpiAlveolar tissues induced another
hallmark of
fibrosis: increased expression of ECM proteins,
such as
fibronectin and collagen. Immunofluorescence staining
for
fibronectin was increased in the EpiAlveolar tissues treated
with TGF-
β for 21 days compared to untreated tissues (
Figure
2
c). Similarly, the concentration of
fibronectin released into
the tissue culture media was significantly higher in the tissues
exposed to TGF-
β compared to untreated tissues over all
experiments (
Figure 2
d). Secretion of type I,
α-1 collagen
(COL1) was also signi
ficantly increased (p < 0.01) in the
media of TGF-
β-treated tissues as cumulative dose over 21
days (
Figure 2
e). Taken together, these results show that the
positive control, TGF-
β, was able to induce a profibrotic
response in EpiAlveolar tissues.
Characterization of MWCNT and DQ12 Exposures in
Laboratory 2. Following experiments con
firming that the
EpiAlveolar tissues can be cultured long-term and are
responsive to in
flammatory and fibrotic stimuli, the tissues
were evaluated in Laboratory 2 after subchronic exposure to
two MWCNTs, Mitsui-7 and Nanocyl, and the positive
control, silica quartz particles (DQ12).
The EpiAlveolar tissues were exposed to aerosolized
MWCNTs and DQ12 every working day from Monday to
Friday (
five times per week) for three consecutive weeks to
mimic repeated occupational exposure. The scheme in
Figure
3
a depicts the days of exposures, sample collection, and media
changes. The basolateral media samples collected on days 1, 4,
7, 11, 14, 18, and 21 from three experiments were chosen for
analysis based on preliminary data from the
first experiment.
In addition to choosing cell systems relevant to the target
biological site, it is critical to choose test concentrations that
are representative of realistic human exposures. In this study,
particle exposure was performed with the VITROCELL Cloud
system, which allows a dose-controlled and spatially uniform
deposition of aerosolized drugs
61or nanomaterials.
62,63EpiAlveolar tissues were exposed to repeated subchronic
exposures of MWCNTs and DQ12 particles at realistic
concentrations.
Prior to the cell exposures, the particles were carefully
characterized. To visualize dispersed particles, prior to further
exposures (nebulization), the liquid stock solutions of
MWCNTs and DQ12 were pipetted onto transmission
electron microscopy (TEM) grids and visualized using TEM
(
Supplementary Figure 4
). To investigate the material
deposited within the exposure chamber (VITROCELL
Cloud), a TEM grid was placed in the bottom of the exposure
chamber, and the deposited material was imaged by TEM
following one aerosol exposure (day 1 dose) and 15 exposures
(day 21 dose) (
Figure 3
b). The representative TEM images of
aerosolized particles (Mitsui-7, Nanocyl, and DQ12) present a
homogeneous and dose-dependent deposition comparing day
1 and day 21. Furthermore, Mitsui-7 appears as singlets or
small bundles of thicker tubes, while Nanocyl are shorter and
thinner tangled tubes. DQ12 showed single particle deposition
at day 1 and some aggregated particles at day 21, resulting
from repeated particle deposition. The aerosolized particles
were well distributed on the TEM grid surface because of
single droplet deposition, and it was observed that
aerosoliza-tion did not a
ffect particle size or shape. These results
demonstrate that the VITROCELL Cloud system is suitable
for aerosol exposure of such materials and that the dispersed
materials demonstrate similar characteristics as the suspension
materials.
In addition to the qualitative assessment of deposited
material using TEM, the daily deposition was quanti
fied using
a quartz crystal microbalance (QCM). It was not technically
possible to measure the repeated exposure doses (every
working day during 3 weeks) via QCM, because only one
device is available in our laboratory and several exposures of
different materials were performed daily. Therefore, each daily
exposure was measured, and the average deposition was
multiplied by number of exposures to estimate the weekly
(
×5) or total (×15) deposition (
Supplementary Figure 5
).
Daily depositions of Mitsui-7 (2 di
fferent doses were
investigated) were therefore estimated to be
∼0.9 μg/cm
2and
∼2 μg/cm
2, while total depositions increased to
∼13.5 μg/
cm
2and
∼29.6 μg/cm
2. Nanocyl daily deposition was
∼1 μg/
cm
2and total deposition reached
∼15.2 μg/cm
2, and DQ12
daily deposition was
∼0.2 μg/cm
2while total deposition
increased to
∼2.7 μg/cm
2. The depositions were reproducible
among di
fferent wells within the chamber (∼4.3% as
previously shown
61) as well as in a day-to-day manner.
The alveolar mass retention of a full working lifetime
exposure (45 years) to CNTs of di
fferent sizes was modeled
and calculated to be in the range of 12.4 to 46.5
μg/cm
2.
64Herein, the maximal deposited concentration for Nanocyl was
15
μg/cm
2, and those for Mitsui-7, two concentrations were
tested, resulting in 15
μg/cm
2and 30
μg/cm
2, respectively,
within the 3 weeks of repeated exposures. The applied doses
are in the range of the reported lifetime human exposure to
MWCNTs;
64however, we still have to keep in mind that we
only assess the e
ffects within 3 weeks. On the other hand, the
lowest applied concentration (1
μg/cm
2) for Mitsui-7 and
Nanocyl corresponds with concentrations used in mice in
vivo.
14,46Moreover, the positive particle control DQ12
(crystalline quartz) has previously been used in vitro to
stimulate the proin
flammatory response
35−37and in vivo to
stimulate the development of
fibrosis.
38,65In our studies,
aerosolization of DQ12 resulted in an average deposited
concentration of
∼0.2 μg/cm
2, and after repeated exposures,
the concentration was
∼2.7 μg/cm
2. Applied concentrations
correspond to those used in previous in vitro studies that
resulted in a proin
flammatory response.
35,66Furthermore,
these concentrations are comparable to in vivo experiments in
rats (3−30 mg/rat;
38which corresponds to 0.6−6 μg/cm
2,
deposition calculated based on ref
67
).
Coculture of EpiAlveolar with Macrophages
(Labo-ratory 2). It has been demonstrated that macrophages
obtained from patients with lung
fibrosis overproduce
proin
flammatory cytokines and growth factors such as
TNF-α, IL-1, and TGF-β.
68Therefore, to understand the role of
macrophages in
fibrosis development, we cocultured
Epi-Alveolar tissues with MDMs. Fresh MDMs were seeded each
week (schematic marking days of seeding in
Figure 3
a) on the
apical surface of the EpiAlveolar tissues ((+) MDMs), and the
response was compared to tissues without MDMs ((
−)
MDMs). MDM localization within the tissue was visualized via
anti-macrophage mannose receptor (also known as CD206)
staining using LSM. It was observed that MDMs are still
present in tissues after 21 days of exposures (
Supplementary
Figure 6
). Exposures to DQ12 and Mitsui-7 do not a
ffect the
presence of MDMs (
Supplementary Figure 5b,c
) compared to
bovine serum albumin (BSA)-treated samples (
Supplementary
Figure 5a
), and they are located on the apical side of the
EpiAlveolar tissues (
Supplementary Figure 6d
).
Particle Interaction with EpiAlveolar and Their E
ffect
on Barrier Tightness (Laboratory 2).
Fluorescence-enhanced dark-
field imaging was used to visualize the
distribution of Mitsui-7 in the EpiAlveolar tissues with (+)
and without (
−) MDMs at D21. Representative 3D rendered
images (
Supplementary Figure 7a,c
) and xy projections
(
Supplementary Figure 7b,d
) show that the Mitsui-7 (white
arrows pointing to Mitsui-7) are associated with cells within
the EpiAlveolar tissues (+) and (−) MDMs. No difference in
Mitsui-7 locations was observed when comparing tissues (+)
and (
−) MDMs. Since the tissues were grown on
poly-(ethylene terephthalate) (PET) membrane inserts, a strong
scattering of the insert pores resulted in artifacts
(round-shaped green objects), and Nanocyl and DQ12 particles did
not provide enough contrast to be visualized. Therefore,
further experiment was performed. Fixed tissues were scraped
using a cell scraper, resuspended in Kaiser
’s glycerol, and
dropped on a glass slide. As-prepared samples were visualized
using
fluorescence-enhanced dark-field imaging. We could
clearly confirm the presence of all tested materials with cells
extracted from the tissue (
Figure 4
). The cell type, however,
could not be determined by this method.
As barrier integrity is an important feature of epithelial cells,
tight junctions of EpiAlveolar tissues (
−) MDMs were
visualized via zonula occludens 1, a tight junction protein,
69after 21 days of exposures (
Figure 4
). Exposures to DQ12 and
Nanocyl did not a
ffect tight junction formation. Exposures to
Mitsui-7 a
ffected formation of tight junctions; they appear
weaker. It is worth mentioning, that the surface of EpiAlveolar
is not
flat and therefore we can observe patches with and
without tight junctions.
No Cytotoxicity Was Observed upon Material
Exposure (Laboratory 2). Cytotoxicity (lactate
dehydrogen-ase (LDH) reledehydrogen-ase) was investigated in response to particle
(Mitsui-7, Nanocyl, and DQ12) exposures. No statistically
signi
ficant (p > 0.05) increase in LDH release into the
basolateral media was observed for all tested materials at days
7, 14, and 21 in both (+) and (−) MDMs tissues
(
Supplementary Figure 8
).
Cellular Morphology Was Signi
ficantly Altered upon
Exposure to TGF-
β (Laboratory 2). EpiAlveolar tissues (−)
MDMs were treated with Mitsui-7 (daily deposition
∼2 μg/
cm
2) and imaged using LSM to observe cell morphology. No
overt changes in epithelial cell or
fibroblast morphology were
evident when compared to negative control (BSA treatment)
(
Supplementary Figure 9
). However, gaps or holes in the
endothelial cell layer were observed in the Mitsui-7-exposed
tissues. Exposures to DQ12 and Nanocyl showed a similar
pattern, but loss in endothelial cell continuity was less obvious
(data not shown). The TGF-
β treatment [50 ng/mL] led to
changes in all cell types; they lost their regular shape, became
disorganized, and lost cell
−cell contact, which caused
discontinuity of the cellular layer on both sides of the insert.
Release of Proin
flammatory Mediators Was
Signifi-cantly Increased upon Exposures to Positive Controls,
DQ12, Nanocyl, or Mitsui-7 in Laboratory 2 (KE 1).
TNF-α, IL-1 family cytokines, IL-6, and IL-8 are proinflammatory
mediators that play important roles in local injury and
in
flammatory reaction in development of human pulmonary
fibrosis.
70,71The release of these cytokines was assessed by
Enzyme Linked Immunosorbent Assay (ELISA) following
treatment of EpiAlveolar tissues with the positive controls
(TNF-
α, lipopolysaccharide (LPS), or TGF-β) or with
particles (
Figure 5
and
Supplementary Figures 10 and 11
).
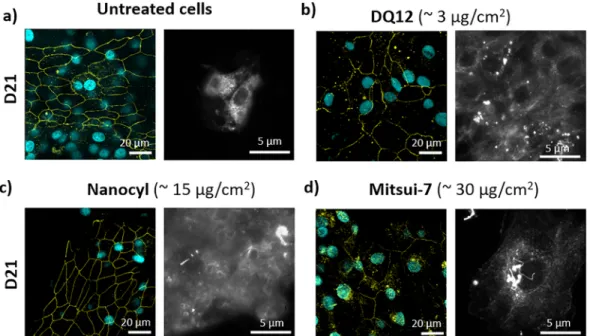
Figure 4. Representative laser scanning microscopy images presenting tight junctions of tissue and enhanced dark-field microscopy images showing interaction of investigated materials with cells. Tight junctions (left) and enhanced dark-field image (right) of tissue at day 21: (a) untreated cells, (b) DQ12-treated, (c) Nanocyl-treated, and (d) Mitsui-7 (higher dose)-treated. Cyan represents nucleus; yellow represents tight junctions (ZO-1). Data obtained in Laboratory 2.
Tissues exposed to in
flammatory positive controls (LPS and
TNF-
α) showed general response following the
proinflamma-tory cascade;
71that is, TNF-
α resulted in earlier response in
IL-8 release, while tissues treated with LPS showed an increase
in IL-8 production at later time points. No increase in TNF-
α
and IL-6 release was observed at D21, interestingly IL-6 release
was signi
ficantly increased upon exposures to all positive
controls (LPS, TNF-α, and TGF-β) at most of the time points
(Days 1
−18). On the other hand, tissues showed a statistically
signi
ficant increase in all investigated cytokines released after
exposure to Mitsui-7. In general, lower concentrations (
∼1 μg/
cm
2) induced a proin
flammatory response at a later time point
(Day 11), while the higher concentration (
∼2 μg/cm
2)
induced a proin
flammatory response as early as Day 1.
Nanocyl induced, in general, a less pronounced reaction than
Mitsui-7, a
finding consistent with previously published results
investigating the response of 2D monocultures of epithelial
cells,
fibroblasts, or macrophages in vitro.
41Similar results were
published also from in vivo study, where intratracheally instilled
Nanocyl showed a
fibrotic response 28 days postexposure in
mice, which was less pronounced compared to longer
MWCNTs with higher diameter.
44The EpiAlveolar tissues
with added MDMs presented the proin
flammatory response at
later time points (days 14 and 18), which could indicate that
MDMs initially reduced exposure to particles by clearance
from the ALI surface of the epithelial cells, but over time, they
released either the material or proin
flammatory mediators,
which stimulate the epithelial cells, so that the response is
delayed. This indicates that MDMs are able to counterbalance
the immune reaction to a certain extent until the response
becomes uncontrolled. It has been reported from in vivo
studies in mice that an acute in
flammatory phase response
started 1 day after exposure to 40
μg of Mitsui-7, peaked 7 days
after aspiration, and was always increased compared to
negative control for all investigated time points, up to 56
days.
14Although in this study the tissues showed a statistically
Figure 5. Tumor necrosis factorα (a−f) and interleukin 1β (g−l) release as a marker of proinflammatory response from tissues without macrophages and with macrophages. Data are presented as relative to negative control (dashed line); untreated cells served as negative control for positive control-treated cells (a, b, g, h), and DQ12 treated tissues (c, d, i, j), while BSA-treated cells served as negative control for MWCNT-treated cells (e, f, k, l). Data are presented as mean± standard deviation, (n = 3). Data marked as with * were considered statistically significantly (p < 0.05) increased compared to negative control. Data obtained in Laboratory 2.
signi
ficant increase in cytokine release after exposure to both
Mitsui-7 and Nanocyl, the response did not show a clear dose
or time dependence. Future studies could normalize ELISA
results to cell numbers to decrease the variability observed in
cytokine release.
In EpiAlveolar tissues (−) MDMs, the positive particle
control DQ12 induced signi
ficant TNF-α, IL-1β, and TGF-β
release. This response is comparable to a previous study, where
in vitro bronchial cells (without MDMs) from healthy
(nonasthmatic) donors developed a signi
ficant
proinflamma-tory (IL-8) response after 3 weeks of exposures while the cells
from asthmatic donors showed an increase in TGF-
β release
after 5 weeks of repeated exposures to DQ12.
35An in vivo
study revealed that mice and rats exposed to DQ12 developed
chronic inflammation and intense lung fibrosis.
38Interestingly,
we observed only proin
flammatory increase in IL-8 release at
day 1 and in IL-6 at day 21 upon exposures to DQ12 in the
presence of MDMs and at days 4 and 7 without MDMs.
The
fluctuation of TNF-α and IL-1β release can be
compared with in vivo data investigating gene expression
upon exposure to carbon black nanoparticles. TNF-
α receptor
superfamily was up-regulated at days 1, 3, 14, and 42, while
IL-1 receptor was up-regulated at 3 h and days IL-1, 2, and IL-14.
72As
gene expression and protein release do not happen at the same
time, we believe that correlation of our data with these results
is very important. However, further studies are needed to
confirm the correlation.
In summary, concentrations of overall release of TNF-
α,
IL-1
β, IL-6, and IL-8 were in the same range for both (+) and (−)
MDMs tissues (
Supplementary Figures 13
−16
).
Pro
fibrotic mediators are released after positive
control, DQ12, Nanocyl, and Mitsui-7 Exposures in
Laboratory 2 (KEs 1
−4). Since chronic inflammation can
trigger a pro
fibrotic response, we used ELISA to investigate
secretion of the pro
fibrotic markers, TGF-β (
Figure 6
a
−f),
fibronectin (
Supplementary Figure 12
), and COL1 (
Figure
6
g
−l).
Figure 6. Transforming growth factorβ (a−f) and collagen type 1α1 (g−l) release as a marker of profibrotic response from tissues without macrophages and with macrophages. Data are presented as relative to negative control (dashed line); untreated cells served as negative control for positive control-treated cells (a, b, g, h) and DQ12 treated tissues (c, d, i, j), while BSA-treated cells served as negative control for MWCNT-treated cells (e, f, k, l). Data are presented as mean± standard deviation, (n = 3). Data marked with * were considered statistically significantly (p < 0.05) increased compared to negative control. Data obtained in Laboratory 2.
Several in vivo studies reported that Mitsui-7 exposures
resulted in lung
fibrosis
12−14,73as indicated by increased
thickness of connective tissue in the alveolar region. In vitro
investigation of 3D microtissues (combination of THP-1
macrophages,
fibroblasts, and BEAS-2B epithelial cells)
showed changed microtissue morphology and signi
ficant
increase in gene expression of IL-1
β and collagen types I
and III, upon exposure to Mitsui-7 after 4 and 7 days.
74This is
in agreement with our observations after treatment with
TGF-β, as gradual thickening and contraction of tissues was
observed at later time points (day 21); while Laboratory 2
observed only thickening of the tissues, Laboratories 1 and 3
observed also contraction of the tissue with nodule formation.
Tissue contraction led to detachment and loss of cells from the
membrane at day 14. An increase in
α-SMA and fibronectin
was also observed after treatment with TGF-
β at all tested
concentrations after 21 days. Similarly, the positive particle
control DQ12 induced signi
ficant increase in fibronectin
production at day 21, and in COL1 production occurred at
days 1, 14, and 21. EpiAlveolar tissues exposed to Nanocyl
resulted in a statistically signi
ficant increase in fibronectin
production at days 4 and 21 and in COL1 production at days
4, 7, and 21. COL1 and
fibronectin release was significantly
increased at day 4 upon exposures to Mitsui-7 (at both lower
(
∼1 μg/cm
2) and higher (
∼2 μg/cm
2) concentrations).
Furthermore, COL1 production was increased at days 7 and
14 (at both lower (
∼1 μg/cm
2) and higher (
∼2 μg/cm
2)
concentrations), and at day 11 at lower (
∼1 μg/cm
2)
concentration. Fibronectin release was signi
ficantly increased
at days 14 and 18 (at the higher concentration) and days 18
and 21 (at the lower concentration).
All ELISA results (TNF-
α, IL-1β, IL-6, IL-8, TGF-β,
fibronectin, and COL1) presented in absolute values
(including all investigated positive controls) can be seen in
Supplementary Figures 13
−19
. Statistical analysis of these data
is presented in
Supplementary Tables 1
−7
.
Epithelial Barrier Integrity Decreased upon Exposure
to TGF-
β but Was Stable upon DQ12 and MWCNT
Exposures (Laboratory 2). TEER was measured to assess
barrier integrity of the EpiAlveolar tissues following exposures
to test materials and controls. The TEER values remain high
up to day 21 in untreated EpiAlveolar tissues (+) and (
−)
MDMs (
Supplementary Figure 20
). For the di
fferent material
treatments, TEER was only measured after day 21 to avoid the
potential removal of particles from the surface (
Supplementary
Figure 19
). Although a drop in TEER values upon exposure to
TGF-
β can be observed, no statistically significant decrease (p
> 0.05) in TEER values was observed for both (
−) and (+)
MDMs tissues, likely because of the high standard deviation of
untreated tissues. Future studies are needed to identify the
sources of variability in measuring TEER as it is one of the
important assays to assess barrier integrity.
To con
firm TEER results, LSM xz projections were used to
assess the cellular layer integrity of EpiAlveolar tissues (+) and
(
−) MDMs after 21 days of treatments with different materials.
During
fibrosis, fibroblasts undergo excessive proliferation and
there is increased ECM deposition.
75The (
−) MDMs tissues
show only a negligible increase in cellular layer thickness after
DQ12 (daily deposition
∼0.2 μg/cm
2) and Mitsui-7 (daily
deposition
∼2 μg/cm
2) treatment compared to BSA-treated
cells. Interestingly, the (+) MDMs tissues showed an increase
in the cellular layer thickness upon exposures to DQ12 (daily
deposition
∼0.2 μg/cm
2) and Mitsui-7 (daily deposition
∼2
μg/cm
2) compared to BSA-treated cells (
Supplementary
Figure 21
).
CONCLUSION
This study characterizes a 3D in vitro alveolar tissue model
comprised entirely of primary human cells to investigate its
ability to predict pulmonary
fibrosis. We demonstrated that the
EpiAlveolar model recapitulates relevant lung phenotypes and
functions and is stable at the ALI for at least 3 weeks. Future
studies with EpiAlveolar could assess additional substances and
the effectiveness of antifibrotic agents and the impact of human
originated serum albumin to determine species-speci
fic effects.
As with all studies, cause and effect analysis should be
considered for all the protocols used to identify potential
sources of variability (e.g., procedural variations or differences
between chemicals and assays based on their manufacturer).
73Additionally, transitioning the EpiAlveolar model to chemically
de
fined medium could increase the experimental
reproduci-bility. This careful consideration will help maximize inter- and
intralaboratory reproducibility and will be especially important
as this model is considered for incorporation into international
standards that may be used for regulatory testing.
METHODS
The handling and ability of the EpiAlveolar model to developfibrosis end points upon exposure to the positive control (TGF-β) was confirmed in three laboratories. Afterward the particle studies were only done in Laboratory 2, which had access to the VITROCELL Cloud aerosolization system.
Characterization and Assessment of EpiAlveolar System Conducted at MatTek Corporation (Laboratory 1). Human Primary Cells Coculture Model MatTek EpiAlveolar. EpiAlveolar (MatTek Corporation, Massachusetts, USA) is a new, commercially available, organotypic model of the human alveolar tissue that is grown at the ALI. To produce the tissues, human endothelial cells are seeded onto the basal side of a microporous PET membrane insert (pore size 0.4 μm, Corning Costar 3460). Then, primary human fibroblasts and alveolar epithelial cells are seeded on the apical side of the insert membrane. EpiAlveolar tissues are produced from primary cells of lung origin from a disease-free, nonsmoking, 50 year old, male Caucasian donor. Once the tissues were fully differentiated, they were either shipped to Laboratory 2 for aerosol exposures or used at Laboratory 1 for characterization and optimization of the TGF-β control treatment. The tissues were fed every other day (Monday, Wednesday, and Friday) with 5 mL of media (MatTek Corp, part no. ALV-100-M250) in the basal compartment and 75μL of media on the apical surface, following the manufacturer’s protocol. When beginning the experiments, tissues were switched from fully supplemented media to media without the proprietary supplement “X”, which the manufacturer has found to ablate the profibrotic effects induced by TGF-β.
Transepithelial Electrical Resistance (TEER). TEER was assessed at MatTek Corporation using an EVOM2 voltohmmeter and the EndOhm-12 culture cup chamber (World Precision Instruments, Florida, USA). Tissues were rinsed once with phosphate buffer saline (PBS) containing calcium and magnesium (MatTek Corp., part no. TEER-BUFFER) and transferred to the EndOhm-12 chamber containing PBS (2 mL of PBS in the basal compartment and 0.5 mL in the apical compartment), and the raw resistance reading was recorded after it had stabilized. Using Microsoft Excel, a background reading of PBS alone was subtracted from the raw resistance values, and the background subtracted value was multiplied by the surface area (1.12 cm2). Two to four separate tissues were measured for each
condition at each time point, and the mean and standard deviation across independent experiments was calculated. A TEER value greater than or equal to 300 Ω·cm2 was considered to indicate an intact
Hematoxylin and Eosin and Immunofluorescene Staining of EpiAlveolar Tissues. Tissues taken for histology and immuno fluor-escence werefixed overnight at room temperature in 10% buffered formalin (Sigma-Aldrich, Switzerland). Tissues were then rinsed with PBS, processed following standard practices, embedded in paraffin wax, sectioned, and adhered to slides.76−79 Sections of each tissue were stained by H&E to assess tissue morphology. An Olympus VS120 Virtual Slide microscope (Olympus, Japan) was used to acquire images of the stained slides.
Immunofluorescent staining was conducted for α-SMA, fibronectin, CK8, CK19, and VIM. Slides were placed in 0.05% citraconic anhydride in water, pH 7.4, and warmed for 45 min for antigen retrieval. After cooling, the slides were rinsed with tris-buffered saline (TBS) and blocked with 10% goat serum/1% BSA/TBS for 1 h at room temperature. Primary antibodies (Abcam, MA, USA, and Millipore, MA, USA) diluted in 1% BSA/0.1% Tween-20/TBS were applied to the slides for 1 h in a humidified chamber at room temperature. After this time, slides were washed, and the appropriate secondary antibodies were applied (Invitrogen, California, USA) for 1 h. Nuclei were stained with DAPI (4′,6-diamidin-2-phenylindol), and after additional wash steps, coverslips were mounted with immunomount (Thermo Fisher Scientific Inc., MA, USA). All stained slides were imaged using an Olympus IX81 confocal microscope with Fluoview FV1000 (Olympus, Japan).
To determine the formation of tight junctions, EpiAlveolar tissues werefixed in formalin for 10 min, then blocked with 10% goat serum and 0.1% Triton X-100 for 1 h. Tissues were then incubated with rabbit anti-ZO-1 (Zonula Occludens-1, Invitrogen no. 61-7300, Carlsbad, CA, USA), diluted 1:100 in PBS + 1% BSA and 0.1% Tween-20, for 2 h at RT. Tissues were rinsed in 10% goat serum + Triton-X-100 and incubated in goat anti-rabbit Alexa Fluor 555 (Invitrogen) diluted 1:400 for 1 h at RT, followed by washing in PBS and counterstaining with DAPI for 10 min. ZO-1 was imaged using an Olympus IX81 microscope equipped with a FV1000 confocal system and FV10-ASW software package.
Transmission Electron Microscopy (TEM) of EpiAlveolar (Performed in Laboratory 2). In order to visualize lamellar bodies present in EpiAlveolar tissues, the tissues were fixed in 2.5% glutaraldehyde (Agar Scientific, Stansted, Essex, UK) in 0.15 M HEPES (Fluka, Buchs, Switzerland) with an osmolarity of 670 mOsm and adjusted to a pH of 7.35. The cells remained in thefixative at 4 °C for at least 24 h before being further processed.
The tissues were then washed with 0.15 M HEPES three times for 5 min, postfixed with 1% OsO4 (EMS, Hatfield, USA) in 0.1 M sodium cacodylate buffer (Merck, Darmstadt, Germany) at 4 °C for 1 h. Thereafter cells were washed in 0.05 M maleic acid/NaOH buffer three times for 5 min and dehydrated in 70%, 80%, and 96% ethanol (Alcosuisse, Switzerland) for 15 min each at room temperature. Subsequently, cells were immersed in 100% ethanol (Merck, Darmstadt, Germany) three times for 10 min, and then they were submerged in ethanol−Epon (1:1) overnight at room temperature. The next day, cells were embedded in Epon (Fluka, Buchs, Switzerland) and left to harden at 60 °C for 5 days. Ultrathin sections (70−80 nm) were produced with an ultramicrotome UC6 (Leica Microsystems, Vienna, Austria), mounted on single slot copper grids, and stained with uranyless and lead citrate with an ultrostainer (Leica Microsystems, Vienna, Austria). TEM grids with mounted sections were used without any further treatment. Representative images were captured using a TEM (Fei Technai Spirit, Oregon, USA) operating at 120 kV and equipped with a Veleta CCD camera (Olympus, Japan). Images were recorded at a resolution of 2048× 2048 pixels.
Surface Tension of the EpiAlveolar Tissues at the ALI. The surface tension was calculated based on a previously described protocol.54 Briefly, EpiAlveolar tissues were rinsed with PBS containing Ca and Mg and then left at the ALI without apical media for 48 h before measurement. Small droplets of dimethylphthalate/normal octanol (Fluka) 4:1, v/v ratio, stained with 4 mg/mL of crystal violet (Sigma) to facilitate visualization of the test droplets were dropped on the apical side of EpiAlveolar tissues with a syringe. The method is based
on the fact that the diameter of the deposited droplet decreases with decreasing surface tension and vice versa. Therefore, surface tension of the hypophase was estimated by the ratio of the area (d) of the deposited droplet on the apical surface of cells (either A549 cells as a control52 or EpiAlveolar tissues) and the area (d0) of the droplet
measured prior to deposition (i.e., still attached to the micropipette,
Supplementary Figure 2c, referred as a hanging droplet). To measure the droplet areas, photographs of the droplets were taken with a digital camera. The surface tension was subsequently calculated using a calibration curve (previously published for thin liquid substrates53) to evaluate the relationship between the d/d0 ratio and the surface
tension of the cell surface.
Profibrotic Response to TGF-β. TGF-β was prepared according to the manufacturer’s protocol (PeproTech, Inc., NJ, USA) at a stock concentration of 10μg/mL in citric acid/BSA/PBS and stored at −20 °C. A new aliquot of TGF-β stock was thawed and added to the EpiAlveolar media fresh before each treatment.
Basolateral media samples were collected from the same individual tissues before every media change. The samples were analyzed for COL1,fibronectin, and TNF-α concentration using a Luminex kit according to the manufacturer’s instructions (R&D Systems, Minnesota, USA). All kit reagents were prepared as outlined in the manufacturer’s protocol. Conditioned media samples were diluted at 1:50 for COL1 andfibronectin analysis and were left undiluted for TNF-α analysis to fall within the range of the standard curve. The media samples were mixed with the microparticle cocktail in duplicate wells of 96-well plates and incubated for 2 h on an orbital shaker. The samples were then washed on a magnetic plate washer to remove any unbound microparticles. The bound particles were resuspended in the kit’s biotin−antibody cocktail and incubated for 1 h on an orbital shaker. Bound particles were washed, resuspended in Streptavidin-PE, and incubated for 30 min on an orbital shaker. The bound particles were given afinal wash and resuspended in wash buffer to measure on the Bio-Plex Multiplex system (Bio-Rad, California, USA). Data was exported to Microsoft Excel before conducting statistical analyses.
Statistical Analysis. Statistical analyses were conducted using GraphPad Prism 8 software. The mean and standard deviation were calculated across replicate experiments. Statistically significant differ-ences (p ≤ 0.05) were determined using a parametric one-way analysis of variance (ANOVA) with Tukey’s HSD post hoc tests. Three independent experiments (n = 3) were performed.
Investigation of EpiAlveolar Response to Particle Expo-sures Conducted at the University of Fribourg (Laboratory 2). Material Preparation. BSA (0.1% in ultrapure H2O) was sterile
filtered (0.2 μm pore size, Nalgene, Thermo Fisher Scientific, Massachusetts, USA). BSA was used as the negative control for MWCNT-treated cells and as dispersant for the MWCNTs. The extremely hydrophobic properties of the CNTs, together with van der Waals forces and high particle surface area, lead to particle agglomeration in polar solvents.80 Therefore, dispersants (primarily proteins) are used to prevent agglomeration and stabilize the MWCNTs without substantial chemical surface modification.81−84 Both Mitsui-7 MWCNTs (Mitsui-7; Mitsui & Co, Japan) and Nanocyl-7000 MWCNTs (Nanocyl; Nanocyl SA, Belgium; received from European Commission Joint Research Centre, Italy, sample JRCNM4000a), previously characterized within Nanogenotox proj-ect,85 were dispersed in 0.1% BSA.41 Briefly, preweighed dry MWCNT powder was heat sterilized at 100 °C overnight and cooled, and a 50μg/mL stock solution was prepared with 0.1% BSA. This suspension was sonicated using an ultrasonic bath sonicator (Elmasonic P30H, 100 W, 37 kHz, 30% amplitude, Elma Schmidbauer GmbH, Germany) for 3 h with continuous shaking and water cooling to disperse the MWCNTs and subsequently stored at 4°C until use.
Silica Dörntruper quartz particles (DQ12; composed of 87% crystalline silica and amorphous silica with kaolinite impurities, particle size≤5 μm86), reported as a proinflammatory agent,87were used as reference material.
Unlike MWCNTs, DQ12 particles are not hydrophobic; therefore they can be easily dispersed in ultrapure water. Therefore, DQ12
particles were dispersed in ultrapure sterile filtered H2O at a
concentration of 100μg/mL following the same sonication procedure as for MWCNTs above.
All stock suspensions were sonicated for 1 h prior the exposure. Material Characterization. Electron Microscopy. To investigate the deposition of all tested materials, TEM 300 mesh carbon coated copper grids were used. Prepared suspensions were pipetted onto the TEM grids. Additionally, TEM grids were placed into the exposure chamber prior to the exposure to visualize the aerosol deposited particles and to compare their appearance with suspended particles.
TEM grids with deposited material were used without any further treatment. Representative images were captured using a TEM (Fei Technai Spirit, Oregon, USA) operating at 120 kV and equipped with a Veleta CCD camera (Olympus, Japan). Images were recorded at a resolution of 2048× 2048 pixels.
Endotoxin Content. The endotoxin concentration in the MWCNTs and DQ12 suspensions was measured using the Pierce LAL Chromogenic Endotoxin Quantitation kit (Thermo Fisher Scientific, Massachusetts, USA), following the manufacturer’s instructions, and all suspensions were below 0.5 EU/mL. In order to avoid the artifacts resulting from interference of the material with an assay, three different concentrations of each particle suspension were tested, and the results were compared among each other.
Coculturing EpiAlveolar with Human Monocyte-Derived Macro-phages (MDMs). Peripheral human blood monocytes were isolated from human blood buffy coats (Blood Donation Service, Bern University hospital, Switzerland), as previously described by Lehmann et al.88 with subsequent CD14+ MicroBead separation (Miltenyi
Biotec GmbH, Germany) according to the manufacturer’s protocol. Fresh monocytes were frozen for future use at a density of 6× 10⁶
cells/mL in 90% fetal bovine serum (FBS, Gibco, Maryland, USA) and 10% dimethyl sulfoxide serving as cryopreservative. The cells were transferred to Nalgene Mr. Frosty Cryo 1°C Freezing container (−1 °C/min cooling rate, Thermo Fisher Scientific, Massachusetts, USA) and placed in a−80 °C freezer, the vials were transferred to liquid nitrogen tank the following day. Monocytes were later thawed quickly in a 37 °C water bath and, before all the ice disappeared, diluted with 10 volumes of warmed FBS and subsequently centrifuged (200g, 5 min). The FBS supernatant was aspirated, and cell pellet was resuspended in supplemented Roswell Park Memorial Institute 1640 (RPMI) medium (with 10% FBS, 1% penicillin/streptomycin
(corresponds to 100 units/mL penicillin and 100 μg/mL
streptomycin), and 2 mML-glutamine (all Gibco, Maryland, USA)) and subsequently cultured for 6 days with the macrophage-colony stimulating factor (M-CSF, [10 ng/mL]) prior assembling the coculture at a density of 106 cells/mL. The cocultures (+) MDMs
were assembled by gently pipetting MDMs in supplemented RPMI (0.5 mL/insert) on top of the EpiAlveolar tissues (cultured in MatTek medium, 5 mL in the basal compartment) at a density of 5× 10⁴
MDMs/cm224 h prior to thefirst exposure. Tissues were transferred
to ALI conditions by removing media from apical side of the insert and replacing the basal medium with 3 mL of MatTek cell culture medium prior to thefirst exposure.
As MDMs do not proliferate and the lifetime in culture is limited, fresh batches of MDMs from the same donor were reseeded every 7 days (on day 6 and day 13).Figure 3shows the exposure scheme together with days of seeding MDMs. The medium from the upper compartment was removed the following morning (days 7 and 14) prior to further exposures. Three independent repetitions of the experiment were performed; therefore monocytes from three different donors were used, that is, one donor per repetition.
Air−Liquid Interface Exposures to MWCNTs and DQ12. Tissues were exposed at the ALI using the VITROCELL Cloud system. Briefly, the exposure system consists of a nebulizer, an exposure chamber, and a QCM (operated at 5 MHz (Mega Hertz), detection limit 0.1 μg/cm2), allowing online measurements of the deposited
dose. For each nebulization, 200μL of stock solution with 2 μL of 0.09% NaCl (NAAPREP physiological saline, GlaxoSmithKline, France) was added to the nebulizer (a vibrating mesh with a span of 2.5−6.0 μm volumetric mean diameter (for DQ12 sample) or 10
μm volumetric mean diameter (for all the other samples)), Aeroneb Lab, Ireland). The vibrating perforated membrane at the neck of the nebulizer generates the aerosol into the exposure chamber. Inside the chamber, the aerosolized sample gently deposits onto the tissue surfaces maintained at the ALI. Theflow rate is ideal for the aerosol to sufficiently mix to all sides of the chamber, hence resulting in uniform droplet deposition. One single exposure, that is, daily exposure to single particle dose, takes approximately 10−15 min.
Cells were exposed apically at the ALI daily and kept at 37°C in 5% CO2throughout the whole exposure period. Tissues were exposed
every working day (Monday−Friday) for 3 consecutive weeks. Media was collected every Monday, Wednesday, and Friday (days 2, 4, 7, 9, 11, 14, 16, 18, and 21); furthermore the medium was also collected at day 1.
Particle Interaction with EpiAlveolar. To investigate the interaction of Mitsui-7 within the EpiAlveolar tissues, the samples prepared for LSM analysis (see below) were also scanned using a 100× objective lens (numerical aperture 0.6 and 1.2) in Cytoviva dual mode fluorescence-enhanced dark-field microscopy setup (Cytoviva Inc., AL, USA). Because of strong scattering of the inserts, it was not possible to visualize Nanocyl and DQ12, mostly due to their small size. Therefore, the following experiment was performed.
Fixed tissues (cells on cell culture inserts, see below), stored in PBS, were scraped off the insert using a cell scraper, centrifuged (at 10000 g) to remove excess PBS, resuspended in Kaiser’s glycerol gelatin mounting medium (VWR, Switzerland) and dropped on a glass slide. As-prepared samples were visualized using a 100× objective lens (numerical aperture 0.6 and 1.2) in the Cytoviva dual mode fluorescence-enhanced dark-field microscopy setup (Cytoviva Inc., AL, USA) to investigate the interaction of the particles with the cells. Using this method, it is not possible to determine the cell type nor to distinguish between intracellular or cell membrane associated particles.
Cytotoxicity. LDH release into the tissue culture media as a result of cell membrane rupture is a well-known indicator of cytotoxicity. The amount of LDH release was evaluated using a commercially available LDH diagnostic kit (Roche Applied Science, Germany), according to the manufacturer’s protocol. Each sample was measured in triplicate. LDH values are presented relative to the untreated cells. Cell cultures exposed apically to 0.2% Triton X-100 (100 μL, submerged) for 24 h were used as a positive control for cell death. Basal medium only was collected, therefore no interference of the material with assay should occur. However, all materials were tested for potential interference with the assay; no interference was observed (data not shown).
Transepithelial Electrical Resistance (TEER). TEER measurement is used to assess the cell barrier integrity. Tissues grown on membrane inserts were washed with PBS with calcium and magnesium (TEER-BUFFER, MatTek Corporation), and TEER was measured using chop-stick Millipore equipment (Millicell ERS-2, EMD Millipore Corporation, MA, USA). The TEER measurements were performed on two defined spots of each membrane inserts (3 mL of TEER-BUFFER in lower and 1 mL of TEER-TEER-BUFFER in upper compartment). Resistance values of two empty (without cells) membrane inserts (3 mL of TEER-BUFFER in lower and 1 mL of TEER-BUFFER in upper compartment) were averaged (after two independent sets of measurements) and subtracted from all the values for cell layer samples. The absolute values were multiplied by growth area of membrane inserts (1.12 cm2) and shown in [Ω·cm2].
Laser Scanning Microscopy (LSM). At the end of the experiment (day 21), the tissues werefixed for 15 min in 4% paraformaldehyde in PBS at room temperature, subsequently washed 3 times with PBS, and stored in PBS at 4°C.
Prior to immunofluorescent staining, samples were treated with 0.1 M glycine for 15 min and permeabilized with 0.2% Triton X-100 and 1% BSA in PBS for 15 min, both at room temperature. Antibodies were diluted in 0.1% BSA in PBS and incubated for 2 h with primary antibodies and then 2 h with secondary antibodies. The F-actin cytoskeleton was stained with rhodamine phalloidin (Molecular Probes, Thermo Fisher Scientific Inc., Massachusetts, USA) at 0.264