HAL Id: hal-02147819
https://hal.uca.fr/hal-02147819
Submitted on 5 Jun 2019
HAL is a multi-disciplinary open access
archive for the deposit and dissemination of sci-entific research documents, whether they are pub-lished or not. The documents may come from teaching and research institutions in France or abroad, or from public or private research centers.
L’archive ouverte pluridisciplinaire HAL, est destinée au dépôt et à la diffusion de documents scientifiques de niveau recherche, publiés ou non, émanant des établissements d’enseignement et de recherche français ou étrangers, des laboratoires publics ou privés.
Shock wave propagation in layered planetary interiors:
Revisited
J. Monteux, J. Arkani-Hamed
To cite this version:
J. Monteux, J. Arkani-Hamed. Shock wave propagation in layered planetary interiors: Revisited. Icarus, Elsevier, 2019, 331, pp.238-256. �10.1016/j.icarus.2019.05.016�. �hal-02147819�
1
Shock Wave Propagation in Layered Planetary Interiors: Revisited
1 2
J. Monteux
3
Université Clermont Auvergne, CNRS, IRD, OPGC, Laboratoire Magmas et Volcans, F-63000 4 Clermont-Ferrand, France 5 6 J. Arkani-Hamed 7
Department of Physics, University of Toronto, Toronto, Canada 8
Department of Earth and Planetary Sciences, McGill University, Montreal, Canada 9
10
Abstract. 11
While major impacts during late accretion of a Mars type planet occur on a differentiated body, 12
the characteristics of the shockwave propagation are poorly known within these layered objects. 13
Here, we use iSALE-2D hydrocode simulations to calculate shock pressure in a differentiated 14
Mars type body for impact velocities ranging from 5 to 20 km/s, impactor radii ranging from 50 15
to 200 km, and different rheologies. To better represent the distribution of shock pressure as a 16
function of distance from the impact site at the surface, we propose two distinct regions in the 17
mantle: a near field region that extends to 7-15 times the projectile radius into the target, where 18
the peak shock pressure decays exponentially with increasing the distance from the impact site, 19
and a far field region where the pressure decays strongly with the distance following a power 20
law. At the core-mantle boundary, the peak shock pressure increases from the mantle side to the 21
core side. The refracted shockwave travels within the core where the shock pressure decreases 22
following a second power law. In this study, we fit the output obtained from iSALE hydrocode 23
simulations to determine scaling laws that illustrate the influence of the distance from the impact 24
site, the ray angle, the target rheology, the impactor size and the impact velocity. Finally we 25
combine these shock-pressure scaling laws with the formalism proposed by Watters et al. [2009] 26
to determine the impact heating induced by large impacts within a differentiated Mars. 27
28 29 30 31
2
1. Introduction:
32 33
Terrestrial planets are formed by accreting a huge number of planetesimals in the solar nebula 34
[e.g., Chambers and Wetherill, 1998; Kokubo and Ida, 2000; Rafikov, 2003; Chambers, 2004; 35
Raymond, et al., 2006]. The ultimate goal is to investigate the thermal evolution of a growing 36
terrestrial planet while taking into account the impact heating, heating by short-lived and long-37
lived radioactive elements, and by the core formation process. Because partial melting and core 38
formation occur when a protoplanet’s radius exceeds ~2700 km [e.g., Senshu et al., 2002], about 39
47% of Mars’ and 90% of the Earth’s and Venus’ masses are expected to be accreted in the 40
presence of a liquid core. To estimate the thermal state of a growing planet it is necessary to 41
determine the impact heating of its solid mantle and liquid core by each impactor. 42
43
The impact-induced shock pressure and temperature increase inside a planet has been 44
investigated using elaborated numerical models developed to better understand shock physics 45
[e.g., Ahrens and O’Keefe, 1987; Pierazzo et al., 1997; Mitani, 2003; Wuennemann et al., 2006; 46
Wünneman et al., 2008; Ivanov et al., 2010; Bar and Citron, 2011; Kraus et al., 2011; Bierhaus et 47
al., 2012; Stewart, 2011]. However, the numerical solutions demand considerable computer 48
capacity and time and are not practical for investigating a huge number of impacts that occur 49
during the growth of a planet. For example, the formation of a planet like Mars requires about 50
3x10⁵ planetesimals of ~100 km in diameter. On the other hand, the scaling laws derived on the 51
basis of numerical solutions of the shock dynamic equations [e.g., Ahrens and O’Keefe, 1987; 52
Pierazzo et al., 1997; Mitani, 2003; Monteux and Arkani-Hamed, 2016] require remarkably less 53
computer power and time, and have been used by many investigators [e.g., Tonks and Melosh, 54
1992, 1993; Watters et al, 2009; Roberts et al., 2009; Arkani-Hamed and Olson, 2010a, 2010b; 55
Ghods and Arkani-Hamed, 2011], mainly because of their simplicity and partly because the 56
difference between their results and those obtained by the numerical simulations of the shock 57
dynamic equations is likely within the tolerance of the errors introduced due to the uncertainty of 58
pertinent physical parameters. We note that the existing scaling laws are applicable for uniform 59
mantle models of terrestrial planets and cannot be used for planets consisting of a solid silicate 60
mantle and a liquid iron core with drastically different physical properties. Extra formulations 61
are required to relate the shock pressure and particle velocity at the base of the mantle to those at 62
3 the top of the core. Arkani-Hamed and Ivanov [2014] derived the required boundary conditions 63
at the core-mantle boundary (CMB) of a Mars type planet for a vertical impact on the basis of 64
Hugoniot equations, the equality of the reflected and the refracted shock pressures, the continuity 65
of the vertical component of particle velocity, and the Snell’s law relating the incident angle to 66
the refracted angle of a shock ray at the boundary. This resulted in a set of coupled 8 67
trigonometric equations to be solved simultaneously for each shock ray. At each point of the 68
core mantle boundary, with spacing of 1 degree colatitude, the equations were solved iteratively 69
until the difference between the two successive solutions were within a set error limit. Although 70
such a simulation is much faster than the corresponding hydrocode simulation, it still takes 71
considerable time to determine impact heating in a growing planet that requires several hundred 72
thousand impacts during the accretion. Recently, Monteux and Arkani-Hamed [2016] derived 73
scaling laws in the mantle of a Mars size planet on the basis of systematic hydrocode modeling, 74
using impact velocities ranging from 4 to 10 km/s for impactor sizes ranging from 50 to 200 km 75
in radius, and two different mantle rocks of dunite and peridotite overlying the iron core. The 76
ANEOS type equations of state were used for the dunitic mantle rocks and the iron core. 77
78
In the present study, we adopt a new technique based on hydrocode models by Monteux and 79
Arkani-Hamed [2016] while deriving a new scaling law for the iron core to assess shock pressure 80
and the shock-related temperature increase in the entire Mars type planet. A given shock front 81
propagates from the impact site at the surface of the planet down to the CMB. It then partly 82
reflects back to the mantle, and partly enters the core and continues propagating until it impinges 83
the CMB in the antipodal hemisphere, where it partly enters the antipodal mantle and partly 84
reflects and propagates in the antipodal core. The second section characterizes the shockwave 85
propagation within a differentiated Mars size planet for different sets of parameters (impactor 86
radius, impact velocity, and mantle rheology). The third section compares the results from the 87
scaling laws with those obtained using hydrocode simulations. In the fourth section, impact-88
heated models determined on the basis of the scaling laws to demonstrate the feasibility of the 89
models derived by the scaling laws. Discussions and concluding remarks are relegated to the 90
fifth, final section. 91
92 93
4
2. Shockwave Propagation Inside A Mars-Type Planet:
94 95
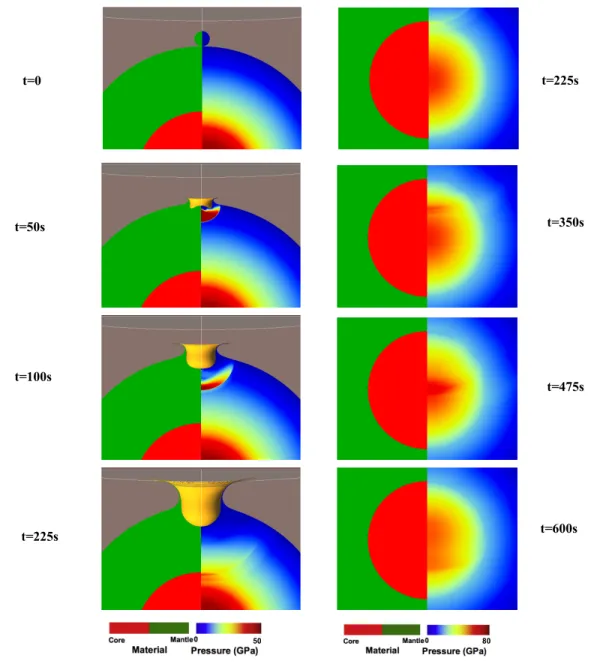
Figure 1 shows the 2D axi-symmetric total pressure (shock + lithostatic) distribution inside a 96
Mars size body of radius 3400 km with a core radius of 1700 km, created by an impactor of 200 97
km in radius and at an impact velocity of 10 km/s obtained by hydrocode simulation. The shock 98
pressure produced near the surface decays as the shock wave propagates downward until the 99
wave impinges the CMB, where it partitions into two waves, a reflected wave that propagates 100
outward in the mantle, and a refracted wave that enters the core and propagates downward. The 101
reflected wave arriving at a given point in the mantle travels much longer, hence is always 102
weaker than the direct wave that propagates directly from the impact site to that point. The peak 103
pressure at the point is produced by the direct wave. The effects of the two reflected waves, one 104
at the surface and the other at the CMB are not considered on the temperature of the mantle in 105
this study (see below). An abrupt pressure jump is created at the top of the core by the refracted 106
wave. The pressure then continues decreasing while the wave propagates in the core. 107
108
A total of 11 hydrocode models were simulated by Monteux and Arkani-Hamed [2016] that 109
included impact velocities of 4 to 10 km/s at increments of 1 km/s for an impactor of 50 km in 110
radius, and the impactor radii of 50 to 200 km at increments of 50 km for an impact velocity of 111
10 km/s. Two mantle rock types of dunite and peridotite were considered for a Mars-type planet. 112
The authors considered shock wave propagation in the mantle of the impacted hemisphere. Here 113
we extend the models allowing the wave enter the core, hence providing a means to estimate the 114
characteristics of shock pressure and the related temperature increase throughout the mantle and 115
the core. 116
117
2.1 The Model Set Up 118
119
At the end of the planetary accretion, large impacts between planetesimals and protoplanets 120
are frequent. The amount of energy dissipated during this regime of planetary evolution is large 121
enough to significantly melt the growing planets and efficiently separate the metal phase from 122
the silicate phase, resulting in the core formation. We consider a large impact between an 123
5 undifferentiated bolide and a differentiated Mars size planet using numerical hydrocode 124 simulations. 125 126 a) Physical model 127 128
We investigate the shock pressure inside a Mars size model planet for impact velocities Vimp of 5
129
to 20 km/s and impactors radii Rimp of 50 to 200 km. Such impactors are likely to create large
130
impact basins with sizes comparable to the giant impact basins of Mars that were formed 131
between 4.3 and 4 Ga [Frey, 2008; Robbins et al., 2013]. The impactors are large enough to 132
have important consequences on their target. However the impactors might be too small to have 133
experienced a complete melting and full metal/silicate separation before the impact unless they 134
formed during the early Solar System evolution [Ricard et al., 2017] Impacts involving 135
differentiated impactors will lead to the fragmentation of the impactor’s core before sinking 136
through the target’s mantle [Kendall and Melosh, 2016]. In our models, an impactor is 137
simplified by a spherical body of radius Rimp with uniform dunitic composition. Since we do not
138
consider a realistic impactor with a metallic core, we underestimate the actual impactor mass 139
and, as a consequence, the kinetic energy available for impact heating. In our models, the 140
impactor and the impacted mantle have the same properties (composition, strength, rheology, 141
and equation of state). 142
143
The ultimate goal is to determine the impact heating during the accretion of terrestrial planets 144
such as Mars and the Earth. The huge number of impacts during accretion makes it impractical 145
to consider oblique impacts for two main reasons: it requires formidable computer time, but 146
more importantly because of the lack of information about the impact direction, i.e. the impact 147
angle relative to vertical and azimuth relative to north. The peak shock pressure produced along 148
the vertical direction beneath the impact site by an oblique impact appears to depend 149
approximately on the sine of the impact angle relative to horizon (see Figure 3 of Pierazzo and 150
Melosh, 2000). This implies a shock pressure reduction by a factor of ~0.71 for the most 151
probable impact angle of 45o [Shoemaker, 1962] compared to that of a vertical impact, assuming 152
that all other parameters are equal. For example an oblique impact velocity of about 15 km/s 153
produces almost the same shock pressures as that produced by a vertical impact velocity of about 154
6 11 km/s. The difference between these two velocities is well within the variations of the impact 155
velocities of the N-body accretion models of terrestrial planets [e.g., Agnor et al., 1999; 156
Chambers, 2013]. Studies of more realistic accretion scenarios, which take into account the 157
oblique impacts and allow escape of material, conclude that the final state of an accreted body is 158
less sensitive to the details of the collision [Agnor and Asphaug, 2004; Kokubo and Genda, 159
2010]. Therefore, we consider only head-on collisions (vertical impacts) to model the thermo-160
mechanical evolution during an impact between a differentiated Mars size body and a large 161
uniform impactor. 162
163
As emphasized by Monteux and Arkani-Hamed [2016], the rheology of the impacted body plays 164
a key role on the propagation of the shockwave and on the subsequent impact heating. However, 165
the rheology of protoplanets is difficult to constrain precisely and is strongly governed by its 166
thermal evolution. Depending on its accretion rate, on its composition in radiogenic elements and 167
on the occurrence of large to giant impacts, growing Mars-sized protoplanets likely consist of a 168
partially to fully molten mantle overlying a liquid metallic core [Kaula, 1979; Solomatov 2000; 169
Senshu et al., 2002; Ricard et al., 2009]. In the following study we consider that the rheology of 170
the impacted protoplanets ranges between a “hydrodynamic model” with no-strength where both 171
the dunitic mantle and the metallic core are inviscid materials, and a “model with strength” 172
where the metallic core is an inviscid fluid while the dunitic mantle is treated using a pressure-, 173
temperature-, and damage- dependent strength model. 174
175
Damage describes the transition from intact to fractured strength. Under a constant pressure, 176
damage begins to accumulate when the material begins to flow plastically. Damage is maximum 177
when the material is completely fractured. Among the damage models available in iSALE, we 178
adopt the Ivanov damage model [Ivanov et al., 1997], which prescribes damage as a function of 179
plastic strain. In this model the plastic strain at failure is an increasing function of the total 180
pressure P (lithostatic pressure plus the shock-induced pressure). This model allows rapid brittle 181
failure in tensile and low-pressure modes, and semi-brittle failure at high pressures. The damage 182
model from Ivanov et al., [1997] is simpler than the model developed by Collins et al., [2004] 183
where the plastic strain at failure is a function of the brittle-ductile and brittle-plastic transition 184
pressures, both these parameters being poorly constrained in the early protoplanets context. 185
7 186
The thermal softening is an efficient process for large-scale events [Potter et al., 2012]. 187
Depending on the temperature and more specifically on the melt fraction, the impacted material 188
can behave as a solid material or as fluid. The transition from solid-like to fluid-like behavior 189
occurs at a critical melt fraction of ≈40% for early mantle material (Solomatov, 2000). As it 190
depends on the temperature, the thermal softening process also strongly depends on the pre-191
impact temperature that is unfortunately poorly constrained in the Martian case. In our iSALE 192
models, we use the Ohnaka thermal softening model where the shear strength of rocks depends 193
on temperature, and reduces to zero at the melting temperature. 194
195
In the “model with strength”, we approximate the thermodynamic response of both the iron and 196
dunitic material using the ANEOS equation of state [Thompson and Lauson, 1972, Benz et al., 197
1989]. To make our models as simple as possible we do not consider here the effects of porosity 198
or low density weakening which are likely to be negligible in the deep interior of a planet. 199
However, as a first step towards more realistic models, we investigate the influence of acoustic 200
fluidization, thermal softening and damage. The simulation parameters are listed in Table 1. 201
202
b) Numerical model 203
204
We use the iSALE-2D axisymmetric hydrocode, which is a multi-rheology, multi-material 205
hydrocode, specifically developed to model impact crater formation on a planetary scale 206
[Amsden et al., 1980, Collins et al., 2004, Davison et al., 2010]. To enable a comparison of our 207
models, for all our simulations, we use a 2 km grid resolution computational domain. The 208
horizontal and vertical number of cells per projectile radius (cppr) is maintained constant within 209
the impacted mantle (=1700) and within the impacted core (=850) (see Table 2). The number of 210
cppr varies only within the impactor when varying the impactor radius (cppr=25 for Rimp=50km
211
and cppr=100 for Rimp=100km). Such spatial resolutions should lead to an underestimation of the
212
peak shock pressure ranging between 5% (close to the impact site) and 10% (far from the impact 213
site) according to resolution studies [e.g., Pierazzo et al., 2008; Wünneman et al., 2008, Monteux 214
and Arkani-Hamed, 2016]. 215
8 iSALE requires the length of each time step (dt) and the maximum time step (dtmax). iSALE
216
limits the time step by the speed of sound according to the Courant–Friedrichs–Lewy (CFL) 217
condition while dtmax limits a timestep if it is smaller than the CFL-limited timestep. In our
218
models, we use a dtmax valueof 0.05 s. The minimum post impact monitoring time is set to the
219
time needed by the shockwave to travel from the impact site through the entire core of the 220
impacted planet. 221
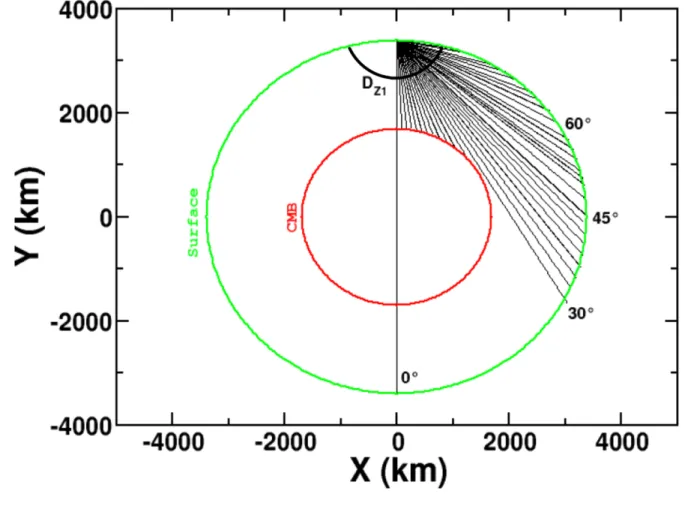
In our iSALE models, we investigate the effects of the ray angle β relative to the symmetric axis 222
(Figure 2). To compare the shock wave propagation along each path illustrated in Figure 2, we 223
developed a numerical method to extract the shock pressure and temperature at a fixed position 224
from all our simulations. As a consequence, instead of using tracers, the impact-induced pressure 225
and temperature fields are extracted from a cell-centered Eulerian grid points [Monteux and 226
Arkani-Hamed, 2016]. Hence, the distance D corresponds to the straight-line distance between 227
the impact site and the grid point where the peak pressure is located. It approximates the 228
distance along a shock ray (see the Discussion section). Hence, we refer to the straight line as 229
the ray from now on. We also investigate the effects of the angle β of the straight line, i.e., the so 230
called ray, relative to the symmetric axis (Figure 2). We emphasize that a ray does not enter the 231
core when the ray angle β is larger than 30° in our model planet. 232
233
2.2 The Reference Models
234 235
Figure 3 (left) shows the peak shock pressure distribution along the axis of symmetry (β=0°) in a 236
model with Rimp=50 km and Vimp=10 km/s. From Figure 3, we can identify 2 zones of particular
237
interest: Zone 1 where the peak shock pressure PZ1 decreases exponentially with the distance
238
from the impact site, and Zone 2 where the peak shock pressure PZ2 still decreases significantly
239
though less rapidly with the distance. As we will see later, these 2 zones are particularly 240
distinguishable for small values of Rimp. Considering Vimp=10 km/s is the average asteroid impact
241
velocity on Mars [Bottke et al. 1994], we will define the case with Rimp=50 km and Vimp=10 km/s
242
as our reference model. Figure 3 (right) illustrates that considering a differentiated impactor 243
(with a dunitic mantle and a liquid iron core) slightly increases the peak shock pressure 244
magnitude during the propagation of the shockwave within the impacted planet because of the 245
9 different mass repartition in the impactor. However, considering a differentiated impactor affects 246
neither the pressure decay in 2 zones nor the position of the limit between the two zones. 247
248
The shock wave generated by an impactor propagates toward the center of the planet, while the 249
shock pressure decays as the wave deposits energy in the form of irreversible work into the target 250
[Ahrens and O’Keefe, 1987]. Hence, the ability of the impacted material to deform when 251
experiencing large shock pressure is of the first importance for the characterization of the peak 252
shock pressure evolution. Figure 3 illustrates the influence of the mantle rheology on the shock 253
wave propagation. The peak shock pressure experienced within the mantle decreases more 254
rapidly in the model with strength than in the hydrodynamic model. In our models, the acoustic 255
fluidization and the damage play minor roles on the shockwave propagation compared to that of 256
the strength, because the lithostatic pressure is too high to allow fracturing of rocks. 257
258
If strength is present, shock waves attenuate faster because the rarefaction waves travel faster in 259
material with strength and, therefore, cause a more rapid decay behavior [Curran et al., 1977, 260
Bierhaus et al, 2013]. We note that the speed of sound in a strength-less material is given by 261
𝑐 = 𝐾 𝜌 where K is the bulk modulus and ρ the density. If the material has some strength, the 262
longitudinal wave speed is determined by 𝑐! = 𝐾 + 4/3𝜇 /𝜌 where µ is the shear modulus. 263
Because 𝑐! > 𝑐, the speed of the first, direct wave is larger when the strength is accounted for 264
than in the hydrodynamic case, hence the shock waves attenuate faster in the models with 265
strength [Curran et al., 1977, Bierhaus et al, 2013]. Ultimately, if the speed of the rarefaction 266
wave depends on strength, then differences in strength should result in different attenuation 267
behaviors. However this point is beyond the scope of our study. Outside Zone 1, the peak shock 268
pressure continues to decrease with distance from the impact site and both models show a similar 269
behavior: a power-law decrease followed by a pressure jump at the CMB. The more moderate 270
decay in Zone 2 might be the consequence of a solid-state phase transformation that is 271
considered in the ANEOS for dunite [Collins and Melosh, 2014]. This process does not occur in 272
the hydrodynamic models, because the shock pressure does not drop below the critical pressure. 273
10 Included in Figure 3 are the results from Pierazzo et al. [1997] for Vimp=10km/s and Rimp ranging
275
between 0.4 and 10km, where the strength was not included. Our results for the hydrodynamic 276
model, and the results from Pierazzo are in good agreement (Figure 3). The small differences 277
between our results and the results from Pierazzo et al. [1997] are plausibly the direct 278
consequence of using different cppr values (for Rimp=50km, cppr=25 while cppr=20 for Pierazzo
279
et al. [1997]). Figure 3 illustrates that accounting for strength significantly reduces the intensity 280
of the shock pressure. This indicates that building more sophisticated models is necessary to 281
estimate the shock pressure evolution after a large impact, as suggested by Monteux and Arkani-282
Hamed [2016]. 283
284
For large impacts, the thermal softening is an efficient process that may influence the shockwave 285
propagation. Indeed, accounting for thermal softening changes the strength and, thus, the speed 286
of the rarefaction wave, which may result in a different attenuation behavior. This process 287
strongly depends on the pre-shocked temperature profile that is still poorly constrained during 288
the early evolution of terrestrial planets. To illustrate the influence of the thermal softening, we 289
have run two models with different pre-impact spherically symmetric temperature distributions, 290
characterized by a cold boundary layer at the surface overlying a convective-type, adiabatic 291
temperature within the mantle. The difference between these two models is the surface 292
temperature that is 293K for the cold case and 500K for the hot case. Figure 4 shows that the 293
thermal softening (as damage and acoustic fluidization) plays a minor role on the shockwave 294
attenuation after a large impact. Accounting for thermal softening leads to a peak shock pressure 295
decrease in Zone 1 and to an increase of the depth of Zone 1-Zone 2 transition. An initially 296
hotter mantle only slightly enhances these 2 effects. 297 298 299 2.3 Scaling Laws 300 301
We have slightly modified the procedure by Monteux and Arkani-Hamed [2016]. By combining 302
their near field and midfield, we reduce the number of parameters and make it easy to adopt the 303
scaling laws in the impact heating of a terrestrial proto-plant during its accretion. We determine 304
new scaling laws of shock pressure P for deriving universal scaling laws. From Figure 3, we 305
11 have identified 2 zones of particular interest: Zone 1 (associated to a peak shock pressure PZ1)
306
and Zone 2 (associated to a peak shock pressure PZ2). This dichotomy is particularly pronounced
307
in the models with strength. 308
309
We suggest two distinct scaling laws along the axis of symmetry to characterize the peak shock 310
pressure in the model planet: 311
312
PZ1 = A0 exp(-A1 D/Rimp) (1a)
313
PZ2 = A2 (D/Rimp)-A3 (1b)
314 315
where D is the distance from the impact site, Rimp is the impactor radius. A0 is the maximum
316
shock pressure andA1, A2, and A3 are constant obtained by fitting the results from the hydrocode
317
models. All these parameters are impact velocity and impactor radius dependent. They also 318
depend on the ray angle β. Zone 1 corresponds to a hemisphere centered at the impact site with 319
radius DZ1. Zone 2 corresponds to the mantle shell beyond DZ1. Zone 2 lies between DZ1 and the
320
CMB for the ray angle β <30°. The zone is limited by the surface of the impacted planet for β 321
>30°(see Figure 2). 322
323
The scaling law used to fit the peak shock pressure decay within Zone 1 is different from the 324
classical power-law that usually uses other empirical or semi-empirical relations in impact 325
studies [e.g. Ahrens et al., 1977]. However it has two advantages: 1) with this formalism the 326
peak shock pressure does not go to infinity as D/Rimp goes to 0 compared to other power law
327
forms [e.g., Ruedas, 2017], and 2) the peak shock pressure decays relatively slowly for 328
D/Rimp<3-4, which includes the “isobaric core” with slowly decaying shock pressure and the
329
“pressure decay regime” regions proposed by Pierazzo et al., [1997]. On the other hand, the Zone 330
2 represents the far field region in the mantle where the shock pressure decays monotonically 331
with distance from the impact site. 332
333
As the shock wave propagates in the mantle it creates a high pressure behind the shock front, 334
which is determined on the basis of the Hugoniot equations. When the shockwave crosses the 335
CMB, the peak shock pressure jumps from Pm (immediately above the CMB) to Pc (immediately
12 below the CMB) because of the abrupt changes in the physical parameters, as previously 337
identified [e.g., Ivanov et al., 2010; Arkani-Hamed and Ivanov, 2014]. After this sudden 338
increase, the peak shock pressure continues to decrease as the wave propagates inside the core, 339
which is characterized by a separate scaling law: 340
341
Pcore = A4 (D/Rimp)-A5 (1c)
342 343
where A4 and A5 are constants. Fitting the peak shock pressure from our numerical models along
344
the ray paths shown in Figure 2 enables us to fully characterize the pressure increase experienced 345
within the martian mantle and core. We note that a vertical impact on a spherically symmetric 346
planet adopted in this study artificially enhances the shock pressure along the axis of symmetry 347
in the core, hence Equation 1c overestimate the pressure near the axis of symmetry, while such 348
an effect does not occur in the mantle (see the Discussion section below). Equations 1a, 1b and 349
1c will be used to fit the results from both the models with strength and the hydrodynamic 350
models. The values of the different coefficients resulting from the corresponding fits are 351
provided in the following sections. We would like to emphasize here that these scaling laws are 352
only empirical and can be implemented in large-scale mantle models [e.g. Monteux and Arkani-353
Hamed, 2014] or in accretionary models [e.g. Monteux et al., 2014]. These scaling laws are 354
determined by least square fitting to the results from the iSALE hydrocode models. 355
356
2.4 Shock Wave Propagation in the Mantle: Effects of the Ray Angle
357 358
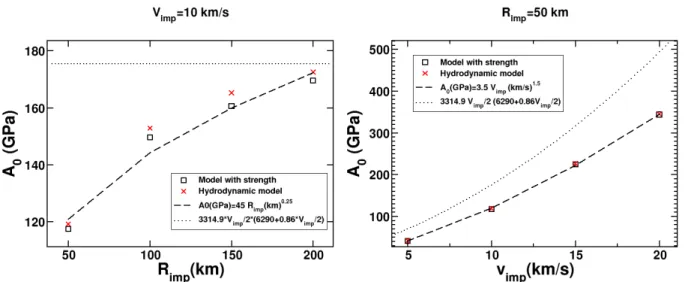
During an impact, the maximum shock pressure is experienced at the impact site on the surface. 359
Then the impact energy dissipates as the shockwave propagates within the model planet. Figure 360
5 shows that the maximum shock pressure A0, in either the models with strength or the
361
hydodynamic models, increases with the impact velocity and the impactor radius. The peak 362
shock pressure is nearly constant within an almost hemispheric region of a radius 1-2 times the 363
impactor radius, centered at the impact site (see Figure 3), which is coined as “isobaric core” by 364
Pierazzo et al [1997]. We note that A0 is the shock pressure at the impact site and it remains the
365
same for all of the ray angles considered. It is used in our scaling law (Eq. 1a) to obtain the A1
366
values from our models (Figure 6). Figure 5 shows the maximum shock pressure predicted from 367
13 the planar impact model [Melosh, 1989]. As detailed by Osinski and Pierazzo [2012], the planar 368
impact approximation yields an upper limit of the pressure expected during an impact event. 369
Hence, it is not surprising that our A0 values are slightly smaller than the results from the planar
370
impact approximation. 371
372
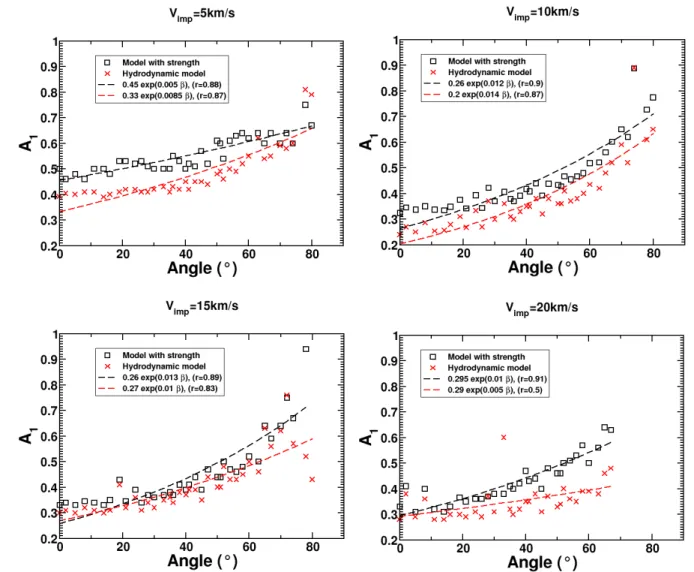
Previous studies [Pierazzo et al., 1997, Monteux and Arkani-Hamed, 2016] monitored the 373
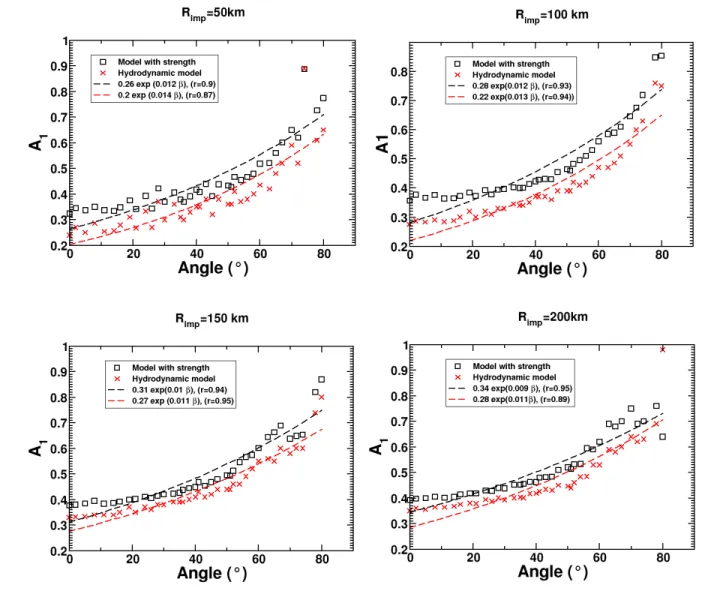
influence of the ray angle β of the shock wave, and found no significant angle dependence in 374
their results for β ranging between 0° (vertical) and 45°. Here we extend the investigation to β 375
values up to 80°. A1 is the exponential factor (Eq. 1a), characterizing the ability of the upper
376
mantle to attenuate the shockwave as it propagates. For large A1 values, the peak shock pressure
377
decreases rapidly with distance. Hence, higher A1 values are expected for the models with
378
strength than for the hydrodynamic models. In Figures 6a and 6b, we present the A1 values
379
obtained by fitting the results from iSALE models to Eq. 1a along different ray angles illustrated 380
in Figure 2. A1 increases as a function of β, indicating that the peak shock pressure decreases
381
more efficiently with distance at large ray angles. This behavior is common to both models with 382
strength and hydrodynamics models. However, the increase is not significant for β values smaller 383
than 45°, as also mentioned by Pierazzo et al., [1997]. We note that the rays impinging the core 384
mantle boundary have β values smaller than 30o, indicating that propagation of shock waves 385
inside the core is almost independent of the β values. Figures 6a shows that A1 is weakly affected
386
by the impactor size for the range of impactors used in our study (i.e. 50<Rimp<200km). For 387
larger impactors (not studied here), one can expect an influence of the impacted protoplanet 388
curvature on the shockwave propagation. However, Figures 6b shows that A1 is more sensitive to
389
the impact velocity. Pierazzo et al. [1997] showed that the power-law exponent used to fit the 390
angle dependency (for β ranging between 0° and 45°) was increasing with the velocity. From our 391
results (for β ranging between 0° and 80°) it is difficult to extract such a tendency. 392
393
For the large ray angles, the path followed by the shockwave is shallower (Figure 2). The shock 394
wave propagating through shallower regions will cross material where the pressure and the 395
uncompressed target density are smaller in average compared to shock wave propagating along 396
the axis of symmetry. As a consequence, along small ray angle paths, the deformation is more 397
difficult than along large ray angle paths. In addition, in shallower regions a significant part of 398
14 the impact energy is dissipated during processes such as the excavation or the post-impact 399
rebound. Finally, the interference of the direct pressure wave with the rarefaction wave that is 400
reflected at the surface reduces the amplitude of the shock pressure [Melosh, 1989; Arkani-401
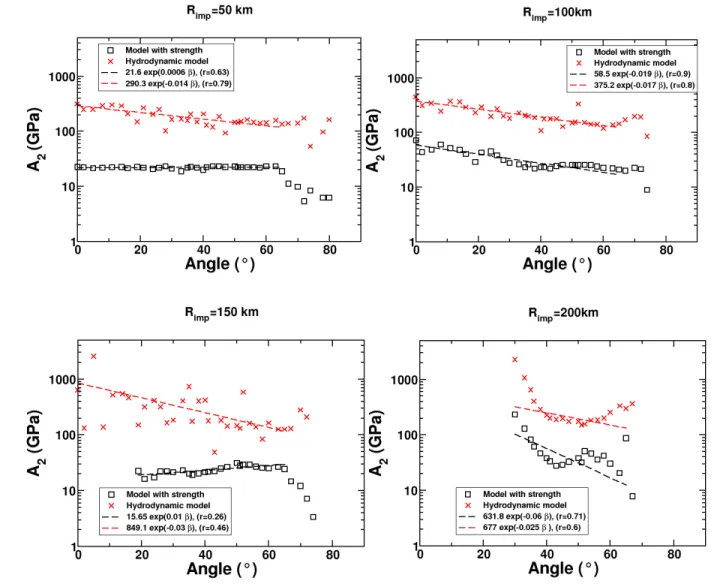
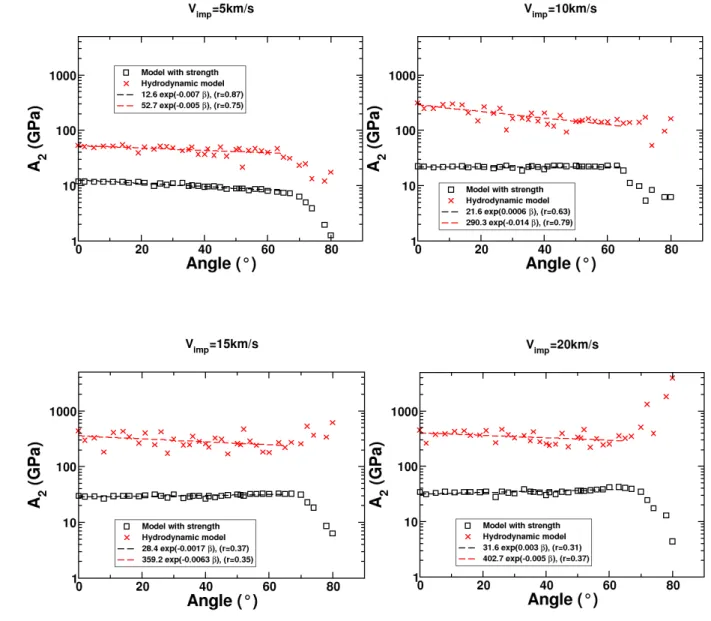
Hamed, 2005; Louzada and Stewart, 2009]. The consequence of these factors is that the isobaric 402
surfaces are slightly elliptical with vertical major axis rather than spherical. 403
404
As previously mentioned, the shock wave decay rate with distance should be more rapid for the 405
model with strength compared to the hydrodynamic models (as illustrated in Figure 3). Figures 406
6a and 6b confirm this point by showing that A1 values are larger for models with strength than
407
for hydrodynamic models for all β values. The correlation coefficients obtained by fitting our 408
hydrocode data with the scaling laws from Eqs. 1 a, b and c show that our choice is relevant. The 409
correlation coefficients are close to 0.9 for all the range of impactor radii and impact velocities 410
used in our models (except for Vimp=20km/s). The correlation coefficients are even higher for β
411
values smaller than 65°. The correlation coefficients are also larger in the models with strength 412
than in the hydrodynamic models because the dichotomy between Zone 1 and Zone 2 is more 413
pronounced in the models with strength than in the hydrodynamic models (See Figure 3). 414
415
In our study, the distance D from the impact site is normalized to the impactor radius Rimp to
416
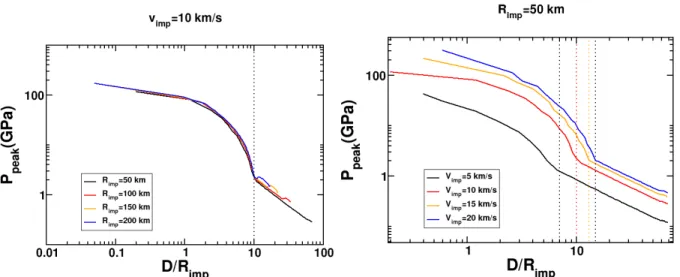
eliminate the dependence on the size of the projectile. Figure 7 illustrates peak shock pressure 417
profiles along a ray angle of β =36° meaning that the ray does not cross the CMB (see Figure 2). 418
Figure 7 shows that the boundary between Zone 1 and Zone 2 depends on both the impactor size 419
and the impact velocity, hence the total pressure (shock plus lithostatic) through the Equation of 420
State adopted in the hydrocode models. This suggests a relation between the observed transition 421
and a phase change in the Equation of State from our iSALE models. The Zone 1 - Zone 2 422
boundary occurs at a constant distance close to 10 times the radius of the impactor for the range 423
of impactor sizes studied (Figure 7, left). In the cases shown in Figure 7, β is close to the critical 424
value of 30° where the ray crosses the CMB (Figure 2). As Rimp increases, the minimal value
425
D/Rimp for which the shockwave crosses the CMB decreases from 34 (for Rimp=50 km, black
426
curve) to 8.5 (for Rimp=200 km, blue curve). At this singular point (Figure 7, left), a small jump
427
of the peak pressure occurs because of the reflection of the shock waves with β <30° at the CMB. 428
The ratio of the isobaric core radius to the projectile radius weakly depends on the impact 429
15 velocity, as also concluded by Pierazzo et al. [1997]. For the range of impact velocities 430
considered, the Zone 1 - Zone 2 boundary ranges between 7 and 15 times the radius of the 431
impactor (Figure 7, right). The small peak shock pressure jumps identified in Figure 7 (left) for 432
large impactors does not occur here because of the small, 50 km, impactor radius. 433
434
Once the shockwaves enter into Zone 2, the peak pressure continues to decrease. Figures 8a and 435
8b show the dependency of A2 on the ray angle (see Eq. 1b). Because peak shock pressure
436
decreases more rapidly with distance in the models with strength than in the hydrodynamic 437
models (see Figure 3), A2 values are smaller in the models with strength than in the
438
hydrodynamic models. Also, A2 only slightly decreases with the ray angle β in both cases. For
439
all impact velocities and impactor radii studied here, the A2 values obtained from the models with
440
strength are nearly constant up to the values of β close to 65°. For β > 65°, the data is more 441
scattered (see discussion at the end of the section). For the large impactor, Rimp=200km, the
442
evolution of A2 as a function of β is significantly different. This is probably due to the fact that,
443
in that case, Zone 1 overlaps the CMB. 444
445
Figures 9a and 9b show the relationship between A3 (see Eq. 1b) and the ray angle β. As for A1,
446
A3 is smaller in the models with strength than in the hydrodynamic models. This feature is
447
related to the higher shear strength in the models with strength, which consumes a portion of the 448
impact energy to plastically deform the impacted material. Again, the more moderate decay in 449
Zone 2 (i.e. smaller A3 values) in models with strength compared to hydrodynamic models might
450
be the consequence of a solid-state phase transformation that is considered in the ANEOS for 451
dunite [Collins and Melosh, 2014]. Apart from this difference, both models behave similarly. 452
Figures 9a and 9b show that A3 slightly increases with β up to β≈65° indicating that the peak
453
shock pressure decreases more efficiently with distance at large ray angles. From the results 454
illustrated in Figure 9b, the A3 coefficient does not significantly depend on the impact velocity.
455
However, Figure 9a shows that the tendencies described earlier are completely different for 456
Rimp≥150 km. Indeed, for large impactors, the size of Zone 2 is significantly reduced and the
457
impacted hemisphere mainly consists of Zone 1 and the metallic core within the ray angle less 458
than 30°. 459
16 To illustrate the dependencies of A1, A2 and A3 on β, we express them as Ai = A6 exp(A7 β) where
461
i denotes 1, 2, or 3 (see legend boxes in the corresponding figures). Figures 6, 8 and 9 show 462
small values for A7, typically ranging between 10-2 and 10-3. This confirms that the shock wave
463
propagation weakly depends on the ray angle that is ranging between 0° (vertical) and 45°, as 464
already concluded by previous studies [Pierazzo et al., 1997, Monteux and Arkani-Hamed, 465
2016]. This can be extended for β up to 60° on the basis of Figures 6, 8 and 9. For the 466
hydrodynamic models the trend is similar although the iSALE data are more dispersed. Figures 8 467
and 9 also show that for Rimp values larger than 150 km, the trend is less clear than for small
468
impactors. As already mentioned, we attribute this feature to the overlap between Zone 1 and the 469
CMB, which leads to the progressive disappearance of Zone 2 as Rimp increases. These
470
differences are confirmed by the correlation coefficients that are larger for small impactors and 471
are generally higher for the models with strength than for the hydrodynamic models where the 472
iSALE data is more dispersed. 473
474
Figures 8 and 9 also exhibit a large variability for β values larger than 65°. For these large β 475
values the shock waves propagate through shallower regions (see Figure 2) where the total 476
pressure is much smaller than that in the deep mantle. Moreover, in the shallowest region the 477
largest initial impact is followed by multiple smaller impacts caused by ejecta fall back. Finally, 478
the near surface region is also affected by the wave reflected at the surface that interferes with 479
the direct wave and complicates the determination of the peak shock pressure [Melosh, 1989; 480
Arkani-Hamed, 2005; Louzada and Stewart, 2009]. These 3 effects may explain the variability of 481
the A1, A2, A3 constants for large β values.
482 483
2.5 Effects of the CMB 484
485
The distinctly different physical properties of the mantle and the core have two major effects on 486
the shock wave as it passes from the mantle to the core. The shock pressure increases abruptly 487
as seen in Figure 3, and a shock ray bends, obeying the Snell’s law. Here we discuss each of 488
these two effects. 489
17 Because the core radius is half the size of the impacted planet, the shock waves encounter the 491
CMB only for β values smaller than 30 degrees (Figure 2). Figure 10 shows the ratio of the 492
shock pressure immediately above the CMB, Pm, to that immediately below the CMB, Pc, in the
493
impacted hemisphere. Both are calculated along a straight line determined by a ray angle and at 494
the grid points of the hydrocode models immediately above and below the CMB, respectively. 495
We note that Pm and Pc are actually the pressures slightly off the shock ray, hence are
496
approximations to the actual pressures on the ray. A given shock ray bends toward the axis of 497
symmetry as it crosses the CMB and the refraction angle determined through the Snell’s law is 498
smaller than the incident angle (see below). The bend is more pronounced at higher ray angles. 499
500
To connect the peak shock pressure between the mantle and the core we fit the ratio Pc/Pm as a
501
function of the ray angle β with a quadratic expression for the models with strength: 502
503
Pc/Pm =b1+b2β+b3β2 (2a)
504 505
and a linear expression for the hydrodynamic models: 506
507
Pc/Pm = b4+b5β (2b)
508 509
where b1, b2, b3, b4 and b5 are constant. The values of these constants for both models and as a
510
function of Rimp and Vimp are listed in Table 3. The corresponding results are illustrated in Figures
511
10a and 10b. We emphasize here that the equations 2a and 2b used to fit the pressure jump as a 512
function of the ray angle β are chosen empirically according to our results illustrated in Figure 10 513
and b. 514
515
For all the impact velocities and impactor radii used in our models, the behavior is quite similar, 516
although the shockwave that arrives at the CMB has much higher amplitude in the hydrodynamic 517
case than in the models with strength (Figure 3). Figure 10 shows that the pressure jump at the 518
CMB is more pronounced in the models with strength than in the hydrodynamic models, 519
regardless of the amplitude of the arriving shockwave. Because the pressure jump at the CMB is 520
likely related to the amplitude of the arriving shockwave for a given model, our results 521
18 emphasize the importance of the impacted material properties on the amplitude of the pressure 522
jump. 523
524
For large impactors (Rimp>150 km) and for β values smaller than 30°, we have shown that Zone 1
525
directly interferes with the impacted planet’s core thus leading to a disappearance of Zone 2. 526
Above this critical value of β>30°, even if the direct shockwave does not cross the core (Figure 527
2), one can expect that the transition from Zone 1 to Zone 2 would still be identified in our 528
models. However, Figure 8a (bottom panels) and Figure 9a (bottom panels) also show a different 529
behavior for large impactors for β>30°. We attribute this phenomenon to the interaction of the 530
direct shockwave with the core which produce a variety of diffracted and reflected shockwaves 531
that affect the peak shock pressure far from the impact site and for β>30°. As the shockwave 532
behavior is completely different, our scaling laws for A2, A3 and Pc/Pm proposed in Eqs. 1b, 2a
533
and 2b are less viable. The tendency for A2 and A3 is difficult to identify from our results (Figure
534
8a and Figure 9a (bottom panels)) and this complexity probably illustrate the complexity of the 535
shockwave propagation far from the impact site. 536
537
The incident angle of a shock ray at the CMB increases from 0o to 90o as the ray angle β 538
increases from 0o to 30o. The refraction angle of a given shock ray is determined on the basis of 539
the Snell’s law, 540
541
Um / sin γm = Uc / sin γc (3)
542 543
where Um and Uc are the shock wave velocities in the mantle and the core, γm is the incident
544
angle, and γc is the refraction angle. Um and Uc are determined from our numerical models (see
545
the next section). 546
547
2.6 Shock Wave Propagation in the Core 548
549
Figure 11 shows the dependency of the coefficients A4 and A5 in Eq. 1c on Vimp and Rimp
550
determined along the axis of symmetry using the hydrocode models. A4 shows a power-law
19 behavior while A5 shows almost linear dependency, especially those associated with the models
552
with strength. 553
554
For a given ray angle β we calculate the incident and the refraction angles at CMB, hence the 555
corresponding shock ray path in the core, assuming linear. The peak shock pressure decay along 556
this ray path is determined from Eq. 1c, where D is the distance from the impact site to a point in 557
the core measured along the ray path assuming that A4 and A5 are independent of the ray angle.
558
Figure 12 shows the distance of the peak shock pressure from the impact site in the impacted 559
hemisphere of the mantle and the entire core versus the time since the impact. Table 4 lists the 560
corresponding shock wave velocity in the mantle and the core. The shock wave velocities vary 561
slightly among the models. More importantly, the velocity in the core is consistently lower than 562
that in the mantle, indicating that the refracted ray angle is always smaller than the incident ray 563
angle. 564
565
3. Comparison of the Scaling Law Models with the iSALE Models
566 567
Before implementing our scaling laws to the accretion of a planet it is required to compare the 568
scaling law models with the iSALE models. Here we compare the hydrocode models and the 569
models with strength to the corresponding models determined using our scaling laws for the 570
impact velocity of 10km/s and the impactor radius of 50km (Figures 13 a and b). In the scaling 571
law models the refracted angles of the shock rays at the CMB are determined by the Snell’s law. 572
Hence, the shock pressure is not estimated in the equatorial region of the core where no refracted 573
wave propagates. This results in the distinct lack of shock pressure in the equatorial part of the 574
core and in the lower mantle beneath the shock ray that is tangent to the core mantle boundary. 575
Several other features are not modeled by the scaling laws because we do not consider the 576
reflection at the CMB and at the surface or the reflection and refraction at the antipodal CMB, 577
which are included in solving the shock dynamic equation in the hydrocode models. . 578
579 580
Figure 13 (right panel) shows the relative difference between the two models. For the impacted 581
hemisphere, the mean errors are 13% within the mantle and 14% within the core for the model 582
20 with strength, and 10% within the mantle and 12% within the core for the hydrodynamic model. 583
The fact that iSALE model combines both direct and indirect waves, while our model shows 584
only the direct wave could contribute to the error between our scaling law parameterization and 585
the iSALE data. The error pattern is similar in both the hydrodynamic and strength models. As 586
mentioned above, the direct shock pressure within the core for β values larger than 30° is not 587
determined by the scaling laws. The shock pressure of the hydrocode model in this region must 588
be due to the secondary shock waves that are reflected at the surface and then refracted at the 589
CMB. The scaling law models overestimate the peak shock pressure close to the impact site 590
(Zone 1) where the error can locally reach 50 %. However, despite the large peak shock pressure 591
range in this region, our scaling laws provide a first order approximation to the hydrocode 592
models. 593
594
An impact generates two compressional shockwaves, one propagates downward in the planet and 595
the other propagates upward in the penetrating impactor. The latter reaches the top of the 596
impactor, and reflects back and propagates downward as a rarefaction wave. The turbulence 597
induced by the compressional wave in a given location inside the planet is diminished by the 598
trailing rarefaction wave. This limits the thickness of the entire shock front with appreciable 599
turbulence. The velocity of the rarefaction wave is higher than that of the original down going 600
compressional wave, because the rarefaction wave propagates inside the penetrating impactor in 601
the early times and then inside the planet that is already set in motion by the initially down going 602
compressional wave. At a shock wave velocity of about 8 km/s, the passage of the entire shock 603
front at a given location takes less than a minute for the largest impactor of 200 km considered in 604
this study, and much shorter for other impactors. A given location in the mantle experiences 605
more than one shock wave, such as the shock wave reflected at the surface and that reflected at 606
the CMB. However, these shock waves have low amplitudes because they travel longer 607
distances than the direct wave and they arrive at much later times relative to the direct pressure 608
wave. They rarely interfere with the direct wave except near the surface and near the CMB. In 609
the case of the core, parts of the antipodal core is shocked twice, first by the direct wave that is 610
refracted at the CMB of the impacted hemisphere beneath the impact site and second by the 611
shock wave reflected at the CMB of the antipodal hemisphere. The first wave travels a shorter 612
distance than the second one, hence passes a given location sooner than the arrival of the 613
21 reflected wave. As in the case of the mantle, there is negligible interaction between these two 614
waves, except for very close to the antipodal CMB. In general, a given location experiences 615
multiple pressure increases due to the multiple reflected and refracted waves that travel through 616
the planet’s interior. However, the peak pressure is due to the direct shockwave. 617 618 619 4. Impact heating 620 621
During the decompression, a fraction of the energy is converted into heat [Bjorkman and 622
Holsapple, 1987]. The temperature increase has been related to the shock pressure [e.g., Watters 623
et al., 2009] as well as to the particle velocity [e.g., Gault and Heitowit, 1963]. The shock 624
pressure in a given location diminishes within a time scale that is much shorter than the cooling 625
timescale of the impact induced thermal anomaly. Although secondary shock waves lead to 626
local pressure increase, the corresponding temperature increase is negligible compared to that of 627
the direct shock wave. Here we only consider the direct shock heating in our estimation of the 628
impact induced temperature increase. 629
630
The impact heating induced by the shockwave propagation is determined by implementing our 631
scaling laws within the theoretical model proposed by Watters et al. [2009] 632 633 ∆𝑇(𝑃!) = !! !!! ! 1 − 𝑓 !! − ! ! ! 𝑓 − ln 𝑓 − 1 /𝑐! (4) 634 𝑓 𝑃! = −!! ! 1 − !!! ! + 1 !! (5) 635 𝛽 =!!!! !! (6) 636 637
where Pδ is the shock-induced pressure, ρ0 isthe density priorto the shock compression and cp is
638
the heat capacity of the impacted material (see values in Tab. 1). The shock pressure 639
implemented in Eqs. 4, 5 and 6, is the shock-induced pressure predicted by our scaling laws 640
(Eqs. 1 and 2). Figure 14 shows the temperature increase obtained using our scaling laws for 641
both the hydrodynamic model and the model with strength for Vimp=10km/s and Rimp=50 km (top
22 panels) and Vimp=10km/s and Rimp=150 km (bottom panels). As mentioned before, the shock
643
pressure is not estimated by the scaling laws where no refracted wave propagates (i.e. in the 644
equatorial region of the core and the lower part of the mantle beneath the shock ray that is 645
tangent to the CMB). Hence, we cannot estimate the post-impact temperature increase in these 646
regions (illustrated by black areas in Figure 14). This figure shows that for a 50 km radius 647
impactor, the region with significant impact heating is localized in a small shallow volume. For a 648
150 km impactor, a larger fraction of the impacted mantle is affected. Below the impact site the 649
temperature increase can reach ≈1900K for both the hydrodynamic model and the model with 650
strength. The largest temperature increase is localized in Zone 1 and the temperature increase in 651
Zone 2 is weaker. The main difference between the two rheologies is the depth of the impact 652
temperature increase, which is deeper in the hydrodynamic model than in the model with 653
strength, because the pressure decay is more rapid in the model with strength (Figure 6 a, bottom 654
left panel). Moreover, the regions with increased temperature have shapes that are more prolate 655
than spherical, because of the influence of the β angle on the pressure decay in Zone 1. The 656
difference in the expression of the pressure decay between the two models as a function of β 657
should lead to a difference in sphericity (Figure 6 a). However, the difference is not significant in 658
the cases illustrated in Figure 14. 659
660
5. Discussion and Conclusions.
661 662
We have modeled the shock pressure distributions inside the impacted hemisphere of a 663
differentiated Mars size planet using 2D axi-symmetric hydrocode simulations (iSALE-2D) for 664
vertical impacts with impact velocities of 5–20 km/s and impactor radii ranging from 50 to 200 665
km. From these hydrocode simulations, we have observed a distribution of the peak shock 666
pressure within the impacted mantle and proposed a mathematical formalism adapted to this 667
distribution: a first zone (Zone 1) where the peak shock pressure decreases exponentially and a 668
second zone (Zone 2) where the peak shock pressure decrease follows a power-law. With this 669
formalism, the peak shock pressure does not go to infinity as D/Rimp goes to 0, and the peak
670
shock pressure decays relatively slowly from the impact site to D/Rimp=3-4, which includes the
671
canonical “isobaric core” with slowly decaying shock pressure with distance from the impact site 672
23 and the “pressure decay regime” region proposed by Pierazzo et al., [1997]. We have shown 673
that the ray angle β has minor influence on the pressure decay pattern for β<65-70°. 674
675
The most important contribution to the peak shock pressure distribution is related to the rheology 676
of the material. Adopting a model where the impacted mantle is treated using models with 677
strength can result in a significant decrease of the peak shock pressure compared to that of the 678
hydrodynamic models. This difference in behavior occurs principally in the shallower zone 679
(Zone 1) while in Zone 2 the behavior is similar in both models. We have shown that the peak 680
shock pressure is about an order of magnitude smaller at the bottom of the Zone 1 in the models 681
with strength compared to that in the hydrodynamic models. 682
683
The characteristic of the peak shock pressure in Zone 1 has important consequences on the peak 684
shock pressure in Zone 2, since it determines the pressure in the upper part of Zone 2. Also, the 685
mantle rheology affects the peak shock pressure at the CMB. We have combined our shock-686
pressure scaling laws with the formalism proposed by Watters et al. [2009] to determine the 687
impact heating of a differentiated Mars model by a large impactor. Our results show that the 688
mantle rheology governs the impact heating of a planet and the impact heating may be 689
overestimated when the material strength is not accounted for. 690
691
The martian rheology and its evolution since Mars formation are poorly constrained. However, 692
the two models used in our study (hydrodynamic and with strength) enable us to cover a range of 693
rheology models compatible with different stages of the Martian evolution. Our hydrodynamic 694
models where the mantle is considered as an inviscid fluid may be an interesting proxy to 695
characterize the impact heating during a magma ocean stage [Monteux et al., 2016]. On the other 696
hand, our models with strength are more appropriate to characterize the large impact 697
consequences within a solidified and cold Mars [Watters et al., 2009]. Our results show that the 698
depth of the heated zone is different in the two cases (Figure 14) with a larger thermal anomaly 699
in the hydrodynamics models than in the models with strength as the pressure decay is more 700
rapid in the latter case. In both cases, the shape of the impact-heated region is prolate because of 701
the influence of β on the pressure decay. These effects need to be accounted for in accretionary 702
24 models especially when about 3x10⁵ planetesimals of ~100 km in diameter are needed to build a 703
Mars size planet. 704
705
As illustrated in Figure 13, our parameterized approach is associated to a mean error 706
between our scaling laws and the direct results obtained by the iSALE models that ranges form 707
10 to 14% within the impacted hemisphere. As a consequence, the temperature increase derived 708
from our scaling laws is also associated to this error range. Nonetheless, in the light of the 709
incertitude that goes with our understanding of the early Solar System history and our knowledge 710
of the effects of large impacts, our parameterized approach to calculate the temperature increase 711
within a differentiated Mars-size protoplanet can be considered as a first order estimation. 712
713
As a consequence, the next step toward a better understanding of the early evolution of terrestrial 714
planets is to implement more realistic rheological models in the hydrocode simulations. Such an 715
effort would lead to more reliable scaling laws that could easily be implemented in accretion 716
models to characterize the influence of large impacts on the martian mantle dynamics [e.g. 717
Roberts and Arkani-Hamed, 2012, 2017] or on other terrestrial planets [e.g. Roberts and 718
Barnouin, 2012]. As large impacts are not isolated phenomena during the late regimes of 719
planetary accretions, the scaling laws we have developed are suitable to be implemented in 720
thermal evolution models that consider the accretion histories of growing planets [e.g. Monteux 721
et al., 2014, Arkani-Hamed, 2017]. 722
723
The followings are some shortcomings that require improvements of our scaling laws in the 724
future to be better suited for shock waves travelling inside an actual planet, rather than the simple 725
two-layered planet model where a uniform mantle overlies a uniform core. 726
727
• We have considered vertical impacts, whereas majority of impacts during the accretion of 728
a planet is oblique. The peak shock pressure produced by an oblique impact along the 729
vertical direction beneath the impact site depends on the sine of the impact angle relative 730
to the local horizon (see Figure 3 of Pierazzo and Melosh, [2000]). This implies a shock 731
pressure reduction by a factor of ~0.71 for the most probable impact angle of 45o 732
[Shoemaker, 1962] compared to that of a vertical impact, assuming that all other 733
25 parameters are equal. Moreover, a vertical impact on a spherically symmetric planet 734
preserves the axial symmetry. Because the shock wave velocity in the core is smaller 735
than that in the mantle, the axial symmetry results in the convergence of the refracted 736
wave at the CMB of the impacted hemisphere toward the axis in the core, thus artificially 737
increasing the shock pressure near the axis. However, the near axis enhancement of the 738
shock pressure is negligible except very close to the antipodal CMB [Ivanov et al., 2010; 739
Arkani-Hamed and Ivanov, 2014]. We also note that this artifact does not occur in the 740
mantle because the shock rays are diverging away from the axis of symmetry. It is 741
desirable to adopt oblique impacts in investigating the accretion of a planet. In an 742
oblique impact, the axial symmetry is replaced by a plane symmetry, which avoids the 743
convergence of the waves toward the axis in the expense of introducing more complex 744
and computationally intensive three-dimensional (3D) calculations, besides the 745
substantial increase of the grid points in the computation domain. 746
747
• The distance travelled by a shock wave from the impact site to a given point in the planet 748
is approximated by a straight line, D. In our simplified two-layered planet model with a 749
uniform mantle overlying a uniform core, the first arrival shock wave travels in quiescent 750
medium, hence the shock rays are straight lines until they interact with the core mantle 751
boundary where they bend according to the Snell’s law. Inside a real planet the rays are 752
actually curved due to the pre-impact non-uniform density and temperature gradients in 753
the interior of the planet. Because of the ray curvature a wave travels longer to reach an 754
off axis location in the interior than D. Therefore, our model slightly over estimates the 755
shock pressure experienced in that location. Moreover, because of the ray curvature an 756
incident angle at the CMB and the corresponding refraction angle could be slightly 757
different than those determined by the straight line approximation. However, the core 758
radius is about one half of the planet radius, and the angle β is always smaller than 30°. 759
Bearing in mind that the shock ray along the axis of symmetry is a straight line, the 760
departure of the shock rays from the corresponding straight lines is negligible for these β 761
values. As also mentioned above, the shock wave propagation weakly depends on the β 762
angle that is ranging between 0° (vertical) and 45°, which is already concluded by 763
previous studies [Pierazzo et al., 1997, Monteux and Arkani-Hamed, 2016]. More 764