Kingdom of Morocco
Ministry of National Education, Professional Education, Higher Education
and Research
MOHAMMED THE V UNIVERSITY OF RABAT
MEDICAL AND PHARMACY SCHOOL OF RABAT
MASTER’S THESIS
MASTER of MEDICAL BIOTECHNOLOGY
Presented by:
Supervised by:
Mouad El Aidi
Pr. Azedine Ibrahimi
Pr. Claudio Luchini
Class of: November 2020
Jury Members:
President of the Jury: Nom et Prénom, Grade, Affiliation
Tutor: Pr. Azedine Ibrahimi, PhD, Head of the MedBioTech
Laboratory, Medical School of Rabat.
Tutor: Pr. Claudio Luchini, MD, PhD, Associates Professor University
and Hospital Trust of Verona
Examiner: Pr. Tarik Aanniz, PhD, Medical School of Rabat
Examiner: Pr. Naoual Elomri, MD, Medical School of Rabat
Application of Molecular Biology
Techniques to Cancer Research and
Dedication
I dedicate this work to:To my parents: Malika Talib and M’hammed El Aidi, without whom I would not be
the man I am today. Words cannot describe my love, my admiration and my gratitude to have kind, loving and supporting parents like you. Thank you, I love you more than anything in this world.
To my siblings:
No words are enough to express how much you all mean to me, you are all my beacon of light. To Zineb for teaching me critical thinking and philosophy. To Ibtissam for teaching me how to solve every mathematical problem. To Abderrazak for introducing me to music and art. To
Noreddine for teaching me that being yourself is the most important lesson in life. To Chouaïb
for teaching me to never give up. Lastly, to Moustapha, for teaching me that kindness and forgiveness are the most important qualities in anyone’s life.
I love you all dearly and equally.
To my friends:
To Juliette, for being the best friend you are, for making me believe in fate and for always being there. Your many kindnesses I will always carry with me; you are the purest soul I have ever met. I thank you for being my friend and for being part of my life. I love you. Everything is so hollow, inexplicably terrible, except my friendship with you.
To Mohammad, words cannot describe how much you mean to me. You have been, the greatest friend anyone can ever ask for, I am lucky you are my friend.
To Dr. Hamza, here’s to our friendship, adventures and to Ibn Abdoun High School. You have taught me many things, amongst everything, perseverance and courage to face the darkest times. I am very lucky to have a friend like you in my life.
To Nooman, Maryam, Kaoutar and Fatima Ezzahra you are the source of joy, happiness and laughter in my life. I love you all so much.
Acknowledgements
Immeasurable appreciation and deepest gratitude for the help and support are extended to the following people who in one way or another have contributed in making this study possible.
I would like to express my deep and sincere gratitude to my tutor, my professor, head of our MedBioTech Laboratory, Professor Azedine Ibrahimi whom I admire and respect the most and without whom this work would not have been possible. I thank you from the bottom of my heart for all the help, the support and the guidance.
A special and a sincere gratitude to Professor Aldo Scarpa, for giving me the opportunity to work in his laboratory and among his team of researchers. I will be forever grateful and thankful for this experience.
To Professor Claudio Luchini, my tutor and my mentor, you have welcomed me among your team with open arms and did your best so that I have the best traineeship experience possible. I thank you immensely, for your kindness, your availability and your help throughout my whole experience and specially during the pandemic.
To my MedBioTech Professors, I thank you so much for everything you have taught me. I thank Professor Tarik Aanniz, for his impressive methods of teaching. As well as
Professor Khadija El Maalam, Dr. Naoual El Omri, and many more. I admire you and I highly
respect you.
A special thank you to my Laboratory partners Martina, Tasos, Giada and Nicola for their help and for making me feel welcomed. Thanking you is not enough for everything you have done to help me through my internship, I would like to thank as well all the members of
The Hospital Trust of Verona.
To the members of Jury, who have accepted to assess and evaluate this work. I am thankful and grateful for being part of this modest work.
Abstract
In this study we investigated the role of epithelial to mesenchymal transition (EMT) in undifferentiated carcinoma (UC) and undifferentiated carcinoma with osteoclast-like giant cells (UCOGC) that are two variants of pancreatic ductal adenocarcinoma (PDAC) to highlight potential biological differences between these entities. From a molecular point of view, both UC and UCOGC are very similar to conventional PDAC with common genetic drivers. From a clinical point of view, UC shows a worse prognosis unlike UCOGC that may show a better prognosis if it is not associated with a PDAC component. We analysed the immunohistochemical expression of three well-known markers, Twist1, Snai2 and E-cadherin in 16 cases of UCOGC and 10 cases of UC. EMT was more activated in UC in all cases (10/10) than in UCOGC (8/16 cases). Furthermore, we found EMT was activated in UCOGC with a higher frequency in cases with an associated PDAC component. Snai2 was the most frequently and strongly expressed marker in both tumour types (10/10 UC, 8/16 UCOGC), its expression was higher in UC than in UCOGC. These results gave strong evidence that Snai2 emerged as a central EMT effector as well as highlighting the biology of UC and UCOGC where EMT appeared as an important process in UC.
Résumé
Cette étude avait comme objectif l’investigation de la transition épithélium-mésenchyme (TEM) dans le carcinome indifférencié (CI) et le carcinome indifférencié avec cellules géantes de type ostéoclastique (CICGO) qui sont deux sous-types d’adénocarcinome ductulaire (ACD) pour montrer les différences biologiques entre ces deux variétés. D’un point de vue moléculaire, le CI et le CICGO sont très similaires à l’ACD. Cliniquement, le CI présente un mauvais pronostic contrairement au CICGO qui présente un meilleur pronostic s’il n’est pas associé avec un composé d’ADC. On a analysé l’expression immunohistochimique des trois bien connus marqueurs, Twist1, Snai2 et E-cadhérine dans 16 cas du CICGO et 10 cas du CI. TEM a été plus activé dans le CI (10/10 cas) que dans le CICGO (6/18 cas). De plus, on a trouvé que la TEM a été activée dans le CICGO avec une fréquence plus élevée dans les cas associés aux ACD. Snai2 a été le marqueur le plus exprimé dans les deux types des tumeurs (10/10 CI, 8/16 CICGO), son expression a été plus élevée dans le CI que le CICGO. Ces résultats ont donné une forte affirmation que le marqueur Snai2 est effecteur central dans la TEM ainsi que mettre en évidence la biologie du CI et du CICGO dont la TEM joue un rôle clés dans le CI.
صخلم
امه )ع ض خ م غ س( ةيمظعع هبشلا ةمخضلا ايلاخلا عم ةجردم ريغلا ةناطرسلا وا )م غ س( ةجردم ريغلا ةناطرسلا أ ب س( ةيعولأا وذ سايركنبلا ناطرس نم ناعون ،) طامنا دجاوت مدعب نازيمتي ةقيقدلا ةعيبطلا .ةيددغ ةيباهتللاا دج يه ،)ع ض خ م غ س( دنع ةمهبم اهنلأ ةيمعلبلا ايلاخلا فرط نم ةنميهم ةمخضلا ايلاخلاو هبشلا .ةيمظع رظن ةجو نم ،نكل لأا وذ سايركنبلا ناطرسل ادج ناهباشم امه )م غ س( و )ع ض خ م غ س( ،ةيئيزجلا ايجولويبلا نامساقتي ثيح ،ةيعو نا نكمي )ع ض خ م غ س( نكل ،ديج ريغ اؤبنت رهظي ام ابلاغ )م غ س( ،ايريرس .ةينيجلا تارييغتلا يف ةكرتشم مساوق لوحتلا ةساردل ةيعانم ةيجيسن ةيئايميك تانيع ليلحتب انمق دقل .)أ ب س( نم ابكرم نمضتي نكي مل اذإ اديج اؤبنت رهظي ن ت( يولخلل يجيسنلا تسيوت تائيزجلل )خ 1 يانس ، 2 ل نيريهداكيإو 16 )ع ض خ م غ س( نم ةلاح و 10 تلااح نم )خ ن ت( نا اندجو دقل .)م غ س( رثكأ ( )م غ س( يف ادجاوت 10 / 10 ( )ع ض خ م غ س( نم )تلااح 8 / 16 .)تلااح اندجو دقلو طبترملا تلااحلا يف ةرثكب هليعفت مت )خ ن ت( ،)ع ض خ م غ س( يف هنا اضيا يانس .)أ ب س( نم رصنعب ة 2 نيتلاحلا اتلك يف لايعفت تائيزجلا رثكأ ناك ناك هليعفتو رثكأ لايلق تمهاس جئاتنلا هذه .)ع ض خ م غ س( نم )م غ س( يف هنا ىلع نهرب )خ ن ت( :)ع ض خ م غ س( و )م غ س( فلخ ايجولويبلا مهف يف رثكأ ،)م غ س( يف ادجاوت يانس ناو 2 ل مهم دج رصنع وه يولخلل يجيسنلا لوحتلا ليعفت . ةمهم تاملك: يانس سايركنبلا ناطرس 2 تسيوت ، 1 ةجردم ريغلا ةناطرسلا ،.
Table of Contents :
I. The Pancreas: ... 18
1. Anatomy of the normal pancreas: ... 18
2. The functional components of the normal pancreas: ... 18
2.1. The exocrine pancreas:... 18
II. Pancreatic Cancer: ... 20
1. Epidemiology: ... 20
2. Survival: ... 20
3. Diagnosis and tumour staging: ... 21
4. Surgical treatment: ... 22
5. Oncological treatment: ... 23
5.1. Chemotherapy with curative intent: ... 23
5.2. Palliative chemotherapy: ... 24
6. The PDAC histopathology: ... 24
7. Undifferentiated Carcinoma Vs. Undifferentiated Carcinoma with Osteoclast-like Giant Cells: ... 25
8. Pathogenesis and malignant progression: ... 27
III. Biomarkers in Pancreatic Cancer: ... 28
1. The concept of biomarkers: ... 29
2. Epithelial to Mesenchymal Transition: ... 29
2.1. E-Cadherin: ... 29
2.2. Twist1: ... 30
2.3. Snai2: ... 30
I. Paraffin Embedding Protocol: ... 33
II. Slide Preparation: ... 33
Post-Resection: ... 33
Biobanking Protocol: ... 34
Cryostat Processing: ... 34
III. Haematoxylin-Eosin Coloration: ... 34
1. Histological Samples: ... 34
2. Cytological Samples: ... 35
IV. NGS: ... 35
1. DNA Extraction Protocol: ... 35
1.1. Qubit 2.0 Protocol: ... 37
2. DNA NGS Fragmentation Protocol: ... 37
2.1. Step one: Quality Control ... 37
2.2. Enzymatically fragment the DNA: ... 39
V. Hybridization Capture Method: ... 39
1. Sample Preparation: ... 39
1.1. Hybridization and Capture: ... 48
List of Figures:
Figure 1 Anatomy and histology of the pancreas. A) The anatomy of the pancreas and adjacent anatomical landmarks. B) Schematic illustration of the pancreas histology. C) Close-up of an individual acini surrounded by PSCs. Illustration by G. Andersson. Adapted from Öhlund (2010). ©Umeå University. ... 19 Figure 2 Pancreaticoduodenectomy (Whipple’s procedure). The anatomical locations for
resection (A) and reconstruction (B). Adapted from Wolfgang et al, 2013. Illustration by Corinne Sandone. © Johns Hopkins University. ... 22 Figure 3 Histology of the normal pancreas and PDAC. (A) Normal pancreas tissue. Acinar cells
make up the bulk parenchyma. A duct is marked D. An Islet of Langerhans is marked IL. (B) PDAC tissue. The cancer cells (encircled) are surrounded by vast amounts of desmoplastic stroma. (Scale bar = 100 µm) (Oskar Franklin 2016). ... 25 Figure 4 UCOGC consists of a mixture of neoplastic pleomorphic mononuclear cells and non-neoplastic multinucleated giant cells. (Claudio Luchini, et al. 2017). ... 26 Figure 5 Undifferentiated carcinoma is an epithelial neoplasm with a significant component
showing no glandular structures or other features to indicate a definite direction of differentiation (Hruban & Fukushima 2007). ... 27 Figure 6 The progression from normal epithelia to PDAC via precursor lesions. Examples of
common mutational events are indicated. Adapted from Maitra et al., 2003. © Macmillan Publishers Limited. ... 28 Figure 7 A representative case of undifferentiated carcinoma of the pancreas with osteoclast-like giant cells, with an associated ductal adenocarcinoma, is shown. a Haematoxylin-eosin staining reveals an undifferentiated carcinoma with atypical cells and the presence of multinucleated osteoclast-like giant cells; neoplastic glands of the associated ductal adenocarcinoma are also evident (original magnification: × 20). b Snai2 is expressed by undifferentiated neoplastic cells, while neoplastic glands are totally negative (original magnification: × 20). c Twist1 is expressed by undifferentiated neoplastic cells, while neoplastic glands are totally negative (original magnification: × 20). d E-cadherin expression is lost by undifferentiated neoplastic cells, while it is retained by neoplastic glands (original magnification: × 20) ... 59 Figure 8 A representative case of undifferentiated carcinoma of the pancreas with osteoclast-like giant cells (without an associated ductal adenocarcinoma) is shown. a Hematoxylin-eosin staining reveals an undifferentiated carcinoma with atypical cells and the presence
of multinucleated osteoclast-like giant cells (original magnification: × 20). b Snai2 is expressed by undifferentiated neoplastic cells, while multinucleated osteoclast-like giant cells are totally negative (original magnification: × 20). c Twist1 is expressed by undifferentiated neoplastic cells, multinucleated osteoclast-like giant cells are totally negative (original magnification: × 20). d E-cadherin expression is lost by undifferentiated neoplastic cells (original magnification: × 20). ... 61 Figure 9 A representative case of undifferentiated carcinoma of the pancreas is shown. a
Haematoxylin-eosin staining reveals an undifferentiated carcinoma with atypical cells lacking any glandular organization. On the left, there is a thin band of normal pancreatic parenchyma (original magnification: × 20). b Snai2 is expressed by most of neoplastic cells and not expressed by normal pancreatic parenchyma (original magnification: × 20). c Twist1 is totally negative in neoplastic and normal tissues (original magnification: × 20); d E-cadherin expression is lost by neoplastic cells, with the normal pancreatic parenchyma as an internal positive control (original magnification: × 20) ... 63 Figure 10 Graphical representation of the prevalence of epithelial-mesenchymal transition
(EMT) activation in undifferentiated carcinoma of the pancreas with osteoclast-like giant cells (UCOGC), without and with an associated ductal adenocarcinoma, and in undifferentiated carcinoma of the pancreas without osteoclast-like giant cells (UC) ... 64
List of Tables:
Table 1 The 5-year survival of the four most common cancer formscompared to pancreatic
cancer, by disease stage (Siegel et al., 2016). ... 21
Table 2 Preparation of Ligation master mix ... 41
Table 3 Thermal cycler program for End Repair/dA-Tailing* ... 42
Table 4 Preparation of End Repair/dA-Tailing master mix ... 42
Table 5 Thermal cycler program for Ligation* ... 43
Table 6 Pre-Capture PCR Thermal Cycler Program* ... 45
Table 7 Pre-capture PCR cycle number recommendations ... 45
Table 8 Preparation of Pre-Capture PCR Reaction Mix ... 46
Table 9 Pre-programmed thermal cycler program for Hybridization* ... 48
Table 10 Preparation of RNase Block solution ... 49
Table 11 Preparation of Capture Library Hybridization Mix for Capture Libraries ≥3 Mb .... 49
Table 12 Post-capture PCR Thermal Cycler Program ... 52
Table 13 Preparation of post-capture PCR Reaction mix ... 53
Table 14 Summary table of the main clinic-pathological features of all investigated cases and of immunohistochemical results in UCOGC ... 58
Table 15 Summary table of the main clinic-pathological features of all investigated cases and of immunohistochemical results in UC ... 60
List of Abbreviations:
PDAD: Pancreatic Ductal Adenocarcinoma UC: Undifferentiated Carcinoma
UCOGC: Undifferentiated Carcinoma with Osteoclast-like Giant Cells PCR: Polymerase Chain Reaction
NGS: Next Generation Sequencing EMT: Epithelial-Mesenchymal Transition µl: Microliter
°C: Degree Celsius
FFPE: Formalin Fixed Paraffin Embedded µm: Micrometre
OCT: Optimal Cutting Temperature compound cm: centimetre
min: Minute sec: Second °: Degree ETOH: Ethanol
rpm: Round per Minute gDNA: Genomic DNA dsDNA: Double Strand DNA OD: Optical Density
Pancreatic ductal adenocarcinoma represents the seventh leading cause of death for cancer in the world in the last years, causing over 300,000 deaths per year (Kamisawa T. et al. 2016). The most common subtype of pancreatic cancer is pancreatic ductal adenocarcinoma (PDAC) (Kamisawa T. et al. 2016 & Luchini. et al. 2016). The spectrum of PDAC also includes some morphological variants, one of which is the undifferentiated carcinoma (UC), a distinct and hypercellular tumour entity, composed of neoplastic cells without ductal/glandular architecture (Who 2019 & Luchini C. et al. 2016). Within this PDAC subgroup, there is an even more particular variant, which is the undifferentiated carcinoma with osteoclast-like giant cells (UCOGC). This is morphologically very similar to UC, with the addition of histiocytes and osteoclast-like giant cells intermingled with tumour cells (Who 2019 & Luchini C. et al. 2016).
A single study reported the involvement of the epithelial to mesenchymal transition (EMT) in the UC variant, but no information is available for UCOGC (Dongre A. & Weinberg RA 2019). EMT is a biological process in which the epithelial elements lose their polarity and cell-to-cell contacts, undergo cytoskeleton remodelling with morphological modifications, and acquire migratory capacity (Franceschi T. et al. 2019). EMT has recently emerged as a crucial biological mechanism in undifferentiated carcinomas of other organs (Beuselinck B. et al. 2014 & Galván JA. et al. 2015), and in PDAC has been strongly associated to poor prognosis (Kohler I. et al. 2015 & Ishida K. et al. 2019).
Here we investigated the potential role played by EMT in UC and UCOGC, through the assessment of the immunohistochemical expression of three well-known EMT factors: Twist1, Snai2 and E-cadherin. Our results may help to better understand the biological role of these PDAC sub-types as well as highlighting the potential role played by EMT.
I. The Pancreas:
1. Anatomy of the normal pancreas:
The pancreas is a retroperitoneal organ that extend horizontally along the posterior abdominal wall at lumbar spine level L1-2. It is roughly J-shaped and can be divided into the head (caput), body (corpus) and tail (cauda). The main pancreatic duct (ductus pancreaticus) runs from head to tail and fuses with the common bile duct in the pancreas head. The fused ducts enter the duodenum via the Papilla of Vater to excrete pancreatic juice and bile into the gastrointestinal canal. The pancreas lies proximal to large arteries and veins that provides blood supply to the organ and are of importance in pancreatic cancer staging and surgery. These include branches from the celiac axis (truncus coeliacus), the splenic artery, the superior mesenteric vein and artery and the portal vein (Drake et al, 2015).
2. The functional components of the normal pancreas:
The pancreas has two glandular components – the endocrine and the exocrine pancreas (Figure 1B). The endocrine pancreas resides in islets of Langerhans, cell clusters that synthesise hormones involved in carbohydrate, fat and protein metabolism, including insulin and glucagon (Ross & Pawlina 2006). The exocrine pancreas constitutes >90% of the organ and secrete enzymes involved in food digestion. This thesis focuses on pancreatic ductal adenocarcinoma, that originate from epithelial cells in the exocrine pancreas.
2.1. The exocrine pancreas:
The exocrine pancreas is made up of secretory glands, acini, composed of acinar cells, and ductal systems that transport acinar cell secretions. The acinar cells secrete zymogen granules that are transported in the pancreatic juice via ducts lined by ductal epithelium, to end up in the gastrointestinal canal via the main pancreatic duct (Figure 1C). The zymogen granules contain enzymes that serve to digest proteins, carbohydrates, nucleic acids and lipids in the food. The protein digesting enzymes (endopeptidases) are inactive until they reach the duodenal mucosa to prevent auto digestion of the organ (Ross & Pawlina 2006). Obstructing gall stones, excessive alcohol intake and tissue trauma can cause disturbances in this system leading to auto-digestion and acute pancreatitis. Longstanding tissue stress and inflammation cause chronic pancreatitis, characterised by organ fibrosis (Banks et al, 2010). Pancreatic stellate cells (PSCs) are located in the basal aspect of acinar cells and are characterised by cytoplasmic lipid depositions and long cytoplasmic projections that extend along adjacent acini (Figure 1C). In the normal pancreas, PSCs are quiescent and few in
number. Pancreatic injury or tissue stress activates PSCs, which result in morphological changes, increased proliferation and increased synthesis of extracellular matrix components. This is central to the development of a distorted fibrosis (desmoplasia), that is typical for the stroma in both chronic pancreatitis and pancreatic cancer (Erkan et al, 2012).
Figure 1 Anatomy and histology of the pancreas. A) The anatomy of the pancreas and adjacent anatomical landmarks. B) Schematic illustration of the pancreas histology. C) Close-up of an individual acini surrounded by PSCs. Illustration by G.
II. Pancreatic Cancer:
Pancreatic cancer is ranked as the 14th most common cancer and the 7th highest cause of cancer mortality in the world (Globocan). Pancreatic cancer is associated with a very poor prognosis, highlighted by the close parallel between disease incidence and mortality. (Siegel R, Ma J, Zou Z. 2014). 5-year survival in patients with pancreatic cancer remains as low as 6% in the USA (Sonja Gillen et al. 2010). The low survival rate is attributed to several factors, of which perhaps the most important is the late stage at which most patients are diagnosed. Most patients with pancreatic cancer are asymptomatic until the disease develops to an advanced stage. Up to 20% of patients are eligible for initial resection (Sonja Gillen et al. 2010). Even after potential curative resection, most patients will eventually have recurrence, and 5-year survival of completely resected patients is only up to 25% (Siegel R, Ma J, Zou Z 2014).
Pancreatic cancer is a lethal malignancy, and it is predicted to become the second most common cause of cancer death by 2030 (Rahib L. et al. 2014). The most common pancreatic malignancy is pancreatic ductal adenocarcinoma (PDAC), an infiltrating neoplasm with glandular differentiation (Bosman FT. et al. 2010). The molecular landscape of PDAC is well characterized and includes somatic alterations in four driver genes in the majority of PDACs: the oncogene KRAS and the tumour suppressor genes TP53, CDKN2A, and SMAD4 (Yashida S. et al. 2010 & Bailey P. et al. 2016). Several other driver genes are altered at lower prevalence in PDAC (Yashida S. et al. 2012 & Bailey P et al. 2016).
1. Epidemiology:
In Morocco, 848 patients were diagnosed with pancreatic cancer in 2018, with a peak incidence in the ages between 60-80 years. It is ranked the 14th leading cause of cancer with
707 deaths in 2018 (WHO 2018). Risk factors include smoking, chronic pancreatitis, diabetes mellitus, obesity as well as up to a 13-fold increased risk in individuals with certain genetic syndromes such as Peutz-Jeghers syndrome and BRCA2 syndrome (Wolfgang CL. et al, 2013). However, most PDAC tumours are not caused by inherited mutations, but occur sporadically due to extrinsic factors, such as carcinogens, or intrinsic factors, such as random mistakes during DNA replication (Vincent et al, 2011; Makohon-Moore & Iacobuzio-Donahue 2016).
2. Survival:
Pancreatic cancer patients have the worst long term survival rates among all cancer forms (Table 1) (Siegel et al, 2016). The main reason is that most patients are diagnosed with metastatic or locally advanced disease, when curative surgery is unfeasible (Kamisawa et al,
2016). As a consequence, only 2 out of 10 patients are diagnosed with early stage disease and can be offered surgery with curative intent. However, early tumour relapse is common after surgery. The median postoperative survival for early staged patients that undergo surgery is less than 2 years, the five-year survival is 27% and only one out of eight are actually cured (Bilimoria et al, 2007; Schnelldorfer et al, 2008; Siegel et al, 2016). Moreover, the prognosis has barely improved at all during the past 30 years, while a substantially improved survival has been accomplished in other cancer forms, such as breast and prostate cancer (Siegel et al, 2016). Consequently, pancreatic cancer is expected to become the second most common cause of cancer related deaths by the year 2020 (Rahib et al, 2014).
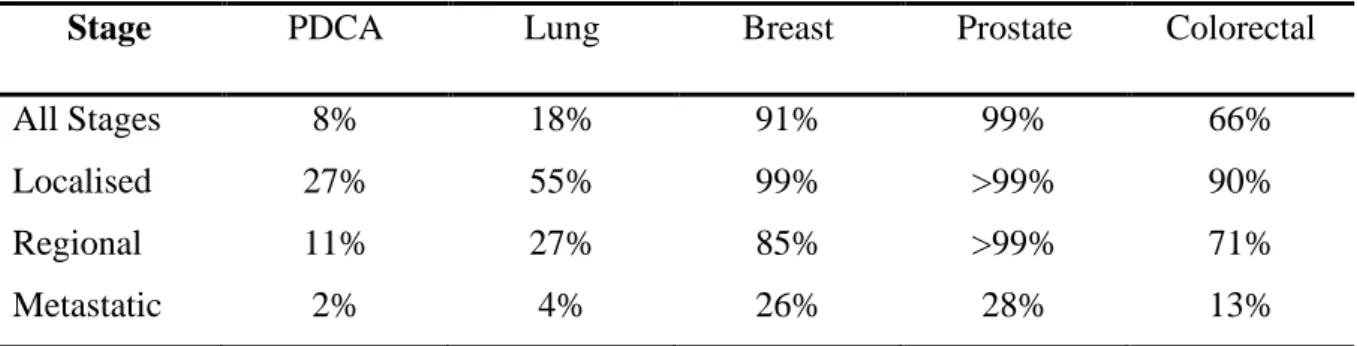
Table 1 The 5-year survival of the four most common cancer forms compared to pancreatic cancer, by disease stage (Siegel et al., 2016).
Stage PDCA Lung Breast Prostate Colorectal
All Stages 8% 18% 91% 99% 66%
Localised 27% 55% 99% >99% 90%
Regional 11% 27% 85% >99% 71%
Metastatic 2% 4% 26% 28% 13%
3. Diagnosis and tumour staging:
PDAC is generally asymptomatic until it impacts on adjacent tissue or metastasise. Common symptoms of PDAC include fatigue (86%), weight loss (85%), abdominal pain (79%), dark urine (59%) and jaundice (56%). Jaundice is a common clinical sign in patients with early stage disease and presents as yellowing skin and episclera. This is due to hyperbilirubinemia secondary to tumour obstruction of the common bile duct (Porta et al, 2005).
Imaging modalities for PDAC detection include contrast-enhanced computed tomography (CT), magnetic resonance imaging (MRI), magnetic resonance cholangiopancreatography (MRCP), and ultrasound (abdominal or endoscopic) (Lee & Lee 2014). The main determinant of resectability is involvement of nearby arteries and veins, as long as no metastases are discovered. The disease is staged according to the TNM staging system. Stage I-II patients are candidates for surgery, whereas stage III patients are considered borderline resectable. Stage IV equals metastatic cancer and is not curable with surgery (Appel et al, 2012).
4. Surgical treatment:
Surgery is commonly performed as a pancreaticoduodenectomy (Whipple´s procedure) for tumours in the head, or a distal pancreatectomy for tail tumours. Here follows a brief description of the Whipple procedure.
First the abdominal cavity is entered with a midline incision and examined to exclude eventual metastasis missed by CT/MRI. Then the large vessels are exposed followed by resection of the pancreatic head and regional lymph nodes, the entire duodenum, a distal portion of the stomach, the proximal jejunum, the common bile duct and the gall bladder. The specimen is removed en bloc. Finally, gastrointestinal continuity is restored by connecting the common hepatic duct, the remaining pancreas and the remaining stomach with jejunum.
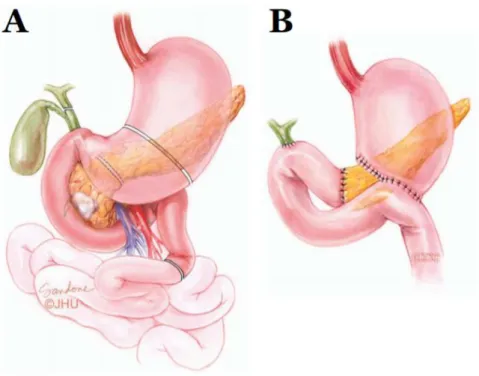
Figure 2 Pancreaticoduodenectomy (Whipple’s procedure). The anatomical locations for resection (A) and reconstruction (B). Adapted from Wolfgang et al, 2013. Illustration by Corinne Sandone. © Johns Hopkins University.
It takes roughly 2-3 months to recover from the operation and the perioperative mortality rate is 2-3 % (Wolfgang et al, 2013). Evidence for the benefit of surgery is purely observational; an improved survival has been shown in resected patients vs. non-resected at early stages and there are reports of 100% 5-year survival in <1 cm sized tumours (Ariyama et al, 1998; Wagner et al, 2004; Bilimoria et al, 2007). An early diagnosis and a radical surgery are crucial elements in order to survive pancreatic cancer.
5. Oncological treatment:
Pancreatic cancer remains a highly lethal disease. By the time patients are diagnosed, the disease may often be advanced, precluding patients from surgery. Recent advances in chemotherapeutic regimens have not only improved our ability to treat patients with metastatic disease, but have also shown favourable outcomes in the neoadjuvant setting; Advances in imaging technology and a better understanding of the pathogenesis of pancreatic cancer are allowing earlier diagnosis and early aggressive management of potentially pre-malignant entities; Emergence of high volume centers, the incorporation of imaging technology, and the availability of specialty services, such as interventional radiology, have reduced perioperative morbidity and mortality associated with pancreaticoduodenectomy. Furthermore, advances in surgical technology are allowing these procedures to be performed in less invasive fashion and are demonstrating safety and feasibility (Mohammed S. et al. 2014).
Despite these advances, there remains room for improvement. Today’s pancreatic oncologists must focus on further understanding the genetic and molecular factors contributing to oncogenesis and on the development of more targeted and less toxic systemic therapies (Mohammed S. et al. 2014).
5.1. Chemotherapy with curative intent:
Adjuvant chemotherapy is offered to all patients that recover from surgery. The standard regimens are gemcitabine (GEM) or fluorouracil based chemotherapy (5-FU), which are equally effective (Neoptolemos et al, 2010). There is evidence for 5-year survival benefits with these therapies, compared to placebo (21-29% vs. 10-11%), but the median survival difference is only a few months (22-23 vs. 17-20 months) (Neoptolemos et al, 2004; Oettle et al, 2013). This indicate that only a subset of patients truly benefits from these treatments. While a plethora or studies have failed to find better options, a recently published Japanese trial showed remarkable results for S1, an oral fluorouracil pro-drug compared to GEM. The study was discontinued at interim analysis since the S-1 arm had a remarkably higher median survival (46.5 months vs. 25.5) and 5-year survival rates (44% vs. 24%) (Uesaka et al, 2016). Oral S-1 therapy is currently being evaluated in western populations since the pharmacodynamics and kinetics differ.
Neo-adjuvant therapy for PDAC is a controversial subject. In favour of preoperative chemotherapy is a higher chance of a radical resection, but it also delays potentially curative
surgery. There is currently no strong evidence advocating neo-adjuvant therapy for resectable nor borderline resectable PDAC (Kamisawa et al, 2016).
5.2. Palliative chemotherapy:
The most effective palliative treatment for metastatic PDAC patients is the combination of 5-FU, leucovorin, irinotecan and oxaliplatin (FOLFIRINOX), demonstrated to be superior to GEM (median survival 11.1 vs. 6.8 months) in the ACCORD-11 trial (Conroy et al, 2011). However, the external validity of that study is limited by its strict inclusion criteria (patients aged ≤ 75 years, good performance status, no cardiac disease and low risk of developing cholestasis). The MPACT study showed a less impressive median survival improvement with albumin bound (nab)-paclitaxel plus GEM (8.5 vs 6.7 months vs. GEM alone) but had less strict inclusion criteria (Von Hoff et al, 2013). Additionally, nab-paclitaxel+GEM was associated with less severe adverse advents than FOLFIRINOX, advocating its use in patients unfit for FOLFIRINOX treatment. Studies evaluating the use of FOLFIRINOX and Nab-paclitaxel in the adjuvant setting are ongoing.
6. The PDAC histopathology:
Pancreatic ductal adenocarcinoma is believed to develop from ductal cells in the normal pancreas, although in vitro and in vivo studies have suggested that it might develop from acinar cells undergoing ductal metaplasia (Rooman & Real 2012). Under the microscope, the malignant cells form duct-like glandular structures of varying differentiation grades, surrounded by stromal desmoplasia; a voluminous tumour stroma consisting of distorted fibrosis. Other characteristics include a haphazard growth pattern violating the tissue architecture, vessel and nerve invasion, nuclear pleomorphism, necrotic debris within the glands and disrupted glandular lumina. The tumours are graded as well differentiated (Grade 1), moderately differentiated (Grade 2) and poorly differentiated (Grade 3) based on the glandular architecture, mitosis frequency and nuclear pleomorphism (Hruban & Fukushima 2007).
Figure 3 Histology of the normal pancreas and PDAC. (A) Normal pancreas tissue. Acinar cells make up the bulk parenchyma. A duct is marked D. An Islet of Langerhans is marked IL. (B) PDAC tissue. The cancer cells (encircled) are
surrounded by vast amounts of desmoplastic stroma. (Scale bar = 100 µm) (Oskar Franklin 2016).
7. Undifferentiated Carcinoma Vs. Undifferentiated Carcinoma with
Osteoclast-like Giant Cells:
Undifferentiated carcinoma with osteoclast-like giant cells (UCOGC) is a rare pancreatic carcinoma composed of pleomorphic neoplastic mononuclear cells, intermixed with large non-neoplastic multinucleated giant cells (Bosman FT. et al. 2010). Notably, there are few molecular studies of UCOGC, though frequent KRAS mutations have been reported (Westra WH. et al. 1998 & Imai Y. et al. 1999). Variable outcomes have been reported, although a recent clinical analysis of patients with UCOGC suggested an improved clinical course compared with conventional PDAC (Muraki T. et al. 2016). A recent study exploring the potential role of inflammatory cells in driving the distinct morphological features of UCOGC, found that the massive recruitment of CD163 positive tumour-associated macrophages and the activation of the PD-1/PDL1 axis may partly explain its characteristic aspects (Luchini C. et al. 2018).
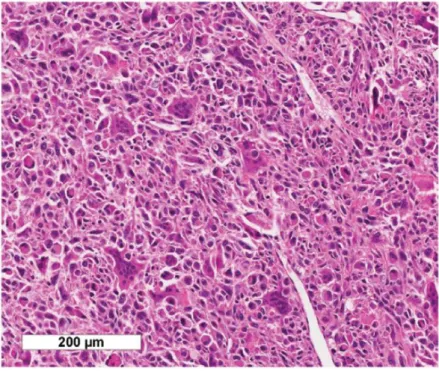
Figure 4 UCOGC consists of a mixture of neoplastic pleomorphic mononuclear cells and non-neoplastic multinucleated giant cells. (Claudio Luchini, et al. 2017).
The spectrum of PDAC also includes some morphological variants, one of which is the undifferentiated carcinoma (UC), a distinct and hypercellular tumour entity, composed of neoplastic cells without ductal/glandular architecture (WHO & Luchini C. et al. 2016). From the clinical point of view, compared to conventional PDAC, UC usually show a worse prognosis, whereas UCOGC is generally associated to a better prognosis, when not associated with a PDAC component (WHO & Luchini C. et al. 2017 & Muraki T. et al. 2016).
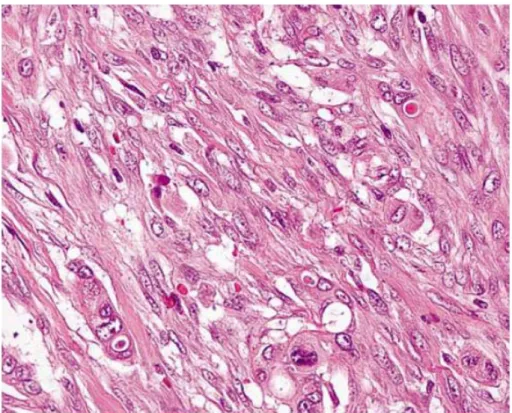
Figure 5 Undifferentiated carcinoma is an epithelial neoplasm with a significant component showing no glandular structures or other features to indicate a definite direction of differentiation (Hruban & Fukushima 2007).
Some studies have demonstrated that UC and UCOGC have a molecular landscape very similar to PDAC, based on alterations that affect the classic PDAC drivers, including the oncogene KRAS and the tumour suppressor genes TP53, SMAD4, and CDKN2A (Luchini C. et al. 2017 & Westra WH. et al. 1998 & Li J. et al. 2020).
8. Pathogenesis and malignant progression:
The progression from normal epithelial cells via precursor lesions to pancreatic cancer cells with metastatic potential involves the acquisition of certain capabilities – hallmarks of cancer. These include sustained proliferative signalling, evasion of growth suppression, resisting apoptosis, inducing angiogenesis, enabling replicative immortality and activating invasion and metastasis. The hallmarks arise from mutations leading to up regulation of oncogenes and down regulation of tumour suppressors, thereby governing the tumour behaviour (Hanahan & Weinberg 2011).
KRAS is mutated in >90% of PDAC tumours. Additionally, a large number of more infrequent mutations have been described, highlighting the heterogeneous mutational landscape in PDAC (Kanda et al, 2012; Makohon Moore & Iacobuzio-Donahue 2016).
KRAS mutation is an early mutational event, evident by a high prevalence already in PanIN1-lesions. However, a KRAS mutation alone is insufficient for PDAC progression, and
additional driver mutations follow during PanIN-progression and clonal expansion, such as loss of CDK2NA/p16 in PanIN-2 and loss of TP53, SMAD4/DPC4 and BRCA2 in PanIN-3 lesions (Maitra et al, 2003) (Figure 4). The PanIN to PDAC progression has been recapitulated in transgenic mice with inducible KRAS and TP53 mutations (KPC mice) (Hingorani et al, 2005). PDAC tumours most commonly metastasise to the peritoneal cavity, lungs and the liver (Wolfgang et al, 2013). Metastasising cancer cells undergo phenotypical changes called epithelial to mesenchymal transition (EMT). EMT is characterised by an altered expression of adhesion molecules, a mesenchymal-like morphology and an up regulation of transcription factors that are involved in this process (Lamouille et al, 2014). Interestingly, PanIN cells can undergo EMT and seed to distant organs even before PDAC develops in mouse models, indicating that the metastasis cascade might occur early in the PDAC progression (Rhim et al, 2012).
Figure 6 The progression from normal epithelia to PDAC via precursor lesions. Examples of common mutational events are indicated. Adapted from Maitra et al., 2003. © Macmillan Publishers Limited.
Others claim that metastasis occur late in the progression. Yachida et al. calculated time intervals in PDAC progression based on the differences and similarities in the mutational profiles of autopsied primary tumours and metastases. They concluded that distant metastasis is a late event in pancreatic cancer, with over a decade from the first driver mutation to metastasis initiation (Yachida 2010). This suggests that there is a window of opportunity for early detection of PDAC.
III. Biomarkers in Pancreatic Cancer:
In this thesis, potential prognostic and diagnostic PDAC biomarkers are sought in the tissue. The concept of biomarkers is introduced through an exploratory study aimed to assess the immunohistochemical expression of three well-known EMT factors: E-Cadherin, Twist1 and Snai2 and their role in UC and UCOGC.
1. The concept of biomarkers:
Biomarkers can potentially aid in early detection, in differential diagnostics, by predicting treatment response and by monitoring disease relapse. A definition has been proposed by the World Health Organisation as: “any substance, structure, or process that can be measured in the body or its products and influence or predict the incidence of outcome or disease” (WHO 2001).
2. Epithelial to Mesenchymal Transition:
EMT is a biological process in which the epithelial elements lose their polarity and cell-to-cell contacts, undergo cytoskeleton remodelling with morphological modifications, and acquire migratory capacity (Franceschi T. et al. 2019). EMT has recently emerged as a crucial biological mechanism in undifferentiated carcinomas of other organs (Beuselinck B. et al. 2014) (Galván JA. et al. 2015), and in PDAC has been strongly associated to poor prognosis (Kohler I. et al. 2015) (Ishida K. et al. 2019).
2.1. E-Cadherin:
The E-cadherin–catenin complexes represent the main adhesion system responsible for the maintenance of cell-cell contacts in epithelial tissues (Takeichi, 1995; Huber et al., 1996). Downregulation of E-cadherin expression or functional perturbations of the E-cadherin–catenin complexes have been found to occur very frequently during the progression of carcinomas (Takeichi, 1993; Birchmeier and Behrens, 1994; Christofori and Semb, 1999). The loss of E-cadherin expression has been shown to be responsible for the loss of intercellular adhesion occurring during invasion (Perl et al., 1998). As a consequence, during the invasive process, tumour cells not only lose their cell-cell adhesion properties but also frequently undergo profound changes in their phenotype known as epithelial to mesenchymal transitions (EMTs) (Behrens et al., 1992; Christofori and Semb, 1999). The invasive process is reminiscent of the EMTs that occur during defined stages of embryonic development, such as during mesoderm formation at the primitive streak and the delamination of the neural crest cells from the neuroectoderm (Bellairs, 1987; Burdsal et al., 1993). The EMTs that occur both during development and tumour invasion are associated with the functional loss of E-cadherin.
The molecular bases of the E-cadherin downregulation during tumour progression have started to be elucidated in the past years. The present evidence indicates that silencing of E-cadherin expression may involve genetic and epigenetic changes (Christofori and Semb, 1999). Among them, hypermethylation of the E-cadherin promoter and transcriptional repression are
emerging as predominant mechanisms in most carcinomas (Risinger et al., 1994; Yoshiura et al., 1995; Henning et al., 1996; Giroldi et al., 1997; Hajra et al., 1999; Rodrigo et al., 1999; Tamura et al., 2000; Cheng et al., 2001). Several independent factors, Snail, E47, ZEB-1 (δEF-1) and SIP-1 (ZEB-2), have been recently characterized as transcriptional repressors of E-cadherin acting through interaction with specific E-boxes of the proximal promoter (Cano et al., 2000; Batlle et al., 2000; Perez-Moreno et al., 2001; Grooteclaes and Frisch, 2000; Comijn et al., 2001).
2.2. Twist1:
TWIST1 is a crucial transcription factor required for EMT and CSC. TWIST1 is up-regulated in various cancers and have a positive correlation with poor prognosis. TWIST1 can promote EMT, and is widely expressed in human cancers. High expression of TWIST1 points to high rate of metastasis, chemotherapeutic resistance and poor prognosis (Brabletz T. et al. 2012 & Qin Q. et al. 2012). TWIST1 participates in CSC, and TWIST1-BCL2 dependent pathway can sustain CSC (Banerjee A. et al. 2012). Epigenetically, MTDH can facilitate histone H3 acetylation on the TWIST1 promoter, and then increased TWIST1 drive the CSC expansion (Liang Y. et al. 2015). (Ying Kong et al. 2015) found that Hedgehog pathway maintains the tumour-initiating cell like properties by controlling the expression of TWIST1 and SNAIL.
2.3. Snai2:
Snai2, encoded by the SNAI2 gene (formerly known as Slug), is one of three members of the Snail family of zinc-finger transcription factors (TFs). It is highly conserved among vertebrate species and widely regarded as a prototypical epithelial-to-mesenchymal transition transcriptional factor (EMT-TF) (Barrallo-Gimeno, 2005; Nieto, 2002; Thiery, 2002). As an EMT-TF, Snai2 promotes loss of cell adhesion and polarity while conferring migratory and invasive capabilities (Bolós et al., 2003; Hajra et al., 2002).
Over the past decade, the discovery of how EMT contributes to cancer progression and metastasis led to an appreciable body of evidence supporting a critical role for Snai2 and other EMT-TFs in promoting malignant cancer cell behaviour (De Craene and Berx, 2013; Lamouille et al., 2014; Peinado et al., 2007).
Snai2 overexpression is a widespread phenomenon in human cancers and notably predicts poor prognosis in cancer patients (Cobaleda et al., 2007; Coll-Bonfill et al., 2016; De Craene and Berx, 2013; de Herreros et al., 2010; Lamouille et al., 2014; Shih and Yang, 2011). A defining feature underpinning the functional versatility of Snai2 is its ability to act as a transcriptional repressor. As a member of the Snail TF family, Snai2 contains five consecutive
C-terminal zinc fingers, which facilitate its binding to E-box consensus CAGGTG motifs of target genes. It also contains an evolutionarily conserved N-terminal SNAG domain that mediates the recruitment of various chromatin regulators to epigenetically silence the
expression of its target genes.
The most notable of its target genes is CDH1, which encodes the epithelial cell adhesion molecule E-cadherin; however, a plethora of other Snai2 target genes have been identified more recently (Bai et al., 2017; Bolós et al., 2003; Cobaleda et al., 2007; Hajra et al., 2002; Phillips et al., 2014; Tien et al., 2015; Wu et al., 2005).
I. Paraffin Embedding Protocol:
-Fix tissues with 100% formalin for 24 to 28 hours at room temperature. Tissue need to be totally submerged in formalin. Fixative volume should be 5 to 10 times of the tissue volume. -Tissue is sectioned into thin slices (2 to several mm).
-The tissue is placed in plastic cassettes for analysis. Tissue should fit properly in the cassettes to allow access to all of the reagents.
-Paraffin Embedding procedure:
-70% Ethanol, two changes, 1 hour each -80% Ethanol, one change, 1 hour -95% Ethanol, one change, 1 hour
-100% Ethanol, three changes, 1.5 hour each -Xylene, three changes, 1.5 hours each
-Paraffin wax (58 to 60 °C), two changes, 2 hours each -Embedding tissues into paraffin blocks
-Trim paraffin blocks as necessary before proceeding into cutting the slices. -A microtome is used to generate a thin slice of 3.5 µm.
-Place the paraffin ribbon in water bath at about 40 to 45 °C. -Mount onto the slides.
-Proceed to Haematoxylin/Eosin colouring.
Note: To generate the slices, the machine of choice used for cutting is the Microtome.
II. Slide Preparation:
Post-Resection:
The organ or part of the organ is examined by a pathologist to locate tumours and determine the size, aspect and morphology of the organ. Samples are taken from the pancreas; size depends on the purpose the sample is intended to. After the examination, the pathologist
decides the number of the samples needed, if biobanking (cryogenic preservation) is needed, immunohistochemistry staining and FFPE.
Biobanking Protocol:
After every resection, a sample is saved in the biobanking following these steps:
-OCT is placed on a piece of carton, and then the sample is placed on top of the OCT. the proportions of the sample (1cmx0.8cmx0.5cm) are compatible with the preservation tube. -Then the sample is placed to freeze on the vapour of the liquid nitrogen for 5min. the sample is then put in a tube with an ID and stored in the Biobank (-80°C) for research use only.
Cryostat Processing:
-The sample is covered entirely with OCT and well placed on the block -The tissue is put in the cooling chamber -80°C.
-The brush guides the tip of the tissue.
-The tissue section is gently spread over the antiroll plate and later picked up by touching a glass slide.
-The slides then proceed to Eosin/Haematoxylin colouring.
III. Haematoxylin-Eosin Coloration:
1. Histological Samples:
-Cut the Slices using The Cryostat. -Fixate in FineFix or alcohol 95° /100°. -Hydrate with current water.
-Pass it through distilled water.
-Colour with Haematoxylin of Mayer for 60 seconds. -Pass it through distilled water.
-Pass it through current water for at least 1 min. -Pass it through alcohol 95°/100°
-Colour with Eosin for 20 sec.
-Dehydrate with 3 fast passages in alcohol 100°. -Clarify with 3 passages in Xylene.
-Mount the slides using Entellan (an Automatic Mounting Device).
2. Cytological Samples:
-Fixate in FineFix or alcohol 95°/100°. -Wash with current water.
-Pass it through distilled water.
-Colour with Haematoxylin of Mayer for 20 seconds. -Passage in distilled water.
-Differentiate with current water for at least 1 min. -Passage in alcohol 95°.
-Colour with Erythrosine for 8 seconds.
-Dehydrate with 3 fast passages in alcohol 95°. -Dehydrate with 3 fast passages in alcohol 100°. -Clarify with 3 fast passages in Xylene.
-Mount the slides using Enterllan (an Automatic Mounting device).
IV. NGS:
1. DNA Extraction Protocol:
• Step one: Collecting tissue:
-Tissue collection was performed using two methods: 1- Micro Collection:
Which is a method of tissue collection under the microscope where the pathologist carefully selects tumour tissue to collect.
2- Full Collection: Where the pathologist draws margins around the targeted tissue using the microscope on the slides with a marker, using a syringe, tumour tissue is collected and stored in the Buffer.
-The collected DNA is stored at -20 C or proceeded immediately.
-The collected DNA is added to a solution of 180 µl of ATL QIA amp DNA FFPE Tissue Kit (50) inside an Eppendorf.
• Step Two: Extraction process:
-20 µl of protease K is added to the solution and put into a Thermomixer at 56 C for 3H where the colour turns from blue to transparent, then for another 45 min at 90 C to activate the protease K.
-The solution is then put inside a column kit: QIA amp MinElute Column in the following steps. -Preparing the list of the patients’ ID and the list for the DNA Quantification (Facultative). -Add 200 µl of ETOH 100% inside every sample before putting the solutions inside the columns.
-Add 200 µl of AL Buffer and then transfer immediately inside the columns, mixing with the micropipette until the mixture is homogenous. -Centrifuge at 8000 rpm, 1 min at room temperature.
-Discard the waste and then put the column in a new collection tube. -Add 500 µl of Wash Buffer 1.
-Centrifuge at 8000 rpm for 1 minute at room temperature.
-Discard the waste and then put the column in a new collection tube. -Add 500 µl of Wash Buffer 2.
-Centrifuge at 8000 rpm for 1 minute at room temperature.
-Discard the waste and then put the column in a new collection tube. -Centrifuge at 13000 rpm for 2 minutes at room temperature.
-Discard the waste and then prepare the Eppendorfs.
-Add 60 µl of nuclease free water, wait 5 minutes at room temperature. -Centrifuge at 8000 rpm for 1 min discard the column.
-Qubit 2.0 with only 1 µl. 1.1. Qubit 2.0 Protocol: The Protocol for One Sample: High Sensitivity Protocol:
-For each sample we add 199 µl. 1 sample + 2 Standards + one more sample added. -1 µl of Fluorophore for every sample.
-For the standard tubes:
-Add 190 µl of the mix + 10 µl of the Standard Buffer1 in Tube1. -Add 190 µl of the mix + 10 µl of the Standard Buffer2 in Tube2.
-For the sample, put 199 µl of the mix and then add 1 µl of the sample into a Qubit 2.0 Eppendorf.
-Proceed to reading the samples.
The Qubit 2.0 is very sensitive, results only include double stranded DNA. 1.2. Nanodrop 2000 Protocol:
-Using the blank solution we standardize the machine.
-Add 1 µl of the sample and then measure. The Nanodrop provides:
-Concentration -The 280/260 Ratio.
2. DNA NGS Fragmentation Protocol:
2.1. Step one: Quality Control
The library preparation protocol requires 10 ng to 200 ng input gDNA, starting with a DNA sample volume of 7 μl for enzymatic DNA fragmentation.
DNA input amounts or quantification methods may require adjustment for some FFPE samples, as detailed below. For optimal sequencing results, use the maximum amount of input DNA available within the recommended range.
a. Preparation of High-Quality gDNA from fresh biological samples:
• Prepare high-quality gDNA using a suitable purification system, such as Qiagen’s QIAamp DNA Mini Kit, following the manufacturer’s protocol.
Note: Make sure genomic DNA samples are of high quality with an OD 260/280 ratio ranging from 1.8 to 2.0.
• Use the Qubit BR dsDNA Assay Kit to determine the concentration of each gDNA sample.
Follow the manufacturer’s instructions for the instrument and assay kit.
• Place 10 ng to 200 ng of each gDNA sample in wells of a PCR plate or strip tube and dilute each sample with nuclease-free water to a final volume of 7 μl. Vortex well to mix, then spin briefly to collect the liquid. Keep the samples on ice.
b. Preparation and qualification of gDNA from FFPE samples:
• Prepare gDNA from FFPE tissue sections using Qiagen’s QIAamp DNA FFPE Tissue Kit and Qiagen’s Deparaffinization Solution, following the manufacturer’s protocol. Elute the final gDNA samples from the MinElute column in two rounds, using 30 μl Buffer ATE in each round, for a final elution volume of approximately 60 μl.
Note: If tissue lysis appears incomplete after one hour of digestion with Proteinase K, add an additional 10 μl of Proteinase K and continue incubating at 56°C, with periodic mixing, for up to three hours.
Store the gDNA samples on ice for same-day library preparation, or at –20°C for later processing.
• Assess the quality (DNA integrity) for each FFPE DNA sample using the Agilent NGS FFPE QC Kit.
➢ Use the Qubit BR dsDNA Assay Kit to determine the concentration of each gDNA sample. Follow the manufacturer’s instructions for the instrument and assay kit.
➢ Remove a 1 μl aliquot of the FFPE gDNA sample for analysis using the Agilent NGS FFPE QC Kit to determine the ΔΔCq DNA integrity score. See the kit user manual at www.genomics.agilent.com for more information.
➢ For all samples with ΔΔCq DNA integrity score ≤1, use the Qubit-based gDNA concentration determined in step a, above, to determine the amount of the sample needed for the protocol.
➢ For all samples with ΔΔCq DNA integrity score >1, use the qPCR-based concentration of amplifiable gDNA, reported by the Agilent NGS FFPE QC Kit results, to determine the amount of the sample needed for the protocol.
2.2. Enzymatically fragment the DNA:
-Before beginning the protocol, thaw the vial of 5X SureSelect Fragmentation Buffer, vortex, then place on ice.
-Pre-program a SureCycler 8800 thermal cycler (with the heated lid ON) using the program in Table 5. Start the program, then immediately press the Pause button, allowing the heated lid to reach temperature while you set up the reactions.
-Prepare the appropriate volume of Fragmentation master mix by combining the reagents. Mix well by pipetting up and down 20 times. Spin briefly to remove any bubbles and keep on ice.
-Add 3 μl of the Fragmentation master mix to each sample well containing 7 μl of input DNA. -Mix well by pipetting up and down 20 times. Cap the wells, then briefly spin the samples. -Immediately place the plate or strip tube in the SureCycler 8800 thermal cycler. Press the Play button to resume the thermal cycling program.
-When the program reaches the 4°C Hold step, remove the samples from the thermal cycler, add 40 μl of nuclease-free water to each sample, and place the samples on ice.
The 50-μl reactions are now ready for NGS sequencing library preparation, beginning with end repair/dA-tailing. Proceed directly to Step 3. Repair and dA-Tail the DNA Ends in the SureSelectXT HS system manual or SureSelectXT Low Input system manual.
Note: This is not a stopping point in the workflow, and analysis of the enzymatically-fragmented samples is not required before they are used for library preparation. Proceed directly to end-repair and dA-tailing using the appropriate user manual link above.
V. Hybridization Capture Method:
1. Sample Preparation:
a. Prepare and Analyse the Quality of Genomic DNA Samples: b. Shear the DNA:
In this step, the 50- μl gDNA samples are sheared using conditions optimized for either high- quality or FFPE DNA. The target DNA fragment size is 150 to 200 bp.
• Set up the Covaris E220 instrument.
-Check that the water in the Covaris tank is filled with fresh deionized water to the appropriate fill line level according to the manufacturer’s recommendations for the specific instrument model and sample tube or plate in use.
-Check that the water covers the visible glass part of the tube.
-On the instrument control panel, push the Degas button. Degas the instrument for least 30 minutes before use, or according to the manufacturer’s recommendations.
-Set the chiller temperature to between 2°C to 5°C to ensure that the temperature reading in the water bath displays 5°C.
-Optional. Supplement the circulated water chiller with ethylene glycol to 20% volume to prevent freezing.
• Complete the DNA shearing steps below for each of the gDNA samples:
Each high-quality DNA sample or FFPE DNA sample should contain 10–200 ng gDNA (adjusted as required for DNA integrity) in 50 μl of 1X Low TE Buffer.
-Transfer the 50-μl DNA sample into a Covaris microTUBE, using a tapered pipette tip to slowly transfer the sample through the pre-split septa of the cap.
-Spin the microTUBE for 30 seconds to collect the liquid and to remove any bubbles from the bottom of the tube.
-Secure the microTUBE in the tube holder and shear the DNA with the settings in Table 9. Use the steps below for two-round shearing of high-quality DNA samples only:
o Shear for 120 seconds
o Spin the microTUBE for 10 seconds
o Vortex the microTUBE at high speed for 5 seconds o Spin the microTUBE for 10 seconds
o Shear for additional 120 seconds o Spin the microTUBE for 10 seconds
o Vortex the microTUBE at high speed for 5 seconds
• After completing the shearing step(s), put the Covaris microTUBE back into the loading and unloading station.
• While keeping the snap-cap on, insert a pipette tip through the pre-split septa, then slowly remove the sheared DNA.
• Transfer the sheared DNA sample (approximately 50 μl) to a 96-well plate or strip tube sample well. Keep the samples on ice.
• After transferring the DNA sample, spin the microTUBE briefly to collect any residual sample volume. Transfer any additional collected liquid to the sample well used in step f.
c. Repair and dA-Tail the DNA ends:
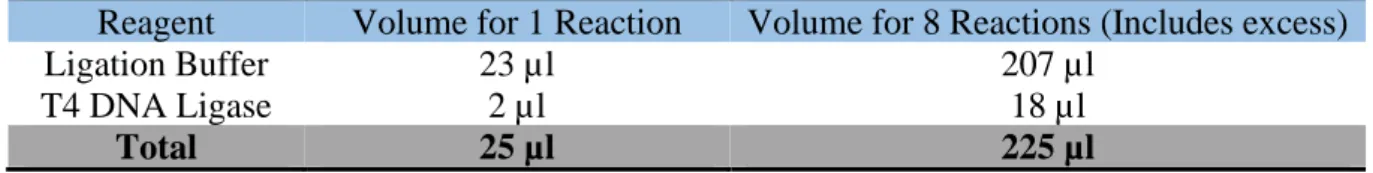
Before starting the end-repair protocol, prepare the Ligation master mix to allow equilibration to room temperature before use.
-Vortex the thawed vial of Ligation Buffer for 15 seconds at high speed to ensure homogeneity. -Prepare the appropriate volume of Ligation master mix by combining the reagents in Table XX .
Table 2 Preparation of Ligation master mix
Reagent Volume for 1 Reaction Volume for 8 Reactions (Includes excess)
Ligation Buffer 23 µl 207 µl
T4 DNA Ligase 2 µl 18 µl
Total 25 µl 225 µl
- Slowly pipette the Ligation Buffer into a 1.5-ml Eppendorf tube, ensuring that the full volume is dispensed. Slowly add the T4 DNA Ligase, rinsing the enzyme tip with buffer solution after addition. Mix well by slowly pipetting up and down 15–20 times. Spin briefly to collect the liquid.
Keep at room temperature for 30–45 minutes before use.
Pre-program a SureCycler 8800 thermal cycler (with the heated lid ON) for the End Repair and dA-Tailing steps with the program in table 12. Start the program, then immediately press the Pause button, allowing the heated lid to reach temperature while you set up the reactions.
Table 3 Thermal cycler program for End Repair/dA-Tailing*
Step Temperature Time
Step 1 20 °C 15 minutes
Step 2 72 °C 15 minutes
Step 3 4 °C Hold
* When setting up the thermal cycling program, use a reaction volume setting of 70 µl.
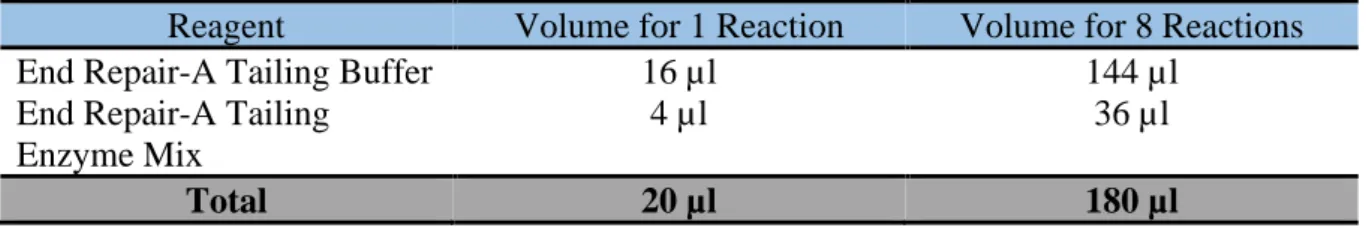
-Vortex the thawed vial of End Repair-A Tailing Buffer for 15 seconds at high speed to ensure homogeneity. Visually inspect the solution; if any solids are observed, continue vortexing until all solids are dissolved.
-Prepare the appropriate volume of End Repair/dA-Tailing master mix, by combining the reagents in Table 13.
-Slowly pipette the End Repair-A Tailing Buffer into a 1.5-ml Eppendorf tube, ensuring that the full volume is dispensed. Slowly add the End Repair-A Tailing Enzyme Mix, rinsing the enzyme tip with buffer solution after addition. Mix well by pipetting up and down 15–20 times. Spin briefly to collect the liquid and keep on ice.
Table 4 Preparation of End Repair/dA-Tailing master mix
Reagent Volume for 1 Reaction Volume for 8 Reactions End Repair-A Tailing Buffer 16 µl 144 µl
End Repair-A Tailing Enzyme Mix
4 µl 36 µl
Total 20 µl 180 µl
-Add 20 μl of the End Repair/dA-Tailing master mix to each sample well containing approximately 50 μl sheared DNA. Mix by pipetting up and down 15–20 times using a pipette set to 60 μl.
-Briefly spin the samples, then immediately place the plate or strip tube in the SureCycler 8800 thermal cycler. Press the Play button to resume the thermal cycling program.
d. Ligate The Molecular-Barcode Adaptor:
• Once the thermal cycler reaches the 4°C Hold step, transfer the samples to ice while setting up this step.
• Pre-program a SureCycler 8800 thermal cycler (with the heated lid ON) for the Ligation step with the program in Table 14. Start the program, then immediately press the Pause button, allowing the heated lid to reach temperature while you set up the reactions.
Table 5 Thermal cycler program for Ligation*
Step Temperature Time
Step 1 20 °C 15 minutes
Step 2 4 °C Hold
*When setting up the thermal cycling program, use a reaction volume setting of 100 µl.
• To each end-repaired/dA-tailed DNA sample (approximately 70 μl), add 25 μl of the Ligation master mix that was prepared on page 27 and kept at room temperature. Mix by pipetting up and down at least 10 times using a pipette set to 85 μl, then briefly spin the samples.
• Add 5 μl of Adaptor Oligo Mix (white capped tube) to each sample. Mix by pipetting up and down 15–20 times using a pipette set to 85 μl.
Note: Make sure to add the Ligation master mix and the Adaptor Oligo Mix to the samples in separate addition steps as directed in step 3 and step 4 above, mixing after each addition.
• Briefly spin the samples, then immediately place the plate or strip tube in the SureCycler 8800 thermal cycler. Press the Play button to resume the thermal cycling program in Table 14.
Note: A unique molecular barcode sequence is incorporated into each library DNA fragment at this step.
Stopping Point: If you do not continue to the next step, seal the sample wells and store overnight at either 4°C or –20°C.
e. Purify The Samples Using AMPure XP Beads:
• Verify that the AMPure XP beads were held at room temperature for at least 30 minutes before use. Do not freeze the beads at any time.
• Prepare 400 μl of 70% ethanol per sample, plus excess, for use in step 8.
Note: The freshly-prepared 70% ethanol may be used for subsequent purification steps run on the same day. The complete Library Preparation protocol requires 0.8 ml of fresh 70% ethanol per sample.
• Mix the AMPure XP bead suspension well so that the reagent appears homogeneous and consistent in colour.
• Add 80 μl of homogeneous AMPure XP beads to each DNA sample (approximately 100 μl) in the PCR plate or strip tube. Pipette up and down 15–20 times to mix.
• Put the plate or strip tube into a magnetic separation device. Wait for the solution to clear (approximately 5 to 10 minutes).
• Keep the plate or strip tube in the magnetic stand. Carefully remove and discard the cleared solution from each well. Do not touch the beads while removing the solution. • Continue to keep the plate or strip tube in the magnetic stand while you dispense 200 μl
of freshly-prepared 70% ethanol in each sample well.
• Wait for 1 minute to allow any disturbed beads to settle, then remove the ethanol. • Repeat step 8 to step 9 once.
• Seal the wells with strip caps, then briefly spin the samples to collect the residual ethanol. Return the plate or strip tube to the magnetic stand for 30 seconds. Remove the residual ethanol with a P20 pipette.
• Dry the samples by placing the unsealed plate or strip tube on the thermal cycler, set to hold samples at 37°C, until the residual ethanol has just evaporated (typically 1–2 minutes).
Note: Do not dry the bead pellet to the point that the pellet appears cracked during any of the bead drying steps in the protocol. Elution efficiency is significantly decreased when the bead pellet is excessively dried.
• Add 35 μl nuclease-free water to each sample well.
• Seal the wells with strip caps, then mix well on a vortex mixer and briefly spin the plate or strip tube to collect the liquid.
• Incubate for 2 minutes at room temperature.
• Put the plate or strip tube in the magnetic stand and leave for approximately 5 minutes, until the solution is clear.
• Remove the cleared supernatant (approximately 34.5 μl) to a fresh PCR plate or strip tube sample well and keep on ice. You can discard the beads at this time.
Note: It may not be possible to recover the entire 34.5-μl supernatant volume at this step; transfer the maximum possible amount of supernatant for further processing. To maximize recovery, transfer the cleared supernatant to a fresh well in two rounds of pipetting, using a P20 pipette set at 17.25 μl.
f. Amplify The Adaptor-Ligated Library:
• Determine the appropriate index assignments for each sample. See Table 44 in the “Reference” chapter for sequences of the 8 bp index portion of the SureSelect XT HS Index Primers A01 through H04 used to amplify the DNA libraries in this step.
Use a different indexing primer for each sample to be sequenced in the same lane. Caution: The SureSelect XT HS Index Primers are provided in single-use aliquots. To avoid cross-contamination of libraries, discard each vial after use in one library preparation reaction. Do not retain and re-use any residual volume for subsequent experiments.
• Pre-program a SureCycler 8800 thermal cycler (with the heated lid ON) with the program in Table 16. Start the program, then immediately press the Pause button, allowing the heated lid to reach temperature while you set up the reactions.
Table 6 Pre-Capture PCR Thermal Cycler Program*
Segments Number of Cycles Temperature Time
1 1 98 °C 2 minutes
2
8 to 14, based on the input DNA quality and quantity 98 °C 30 seconds 60 °C 30 seconds 72 °C 1 minutes 3 1 72 °C 5 minutes 4 1 4 °C Hold
* When setting up the thermal cycling program, use a reaction volume setting of 50 µL.
Table 7 Pre-capture PCR cycle number recommendations
Quality of Input DNA Quantity of Input DNA Cycles 100 to 200 ng 8 cycles Intact DNA from fresh samples 50 ng 9 cycles 10 ng 11 cycles 100 to 200 ng* 11 cycles
FFPE sample DNA 50 ng 12 cycles
10 ng 14 cycles
*q-PCR-determined quantity of amplifiable DNA or DIN value-adjusted amount of input DNA.
Caution: To avoid cross-contaminating libraries, set up PCR reactions (all components except the library DNA) in a dedicated clean area or PCR hood with UV sterilization and positive air flow.
• Prepare the appropriate volume of pre-capture PCR reaction mix, as described in Table 18, on ice. Mix well on a vortex mixer.