HAL Id: halshs-01630972
https://halshs.archives-ouvertes.fr/halshs-01630972
Submitted on 23 May 2018HAL is a multi-disciplinary open access archive for the deposit and dissemination of sci-entific research documents, whether they are pub-lished or not. The documents may come from teaching and research institutions in France or abroad, or from public or private research centers.
L’archive ouverte pluridisciplinaire HAL, est destinée au dépôt et à la diffusion de documents scientifiques de niveau recherche, publiés ou non, émanant des établissements d’enseignement et de recherche français ou étrangers, des laboratoires publics ou privés.
What do people ‘learn by looking’ at direct feedback on
their energy consumption? Results of a field study in
Southern France
Adnane Kendel, Nathalie Lazaric, Kevin Maréchal
To cite this version:
Adnane Kendel, Nathalie Lazaric, Kevin Maréchal. What do people ‘learn by looking’ at direct feedback on their energy consumption? Results of a field study in Southern France. Energy Policy, Elsevier, 2017, 108, pp.593-605. �10.1016/j.enpol.2017.06.020�. �halshs-01630972�
What do people ‘learn by looking’ at direct feedback on their
energy consumption? Results of a field study in Southern
France
Adnane Kendel1, Nathalie Lazaric1 and Kevin Maréchal2,3
1. Université Côte d’Azur, CNRS, GREDEG, France.
2. Centre for Economic and Social Studies on the Environment Université libre de Bruxelles - Université d’Europe, Belgium
3. Professor at Gembloux Agro-BioTech/ Université de Liège, Belgium.
Corresponding author: Nathalie Lazaric
Email: lazaric@gredeg.cnrs.fr
Université Côte d’Azur, CNRS, GREDEG, France. Abstract:
The abundant literature on consumer feedback shows that it is an efficient instrument for reducing household energy consumption. However, the reported reductions are strongly dependent on contextual factors and on the type of feedback provided. Given the importance of learning to this respect, this dimension constitutes the core focus of the present study which reports the findings of the TICELEC (i.e. French acronym for information technologies for responsible electricity consumption) project in France. The experiment included a control group (G1: the self-monitoring group) and one equipped group (G2). All participants reduced their consumption and learnt either directly from feedback or indirectly through self-monitoring. The amount of energy savings, which is larger than in similar experiments, can be explained by two factors. First, the specificity of our sample (i.e. high income, high consumption) which allows for potentially large energy savings. Second, high involvement of participants and the building of trust. The quantitative and qualitative dimensions of learning are then discussed. Additionally, we focus on peak-load shifting in G2 with 2 subgroups (G21 and G22). The higher proportion of shifters in G22 and the higher ‘quality’ of their shifting suggest a higher level of learning enabled by the more sophisticated feedback. Although this translated into only a moderately higher rate of energy savings, the higher degree of absorbed knowledge (i.e. through ‘learning by looking through connecting’) might lead to a qualitatively distinctive type of energy saving.
JEL codes:
D10; D11. D12; D13; D14; D83; Q 41.Keywords:
1. Introduction
At times, everyone needs feedback on their actions and especially in the context of requests for a change in behaviour. Feedback is especially important if what needs to be changed is invisible or as Burgess and Nye (2008) put it ‘doubly invisible’. This is the issue confronting policy-makers faced by the need to reduce households' consumption of energy (see Maréchal, 2010). Energy (and especially electricity) is produced in remote locations and enters the home through hidden wiring systems. Its 'invisibility' is reinforced by the often-inconvenient positioning of energy meters and the time lag between consumption and payment governing traditional billing systems. Household energy is not a type of commodity that is bought and then stored for later use; it is invisible to most of its consumers, which is why smart metering technologies are being promoted in order to ‘make energy visible’ (Hargreaves et al., 2013) to consumers and encourage them to reflect on (and hopefully reduce) the amount consumed. These efforts have given rise to a large literature on consumer feedback to reduce household energy consumption (see the many references contained in review analyses such as Darby, 2006; Martiskainen, 2007; Steg, 2008; Fischer, 2008; Caroll et al., 2009; EPRI, 2009; Erhardt-Martinez et al., 2010 and, for more recent studies, see Vassileva et al., 2012; Buchanan et al., 2015; Frederik et al., 2015; among others).
In a context of bounded rationality - where humans make decisions based on cognitive heuristics, such as mental shortcuts, rather than decision calculus (Pasche, 2014) - the challenge is not which information should be displayed, but rather 'how it should be displayed and where the display device should be situated to encourage the greatest change in behavior' (Martiskainen and Coburn, 2011: 216). As Darby (2010) notes, the effectiveness of feedback as a source of learning is very dependent on the context and the nature of this feedback.
Given the importance of learning to this respect, this dimension constitutes the core focus of the present study, which reports the findings of the TICELEC (i.e. French acronym for information technologies for responsible electricity consumption) project in Southern France. The project mainly consists of an experiment implemented in Biot (nearby Nice) with the aim of testing a feedback mechanism and assessing its impact in terms of energy savings. The choice of this small and wealthy town is driven by its renowned dynamism with respect to environmental
policies and the inclination of its inhabitants towards the adoption of new technologies. The project, which was launched on 1 April 2011 and closed on 24 May 2013, unfolded in four phases. The first phase involved the recruitment of households, the organisation of meetings with the participants, and their assignment to different groups. The second phase was the installation of the energy-monitoring devices. The third period was the collection of consumption data of participants. Finally, the last stage consisted in analysing the data. The experiment, which includes a control group (G1: the self-monitoring group) and an equipped group (Group 2), serves to explore how consumers are able to learn through providing some quantitative and qualitative insights as to how feedback is used by participants. The questions of interest are, for instance: what have they learnt? In which kind of context and through which process does this learning occur? Which kind of feedback may be more suitable for triggering learning? Since learning is claimed to be the rationale behind the promotion of feedback mechanisms, we connect this dimension with a discussion of peak-load shifting, not to compare it with energy savings, but taking it as the key to generating effective energy savings. We agree with Erhardt-Martinez et al., (2010) that programmes focused on peak-load shifting tend to generate lower energy savings. However, our results suggest that the ability to shift is crucial for understanding the variability in the savings induced in an experiment focused on energy reduction. Beyond its focus on the learning process, our study also intends to fill the gap with respect to the low number of empirical findings in this field collected in France (one exception being Bertoldo et al., 2015 on the qualitative dimension of smart display diffusion).
The rest of the paper is organized as follows. In Section 2 we provide some background to our approach of feedback and a comprehensive description of our experiment. Section 3 presents the design of the field experiment as well as the statistical model that is used to capture the effect of feedback on electricity consumption. The results are presented in section 4. They are then further discussed in section 5 with a specific focus on what consumers have learnt, both directly via feedback and indirectly by being involved in the experiment. Section 6 concludes the paper.
1. Background
Authoritative reviews on feedback (Darby, 2006; Fischer, 2008; Ehrhardt-Martinez et al., 2010) show that different types of feedback tend to produce different results, and the effect of feedback on performance is highly variable. More specifically, based on the definition in Darby (2006: 8), it seems that real-time ‘learning by looking’ is more efficient than ex-post ‘learning by reading and reflection’. For instance, Erhardt-Martinez et al., (2010) suggest that the immediacy of direct feedback can induce annual savings of between 9.2% and 12%, whereas indirect feedback leads only to savings ranging from 3.8% to 8.4%.
Frequency also seems to be important for efficient feedback. However, this dimension is tied closely to the medium used to provide the feedback. If indirect feedback is implemented through bills (regular or enhanced, daily or annual, general or user-specific, etc.), direct (i.e. real-time) feedback requires the use of some sort of smart device such as a meter, a display, a computer, a television, a phone, etc. ‘Direct feedback through device’ is more effective for making energy visible than ‘indirect feedback through bills’ (see also Darby, 2010; Ofgem, 2011). The more disaggregated the data (i.e. down to the appliance level), the more efficient the direct feedback for generating energy savings (Ehrhardt-Martinez et al., 2010). Thus, the key seems to be the provision of useful information in an appropriate manner in order to induce some form of learning. Given that ‘in an appropriate manner’ would seem to indicate ‘in real time’, designers are proposing displays that provide effective feedback on use. These smart displays, which can be defined as 'a collection of objects arranged for public viewing', could trigger learning since they activate peripheral perception capabilities and, notably, situational awareness of humans in a context of scare and rare attention (Börner et al., 2013: 426).
Acknowledging the various forms that feedback mechanisms can take, the literature stresses that some principles would have to be followed to increase their impacts (Darby, 2006; Wood and Newborough, 2007; Fischer, 2008; Schleich, 2013). However, a detailed analysis of important review studies (Darby, 2006; Martiskainen, 2007; Steg, 2008; Fischer, 2008; Caroll et al., 2009; EPRI, 2009; Erhardt-Martinez et al., 2010; Ofgem, 2011) shows that it might not be so evident to draw clear-cut conclusions regarding the efficiency of different feedback mechanisms. This is
due mostly to the diversity of the methodologies employed, which makes comparison difficult: sample sizes vary, not all analyses include a control group1, the time periods covered are different, etc. (see also the discussion in
Faruqui et al., 2010). For instance, Erhardt-Martinez et al., (2010) show that shorter studies show higher mean savings than longer ones. Somewhat more fundamental is the fact that the type of feedback implemented is not always clearly defined and, quite often, is coupled with other interventions (e.g. rewards, personal advice, commitment strategies, etc.). This renders post-hoc assessment regarding the specific contribution of feedback rather difficult.
The study recruitment process also has an impact on results as a correlation can be seen between the type of study programme and the type of feedback. ‘Opt-out’ programmes (i.e. in which the default is automatic enrolment) show higher participation rates and are more typical of indirect feedback such as enhanced billing or web-based audits. ‘Opt-in’ programmes (i.e. in which the default is non-participation and thus enrolling is voluntary) tend to attract fewer participants and are more widespread in display-type feedback trials (see also Erhardt-Martinez et al., 2010).
All these elements add to the variability due to contextual factors (climate, energy infrastructure, geography, culture, etc.) and socioeconomic characteristics (age, income, electricity consumption levels) which have been documented in review studies (Fischer, 2008; Caroll et al., 2009; EPRI, 2009; Erhardt-Martinez et al., 2010).
Overall, it is difficult to draw any general conclusions beyond the aforementioned insight that the amount of savings tends to increase with the frequency and precision of the information that is fed back to consumers. The effectiveness of the ‘ideal’ media-frequency pairing could also be increased by carefully designing the content and format (i.e. how the information is presented) so as to strengthen what Caroll et al., (2009:10) refers to as the ‘appeal’ of feedback.
Echoing this idea of providing feedback in an appealing manner, it seems obvious that what constitutes an efficient feedback will vary with the characteristics of the households2. Consumer preferences do matter (see Vassileva et
al., 2012). Although there is a consensus that there is no ‘one size fits all’ feedback solution (Hargreaves et al., 2010; He et al., 2010), and that feedback should be tailored (Abrahamse et al., 2007; Ek and Söderholm 2010, Lopes et al., 2012; Vassileva et al., 2012), there is no conclusive information on consumer preferences with respect to the design of the interface through which the feedback is provided3.Even less clear is how feedback is appropriated
and integrated into consumers' lives4.Interestingly, Krishnamurti et al., (2013) show that satisfying the preferences
of consumers regarding the type of information they want to receive (i.e. expressed in dollar units) is not equivalent to providing them with information (i.e. expressed in kWh units) which seems the most effective to encourage learning and generate energy savings. Thus, providing feedback in its preferred form is not equivalent to providing efficient feedback.
Based on these elements, it has been decided, within our experiment, to opt for a real-time and device-based feedback provided in a computerised and interactive fashion through the launch of an opt-in program while devoting sufficient attention to coming with a feedback that is provided in a user-friendly and appealing way. The intentions of the experiment were also actively emphasised with a clear communication to inhabitants that the TICELEC project was driven by scientific purpose and non-commercial aims. We also tested the breaking of consumption down to appliance-specific information in a variant to capture its potential added value in terms of generating energy savings. This led to the following design for the experiment: volunteers were recruited and assigned to two groups. Group 1 is the control group in which participants did not receive an equipment. Participants assigned to Group 2 did receive the energy-monitoring device (EMD). In addition to this first-stage assignment, we introduced a distinction in the nature of the equipment provided to participants in group 2. In the
2 This echoes the findings of previous studies that underline the fact that information has to be more personalized (Desmedt et
al., 2009) and household-centred (Parnell and Popovic Larsen, 2005) to be effective.
3 There are some interesting studies on users’ preferences such as Karjalainen (2010) and Bonino et al., (2012). The latter shows, for
instance, that color-based feedback is appreciated. However, the results are general (not segmented) and taken from a prospective questionnaire. The surveyed individuals did not possess the in-house display they were asked about; thus, the efficiency of the preferred options is not dealt with.
first subgroup (G21), households get feedback through accessing a web portal where general information on their energy consumption is displayed. Participants assigned to the second subgroup (G22) can obtain the same kind of feedback but also have access to a more detailed form of feedback through sensors that can be used to get additional information on energy consumption at the appliance level. The project was overseen by academics from the University of Nice Sophia Antipolis and involved three other main actors: a start-up called Ubinode, the municipality of Biot, and the OFCE (the French Economic Observatory). The division of labour was as follows. The academics and the OFCE were responsible for designing the experiment and informing households about potential energy savings. The municipality of Biot was responsible for the communication with and recruitment of participants. Ubinode provided the energy-monitoring devices (hereafter EMD).
2. Design of the field experiment 3.1. Recruitment and assignment to groups
The recruitment phase ran from 2 April to 30 September 2011. The municipality's commitment was important, and the information disseminated through press releases and flyers distributed to households exemplify its involvement and partnership in the project. In order to avoid inducing self-selection bias the flyers did not specify whether participating households would be able to save energy or not. Following this information phase, 172 households volunteered for the experiment and were enrolled in the TICELEC project. The timeline and main events are summarized in Figure 1 below.
Figure 1: Timeline and main events in the TICELEC project
From a methodological point of view, the sampling strategy thus rests on the recruitment of households on a voluntary basis, as it is the case in many opt-in designs (see Harrison and List 2004). Once households were told that they were part of the TICELEC project, they were randomly assigned to either of the group. The design of our experiment is inspired by the pioneer work of Battalio et al., (1979) regarding sample size and division into groups. This method, labelled the “framed field experiment” as coined by Harrison and List (2004), underlines that
volunteer-based experiments do not preclude that participants be randomly assigned to different groups (see also Gandhi et al., 2016; Karlin et al., 2015, for similar thoughts on random assignment in energy-related field experiments). It should be noted, however, that while random assignment is an important criteria in our methodological setting, we had to deal with three cases where households were not able to participate in G2 because of the type of electricity meter. We thus followed the recommendations provided by Rubin (1977) in this specific case. These participants (without digital meters) were assigned to the control group G1. The assignment to groups and the type of equipment provided are summarized in Figure 2 below.
Figure 2: Equipment provided in the two groups
3.2. Data collection
Preliminary survey
In line with the procedure in Krishnamurti et al., (2013), we administered a short survey (pre-survey) to participating households in order to identify the type of electricity meter in their accommodation, and to check the distance between the Internet connection and the meter. Collection of the questionnaires was completed by 1 October 2011. This led to the validation of a sample of 141 households, which were then assigned to one of the two groups.
Main Survey
On 1 January 2012, the main survey was administered. This included more specific questions on the type of housing, consumption habits, household composition, and attitudes to environmental issues and sustainable development. At the same time, the eight-month data collection period started. During this period, some households left the project either for family reasons (moving, divorce, other), lack of motivation or for technical reasons, thereby reducing the number of households to 80. During this stage, households were invited to attend a meeting held on 26 June 2012.
Ending Survey
After the data collection period, the 80 remaining households received the end-of-study questionnaire, which asked about their use of equipment, the changes that had been made to their homes or to the composition of their
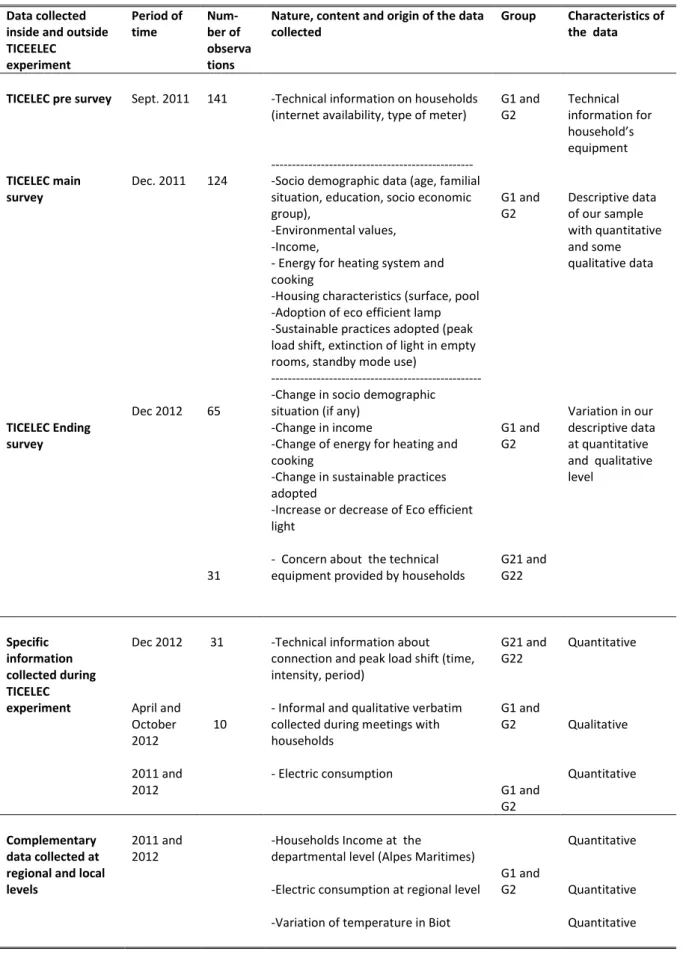
household, their level of satisfaction with the feedback received, their perception of the technology and potential changes to habits. Only 65 questionnaires were sufficiently complete and consistent to be used. Thus, the sample was reduced to 65 households. Table 1 presents the diverse sources of data we collected during the TICELEC experiment as well as the complementary data required for the present analysis such as income, temperature, and electric consumption at the regional level.
Table 1: Diverse sources of data collected during the TICELEC experiment
3.3. Control and treatment groups
Our final and (retained) sample comprises 65 households which were assigned to either the non-equipped or the equipped (i.e. control) group. The distribution is as follows:
-Group 1, the control group, includes the 35 households involved in self-monitoring with no real-time feedback, who were asked to read their meters every two months and to report their consumption;
-Group 2, the treatment group, is made of 30 households equipped with energy-monitoring devices and subdivided into two subgroups (G21 and G22). In G21 (the ‘real-time’ group), 14 households are equipped with interactive ICT which measures their consumption every two minutes. This allows them to track their electricity consumption on a 'real-time' basis or on a less frequent (but no less relevant) basis (i.e. hourly, weekly, monthly);
As explained in figure 2, the remaining 16 households are assigned to the G22 subgroup where they are provided with the same equipment as in G21 augmented with two nomad captors that can be used to provide more specific feedback on up to two appliances to be chosen by the users. This 'real-time plus' group (G22) received the most detailed information on its electricity consumption.
Our experiment thus includes both a control group (G1: the self-monitoring group) and a treatment group (G2: the equipped groups) as recommended by authors in the field of experimentation in economic analyses (Al-Ubaydli and List, 2012).
3.4. The sample and its specificity
Biot is a small municipality located nearby the city of Nice. For several decades, Biot has run projects aimed at raising ecological awareness among households, and encouraging sustainable practices such as waste reduction, and consumption of locally-produced food. Thus, the municipality could be perceived as credible and trusted by its citizens. As discussed in Gangale et al., (2013), this clearly is important since the installation of an enabling infrastructure is not always sufficient to trigger behavioural change (see also Podgornik et al., 2016). The specificity of the municipality can be illustrated by the socio-economic variables that characterize its population (e.g. high levels of income and education per capita compared to the departmental mean) (See figure 3 below for income).
Figure 3: Households level of income: our survey and the departmental level
Probably as result of this specificity, the average of household’s electricity consumption in Biot also is much higher than the regional average (respectively 21,000 and 9,253 kWh in 2011). This is of importance because of the potential effects on income elasticity of household electricity consumption (see Espey and Espey, 2004 for a discussion of these aspects). However, it does not undermine the relevance of the study since, as discussed in Gangale et al., (2013), targeting certain segments of the population might prove essential for enriching our knowledge about the impacts of feedback-based intervention.
3.4. The statistical model
To see the potential impact of the EMD, we tested the difference in energy consumption within groups at the beginning and end of the experiment. We used the OLS (Ordinary Least-Squares) regression method to analyse the changes in the dependent variable (electricity consumption expressed in kWh) associated with multiple explanatory variables that are not from the same kind (quantitative or qualitative ones), as indicated by some authors in this field (Hardy, 1993; Hutcheson, 2011). We implemented the same type of regression as suggested by Schleich et al., (2013) using the OLS regression for measuring the impact of feedback on energy consumption.
We assume that our regression analyses sufficiently control for difference in characteristics between the treatment (G1) and the control group (G2). In the literature, this assumption is called ‘conditional independence’ (see Imbes, 2004). It allows any difference between the treatment and the control group to be attributed to the feedback provided (see also Scheich et al., 2013).
In this context, the electricity consumption, as partially dependent on feedback to households, can be represented as follows:
𝑪 = 𝜷𝒊𝑿 + 𝜹𝑭𝑩𝒘+ 𝜺 (1) The dependent variable 𝑪 represents the household's electricity consumption expressed in (kWh), 𝑿 represents the row vector of variables characterizing the households (quantitative or qualitative), 𝜷 and 𝜹 are vectors of the parameters to be estimated, and 𝜺 is an error term. The variable 𝑭𝑩𝑾 describes the allocation of households to
different groups: self-monitoring or direct feedback where 𝑭𝑩𝑾=0 𝒊𝒇 self-monitoring
𝑭𝑩𝑾=𝟏 𝒊𝒇 direct feedback
Below, we present the different groups of explanatory variables included in our model characterizing the households, the dwelling, habits and others parameters that may have a significant role:
- Environmental concern: Environmental values and preferences have been discussed extensively as a potential driver of energy consumption and of potential behavioural change (Brandon and Lewis, 1999; Poortinga et al., 2003). Environmental preference and belonging to a green non-governmental association (NGA) is are captured by the variable (GREEN).
-Dwelling: Type of dwelling (house, flat, mobile home, etc.) is an important variable with respect to energy practices. For instance, Sweeney et al., (2013) discuss the existence of numerous barriers to energy-efficient behaviour including high installation costs associated with energy appliances, insufficient time spent in homes for energy-efficient investments to become profitable, split incentives when a household is renting, amount of discretionary income, etc. Here, we include living in a house (HOUSE) and being a house owner (Owner) as critical variables explaining both qualitative and quantitative changes in energy-consumption practices.
- Housing characteristics: Some characteristics influence energy practices and might explain electricity consumption (Gram-Hanssen and Bech-Danielsson, 2004; Gram-Hanssen, 2014). Following Gram-Hanssen (2014), house size is included as an explanatory variable rather than electricity consumption per square meter. We use house size (Surf) and the presence of a garden and pool (Pool/Garden) as potential variables affecting electricity consumption. - Habits: The existence of habitual practices (i.e. deeply entrenched behaviours) can explain energy consumption in the home (Maréchal and Holzemer, 2015). These embedded practices may be related to lifestyles and may be shared by certain groups (Laitner et al., 2009). Here we include simple practices such as switching off lights in empty rooms (light off), using standby mode on appliances after use (standby), and better use of the peak-load shifting (Peakloadshift) as potential markers of qualitative changes in energy habits, and of learning.
- Occupant characteristics: The number of people in the household (adults and children) is a non-neutral variable and is related to the family's everyday habits (Gram-Hanssen, 2014). Also, the generational impact of age has been shown to be important (Chancel, 2014). We include as explanatory variables in our econometric test, person type (Adult) or (Child).
- Equipment: Households' energy consumption is a socio-technical phenomenon, resulting from interactions between the consumer and the technology (Lutzenhiser, 1993; Wilhite et al., 1996). Identifying the nature of the equipment (e.g. electric space heating, water heating, space cooling, appliances, lighting, ICT, etc.) is critical for understanding energy habits. We include adoption of eco-efficient lights (efflights), presence of electric heating (ELECHEATING), and cooking by electricity (ELECOOKING).
- Socio-economic status and income: The desire to demonstrate income can promote unsustainable consumption (à la Veblen) or new ways of consuming which are ‘greener’ (Buensdorf and Cordes, 2008; Viscusi et al., 2011). It has been shown that the variable income is positively related to energy consumption. First, Martinsson et al., (2011: 23) discuss the fact that the cost of energy is less of a driving force for higher income households due to a smaller effect of economic incentives. For instance classical incentive systems, such as tariffs, may be less relevant for this group. Second, Vassileva et al., (2013) show that high income may promote a more intense reaction to feedback. Higher income households may have more opportunities to reduce their electricity consumption and may be less
subject to rebound effects. For these reasons, we select income as a potential driver of energy consumption (INCOME) along with socio-economic status (sociogroup).
- Weather: weather and temperatures are important explanatory variables that may have an impact on the amount of electricity consumed as illustrated in Torriti (2012) most notably in summertime due to the potential use of air conditioning (Kavousian et al., 2013) and in winter time when heaters are used.
We replace the variable X with the selected explanatory variables:
𝑪𝐭= 𝜷𝟎+ 𝜷𝟏𝑮𝑹𝑬𝑬𝑵 + 𝜷𝟐𝑯𝑶𝑼𝑺𝑬 + 𝜷𝟑𝑶𝑾𝑵𝑬𝑹 + 𝜷𝟒𝑺𝑼𝑹𝑭+𝜷𝟓𝑷𝒐𝒐𝒍/𝑮𝑨𝑹𝑫 + 𝜷𝟔𝑨𝑫𝑼𝑳𝑻 + 𝜷𝟕𝑪𝑯𝑰𝑳𝑫 + 𝜷𝟖𝑰𝑵𝑪𝑶𝑴𝑬 + 𝜷𝟗 𝒔𝒕𝒂𝒏𝒅𝒃𝒚 + 𝜷𝟏𝟎𝑳𝒊𝒈𝒉𝒕𝑶𝑭𝑭 + 𝜷𝟏𝟏𝑷𝒆𝒂𝒌𝒍𝒐𝒂𝒅𝒔𝒉𝒊𝒇𝒕 + 𝜷𝟏𝟐𝒆𝒇𝒇𝒍𝒊𝒈𝒉𝒕𝒔 +
𝜷𝟏𝟑𝑬𝑳𝑬𝑪𝑯𝑬𝑨𝑻𝑰𝑵𝑮 + 𝜷𝟏𝟒𝑬𝑳𝑬𝑪𝑶𝑶𝑲𝑰𝑵𝑮 + 𝜷𝟏𝟓𝑰𝑵𝑪𝑶𝑴𝑬 + 𝜷𝟏𝟔𝒔𝒐𝒄𝒊𝒐𝒈𝒓𝒐𝒖𝒑 + 𝜷𝟏𝟕𝑾𝑬𝑨𝑻𝑯𝑬𝑹 +
𝜹 𝑭𝑩𝑾 + 𝜺 (2)
𝑪𝟎 is year 2011, the period immediately prior to the experiment, and 𝑪𝟏 is the consumption recorded over the
period of the experiment (i.e. during year 2012). The difference between the two periods is denoted ∆𝑪 . We measure here if our dependent variable ∆𝑪 is linked to feedback, some explanatory variables that remain constant during the period and others variables that may have changed (peak load shift, extinction of lights, standby practice, climatic conditions). Thus we obtain:
∆𝑪 = 𝑪𝟎− 𝑪𝟏= 𝜷𝟎+ 𝜷𝟏𝑮𝑹𝑬𝑬𝑵 + 𝜷𝟐𝑯𝑶𝑼𝑺𝑬 + 𝜷𝟑𝑶𝑾𝑵𝑬𝑹 + 𝜷𝟒𝑺𝑼𝑹𝑭+𝜷𝟓𝑷𝒐𝒐𝒍/𝑮𝑨𝑹𝑫 + 𝜷𝟔𝑨𝑫𝑼𝑳𝑻 + 𝜷𝟕𝑪𝑯𝑰𝑳𝑫 + 𝜷𝟖𝑰𝑵𝑪𝑶𝑴𝑬 + 𝜷𝟗 ∆ 𝒔𝒕𝒂𝒏𝒅𝒃𝒚 + 𝜷𝟏𝟎 ∆ 𝒍𝒊𝒈𝒉𝒕𝑶𝑭𝑭 + 𝜷𝟏𝟏 ∆ 𝑷𝒆𝒂𝒌𝒍𝒐𝒂𝒅𝒔𝒉𝒊𝒇𝒕 + 𝜷𝟏𝟐 𝒆𝒇𝒇𝒍𝒊𝒈𝒉𝒕𝒔 + 𝜷𝟏𝟑𝑬𝑳𝑬𝑪𝑯𝑬𝑨𝑻𝑰𝑵𝑮 + 𝜷𝟏𝟒𝑬𝑳𝑬𝑪𝑶𝑶𝑲𝑰𝑵𝑮 + 𝜷𝟏𝟓𝑰𝑵𝑪𝑶𝑴𝑬 + 𝜷𝟏𝟔𝒔𝒐𝒄𝒊𝒐𝒈𝒓𝒐𝒖𝒑 + ∆𝜷𝟏𝟕𝑾𝑬𝑨𝑻𝑯𝑬𝑹 + 𝜹 𝑭𝑩𝑾 + 𝜺 (3) 𝒘𝒊𝒕𝒉 ∶ {𝑵𝒐 𝒑𝒐𝒘𝒆𝒓 𝒔𝒂𝒗𝒊𝒏𝒈𝒔 𝒃𝒆𝒕𝒘𝒆𝒆𝒏 𝒕𝒉𝒆 𝒕𝒘𝒐 𝒑𝒆𝒓𝒊𝒐𝒅𝒔 𝒊𝒇 ∆𝑪 < 𝟎𝑷𝒐𝒘𝒆𝒓 𝒔𝒂𝒗𝒊𝒏𝒈𝒔 𝒃𝒆𝒕𝒘𝒆𝒆𝒏 𝒕𝒉𝒆 𝒕𝒘𝒐 𝒑𝒆𝒓𝒊𝒐𝒅𝒔 𝒊𝒇 ∆𝑪 > 𝟎 4. Results 4.1. Descriptive statistics
The presentation of our descriptive data is inspired by the work of Schleich et al., (2013) where the authors provide the data for the full sample (mean, standard variation, min, max) together with mean variables for the control and
treatment groups in the same table. Table 2 (2a and 2b) summarizes our descriptive variables for the full sample and for the two groups.
Table 2: Descriptive variables
4.2. Regression results
We estimated the importance of our dependant variable (i.e. the variation of electricity consumption) as partially dependent from feedback and other groups of explanatory variables. The results of the regression analysis displayed in Table 3 tend to suggest that feedback plays a moderate role5 in decreasing electricity consumption (see
below). As discussed in the literature, feedback is not the only trigger for energy reduction. If prior findings in this field indicate that group benefiting from behavioural intervention with equipment are more prone to decrease their consumption of electricity compared to a control group (Abrahamse et al., 2007), some authors discuss the importance of goal setting. Indeed, if ‘a goal to save energy does not exist, feedback should have no effect’ (McCalley et al., 2002: 591). In our experiment, households were volunteers and most of them expressed their personal wish about potential energy savings. Feedback in this context has helped to reinforce and to support this initial motivation but was not the only trigger of this process.
Table 3: Regression results
As can be observed from the coefficients displayed in table 3, feedback is not the only variable impacting electricity consumption. Some other variables deserve attention. As it could be expected, housing characteristics, such as surface area and the presence of electric heating, are also critical and very significant. Socioeconomic status also matters as discussed by Abrahamse and Steg (2009); being an employee is a significant explanatory variable. However, belonging to a green association does not seem to be significant for triggering a change in electricity
5The coefficient is positive because in our equation if 𝜷
𝒊>0, it means that this variable positively impacts the level of
consumption via a policy intervention (for similar result see Whitmarsch, 2009). Weather appears to have no role in explaining changes in consumption6.
An important, but somewhat puzzling result from our econometric analysis is the apparent importance of peak-load shifting practices for explaining the variability in savings between 2011 and 2012. In France, peak-peak-load is a critical issue as the system is dominated by nuclear power (Denholm and Margolis, 2007: 4425). Electricity is centralized and very sensitive to the consumption peak at the beginning of the evening as energy is not stored. Some local experiences have tried to reduce this peak-load by introducing incentives with pricing strategies as described by Faruqui et al., (2010) or with automated management. However, as acknowledged by Clastres (2011: 5403), ‘the danger with automated management is that peak consumption may simply shift, reappearing when all loads reconnect at the same time’. For this reason, some authors advocate for a reframing of this issue of peak electricity demand (see notably Strengers, 2012) to understand how practices are co-constructed and can be changed. As expressed in Darby (2001), the rationale is to understand how ‘to provide technical, training and social infrastructures to make learning and change possible’ (Darby, 2001). This issue is further discussed below.
4.3. Additional data and results for G21 and G22
The size of our sample did not allow us to provide regression results for G21 and G22 and assess the potential additional impact that the more sophisticated feedback could have. However, as our focus is on learning, we gathered complementary data (e.g. electricity consumption, on peak-load shift, number of connections, etc.) for both G21 and G22. Our aim is to capture some difference between G21 and G22 that could illustrate the nature of learning and its potential effect.
All the groups studied reduced their electricity consumption very significantly between 2011 and 2012. The G1 group reduced its consumption by 13% (1,078 kWh), G21 by 22.2% (1,783 kWh), and G22 by 23.3% (1,867 kWh). In
6 Indeed as shown in appendix, the difference of temperature between 2011 and 2012 is very small (the mean temperature
is 16.72°C in 2011 and 16.41°C in 2012). Such a low mean variation of 0.31°C in the period observed may explain why this variable is not significant in our regression.
comparison, consumption in the PACA region and Alpes Maritimes decreased by 1% over the same period. Our results for the three groups are significantly higher than those found in other studies - and especially for the G1 group where we did not expect such a large reduction in consumption. This is an important result which we discuss further in Section 5. The decrease in consumption for G1, G21 and G22 is depicted in Figure 4.
Figure 4: The decrease of electricity consumption among groups
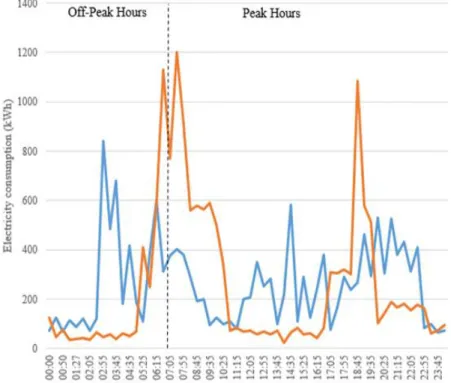
Given the importance of peak-load shift in our regression results, we explored in more depth the links between peak-load shifting and the type of feedback provided. As can be seen in Figures 5 and 6 below, there is a strong difference, on aggregate, between G21 and G22 for the practice of peak-load shifting observed in March and July. In the beginning of our experiment (i.e. in March), the figure shows that the practice of peak-load shifting was not really implemented by either of the group. However, figure 6 shows that in July (i.e. when the experiment began to have an impact) the practice of shifting consumption towards off-peak periods was more efficiently implemented by participants of G22. As discussed below, this variable is best understood as a ‘marker’ of (induced) learning (i.e. practising peak-load shifting requires some knowledge acquisition).
Figure 5: Peak-load shift in G21 and G22 in March
Figure 6 : Peak-load shift in G21 and G22 in July
It should be noted, however, that the households enrolled in our survey were not equipped with the energy-monitoring device prior to their participation. The kind of data that would allow us to do a comparative analysis of daily consumption over more than one year are therefore not available. Further discussing this aspect to strengthen our findings regarding the role of feedbacks in inducing peak-load shifting would thus require carrying out a new
study in which the consumption of households equipped with the EMD would also be observed during some period of time before the feedback is provided.
In order to explore learning from another perspective, we looked at the number of connections on the web-based platform (which was available for both types of feedback). The connection to the platform can be viewed as a maker for the desire to learn more about one’s energy consumption. As could be expected, Table 4 (see below) shows that the average number of connections is almost 20% higher in G22 than in G21 (108.68 vs 91.28).
Table 4: Number of connections on the platform from households in G21 and G22
Echoing the results displayed in figure 6, table 5 shows that peak-load shifting is more widespread in the G22 group than in the G21 group (14 out of the 16 G22 households and 9 out of 14 G21 households have adopted the practice of shifting part of their consumption to off-peak hours).
Table 5: Number of connections and peak-load shift from households in G21 and G22
5. Discussion of the results 5.1. Learning by looking
To fully understand the results generated through the experiment, it is important to mention that the overall perception of the whole project was fairly positive. Participants reported a positive experience from their participation in the TICELEC project and seemed to be really engaged. The project seems to have succeeded in building trust among participants, which overcome potential resistance to a new technical device and empowered consumers to become active energy customers (for a similar view see Gangale et al., 2013; Verbong et al., 2013).
Obviously, feedback mechanisms also played a role in inducing this positive outcome. Almost 90% of the households in the two feedback groups referred to a willingness to look at and understand the ‘structure’ of their consumption, upon being asked in the ending survey about the perception of the study and the main goals for energy saving. In other words, it seems that detailed feedback helped the individuals in the G21 and G22 groups to ‘make sense’ of their consumption (Berker, 2013), and to understand their practices and their potential actions in more depth. Previous work has emphasized that 'carefully designed feedback could enable users to readily understand the habits and routines that generate their household patterns and thus make more concrete the viable energy saving actions available to them' (Buchanan et al., 2015: 94 ). Thus, the learning process enabled through feedback equipment appears to be crucial in this quest for a better understanding of energy consumption. This could explain the importance of peak-load shifting in Table 3 since the adoption of this practice might be one symptom of a successful learning process.
In the present paper, we argue that the type of feedback provided to G22 is more effective in inducing learning7.A
G22 participant explained in a meeting that 'with your device I suddenly realized what was the problem with my consumption: my immersion heater that has both a thermostat problem and a permanent scaling state impeding the consumption to be at a normal level…without your captor I could have discovered it by myself - but for sure after a long period of time'.
Although our results confirm the greater efficiency of more sophisticated feedback (and thus the positive impact of learning on energy savings), they do not stand out and the magnitude of the impact is small when energy savings in G22 are compared to those achieved in G21 (22.2 % versus 23.3 %). The learning must be related to something
7 In line with the features discussed in Hargreaves et al., (2013), it should be noted that this was possible only because the feedback fitted
with and was adjusted to the everyday life practices of the surveyed households. In our ending survey in a part dedicated to privacy concerns, we noticed that only two individuals from the G22 group perceived the setting as intrusive and only 3 were dissatisfied with the equipment.
larger than the sole ability to move nomad captors from one appliance to another and reduce energy consumption accordingly.
To further explore this aspect, it could be interesting to combine data on a form of desire to learn with data on a form of successful learning. In other words, this means looking at the number of connections in parallel with the key variable of peak-load shifting. It must be stressed, however, that the subsequent analysis and its interpretation should be considered cautiously since it is based on comparing very small size sub-samples. Nevertheless, we consider that they provide some useful insights that are worth reporting. Combining information on peak-load shifting with activity on the web-based platform, as depicted in table 5, show that the G22 shifters have many more connections (117) than either the G21 shifters (43) or the G22 non-shifters (47). However, the highest average number of connections (176) is recorded for the G21 non-shifters. A possible interpretation of these results is that the possibility of checking the energy consumed by single appliances available in the G22 group resulted in more households in this group learning to shift to off-peak consumption. This successful shifting seems to be accompanied by a high number of connections, which suggests an active search for rationalisation, appliance by appliance. This possibility was not available to the G21 group which would have required more information in order to learn successfully about the benefits of shifting.
In sum, the higher proportion of shifters in G22 and the higher ‘quality’ of their shifting (depicted in the March-July curves) suggest a higher level of learning enabled by the more sophisticated feedback. Although this translated into only a moderately higher rate of energy savings (23.3% vs 22.2% ), the higher degree of actively acquired knowledge (i.e. through ‘learning by looking through connecting’) might lead to a qualitatively distinctive type of energy saving.
5.2. Indirect learning without direct feedback
The results of our experiment show that all participants reduced their consumption, be it through direct learning from feedback and/or indirect learning through self-monitoring. As discussed elsewhere, loss of interest among consumers is one of the main issues related to the efficiency of in-home displays (IHDs). Attention tends to diminish
over time 'given that the success of feedback depends on user engagement, this loss of interest is detrimental and may severely hamper the likelihood that IHDs will result in energy reductions that persist in the long term' (Buchanan et al., 2015: 91). In our diverse meetings with households during the experiment, we observed a larger part of G1 than G2 was present and taking part to debates. Obviously, households in G1 were trying to collect information from G2 in order to compensate the situation of non-equipment8.
Accordingly, it could be expected that the design of the TICELEC experiment would make G1 consumers frustrated and disinterested in the experiment since they did not receive any feedback equipment enabling them to learn about their energy consumption. However, the large reductions in electricity consumption within the whole sample (included in G1), suggests that all three groups were fully engaged, and their attention was maintained throughout the project. One of the reasons for this was perhaps that the team was perceived as trustworthy. As discussed elsewhere, trust and, specifically, 'integrity-based trust' is a necessary condition for (and a probable a consequence of) the experiment generating energy savings because 'If the source of a message seems untrustworthy, unfair or incompetent, people can be wary or sceptical and either disengage, or react defensively to the information' (Frederik et al., 2015: 1388).
In addition to the general positive perception of the TICELEC experiment among the participants in all three groups (as reported in our ending survey), we observed active and real engagement of users in getting a better understanding of their energy consumption practices with the aim of making better sense of it. The amount of energy savings in G1 suggests that learning can occur without feedback, through empowerment and involvement in a learning process. TICELEC was perceived as a big project which attracted and retained the attention of citizens. All participants - with or without technologies - made their best efforts during the experiment to overcome potential frustrations (as noted in relation to G1) and to sustain their initial motivation.
8 This point has been largely debated among the team. Households in G1 were very active in meetings as if they were
frustrated not having the equipment and trying others ways to learn. Their higher presence of participation (comparing to G2) fluctuates between 30% and 40% more.
This result chimes with Fischer (2008) who concludes that the most efficient feedback interventions are those that are coupled with other policies. Here, the involvement of the municipality seems to have played the role of informing and motivating participation. Participants were actively involved during meetings - and especially those in the G1 group who tried to obtain information on energy practices, and discussed it with participants from the other groups. This triggered a kind of indirect learning and allowed participants to make sense of their daily energy consumption. G1 included highly intrinsically motivated participants, who managed to reduce their consumption by 13% with no feedback. The G21 and G22 groups demonstrated both intrinsic and extrinsic motivation, and an ability to understand the detailed feedback which induced both a change of their practices and a substantial reduction in their energy consumption. Thus, as shown in figure 4, all households learnt and reduced their energy consumption, and it is most likely that groups G21 and G22 could go further in this process thanks to the visibility and knowledge obtained through the feedback equipment.
5.3. Learning to reduce conspicuous consumption
Learning is highly contextual and depends on the household’s characteristics. For instance, Vassileva et al., (2013) show that it is critical to identify households with larger savings potential because the impact of a given experiment can vary greatly according to the socio-economic profile of the group involved. Our results echo this finding since our sample is characterized by high income and high levels of electricity consumption. High income participants consume more energy, but are able to reduce their consumption due a more flexible electricity reduction elasticity curve (Espey and Espey, 2004). In other words, their overconsumption is easily regulated if there is an intention to act in this direction.
Our regression results (see table 3) suggest that the house size has a significant impact on the amount of energy savings induced by the experiment but that income on its own (compared to house size) does not seem to be a determinant. This is in line with Gram-Hanssen (2014) who highlights that housing characteristics matter because house size may be correlated with other characteristics such as age and income. Our experiment served to reveal some sources of overconsumption. Participants were made more aware of their potential wasting of energy, and
were enabled to make more sense of their practices while being free to learn by themselves and to act independently. However, as Veblen points out, conspicuous consumption is a part of society and is entwined with various values and social norms which are difficult to change. Social norms appear to be very important, and Veblen used the term ‘conspicuous consumption’ to explain how consumption is used to gain and signal social status. An important point here is that consumption integrates a potential element of waste (waste of time, effort, and of goods) (Veblen, 1899: 85). This means that individuals and groups are unaware of some conspicuous consumption behaviours because they are built into their daily lives, and are based on historical consumption and social behaviours.
Understanding this is critical for a better understanding of the tenets of household energy consumption and for an effective implementation of energy saving policies (see Maréchal and Holzemer, 2015). The results of our experiment show that choosing among segments of the population (i.e. in our case, high levels of income, education and energy consumption) may prove to be an efficient strategy since it is likely that individuals will exhibit different levels of involvement according to their personal profiles (see Fischer, 2008; Gangale et al., 2013, Vassileva et al., 2013, for a similar view).
6. Conclusion and policy implications
The results of our experiment show that all participants reduced their consumption and learnt either directly from feedback or indirectly through self-monitoring. We argue that the amount of energy savings, which is large compared to similar experiments, can be explained first, by the specificity of our sample (i.e. high income, high level of energy consumption) which allows for potentially large energy savings, and, second, by high levels of trust and involvement of participants. Alongside with other authors in the field (Vassileva et al., 2012; Podgornik et al., 2016), we think that targeting specific segments of population such as high-income (as in our experiment) or low-income households is critical. As underlined by Vassileva and Campillo (2014), if low-income household tend to display lower energy consumption profiles, they also often have a great interest in learning how to save energy and reduce
their bill. Thus, both low and high-income appears to be very interesting groups to observe as they have high potential for changing their behaviours starting from very different goals and expectations about learning. An interesting direction for future energy-efficiency programs could be to extent this experiment with diverse groups of low and high income in order to consolidate our preliminary results in this matter.
The context of the TICELEC experiment is very specific and produced different patterns of learning. In line with the abundant literature on feedback, 'learning by looking' with direct feedback has been shown in our study to be very effective (as its provision to some participants resulted in larger energy savings). However, the unexpected reduction in energy consumption by the G1 group would suggest that 'learning by looking' could well have been reinforced by indirect learning through a form of social emulation and increased motivation based on the active engagement of households in that group (which was quite visible during meetings). This result obtained in our experiment echoes prior findings in Jonsson et al., (2011) which concluded that experiments framed with non-technological drivers (i.e. with non-equipped groups) can achieve very similar results in terms of energy savings than that those obtained with equipped groups.
Therefore, the unexpected and large reductions achieved by households in the control groups would lead us to highlight the role of indirect learning (i.e. without the aid of direct feedback and technology) as a facilitating condition for future experiments. This type of learning, which is highly dependent on initial conditions and the building of trust, is difficult to replicate. It would require a more detailed investigation in order to obtain a better understanding of the effect of social dynamics in relation to energy-saving interventions that involve some degree of collectivity.
Finally, it must be remembered that learning involves an inherent qualitative dimension. Although, at first glance, the quantitative effects on electricity consumption (i.e. the difference in the reductions achieved by the G21 and G22 groups) may seem insignificant, the added-value of providing feedback at the appliance level should not be overlooked. Our study shows that the types of learning induced are qualitatively distinct, as illustrated by the curves
related to peak-load shift. Further research could assess whether this qualitatively distinct learning process leads to savings that are more persistent over time.
References
Abrahamse, W., Steg, L. Vlek, C. Rothengatter T., 2007. The effect of tailored information, goal setting, and tailored feedback on household energy use, energy-related behaviors and behavioral antecedents. Journal of Environmental Psychology 27, 265-276.
Abrahamse, W., Steg L., 2009. How do socio-demographic and psychological factors relate to households’ direct and indirect energy use and savings?. Journal of Economic Psychology 30(5), 711-720.
Al-Ubaydli, O., List, J.A., 2012. On the Generalizability of Experimental Results in Economics, NBER Working Papers 17957, National Bureau of Economic Research, Inc.
Battalio, R.C., Kagel, J.H., Winkler, R.C., Winett, R.A., 1979. Residential electricity demand: an experimental study. The Review of Economics and Statistics 61(2), 180-189.
Berker, T., 2013. “In the morning I just need a long, hot shower”: a sociological exploration of energy sensibilities in Norwegian bathrooms. Sustainability: Science, Practice, & Policy 9 (1), 57-63.
Bertoldo, R., Poumadère, M., Rodriguez, L.C., 2015. When meters start to talk: The public’s encounter smart meters in France, Energy Research and Social Science, 9, 146-156.
Bonino, D., Corno, F., De Russis, L., 2012. Home energy consumption feedback: a user survey. Energy and Buildings 47, 383-393.
Börner, D., Kalz, M., Specht, M., 2013. Beyond the channel: A literature review on ambient displays for learning. Computers & Education 60, 426-435.
Brandon, G., Lewis, A., 1999. Reducing household energy consumption: A qualitative and quantitative field study. Journal of Environmental Psychology 19 (1), 75-85.
Buensdorf, G., Cordes, C., 2008. Can sustainable consumption be learned? A model of cultural evolution. Ecological Economics 67 (4), 646-657.
Buchanan, K., Russo, R., Anderson, B., 2015. The question of energy reduction: The problem(s) with feedback. Energy Policy 77, 89-96.
Burgess, J., Nye, M., 2008. Rematerialising energy use through transparent monitoring systems. Energy Policy 36, 4454-4459.
Carroll, E., Hatton, E., Brown, M., 2009. Residential energy use behavior change pilot, Research study No. CMFS project code B21383, USA: Franklin Energy.
Chancel, L., 2014. Are younger generations higher carbon emitters than their elders? Inequalities, generations and CO2 emissions in France and in the USA. Ecological Economics 100, 195-207.
Clastres, C., 2011. Smart grids: another step towards competition, energy security and climate change objectives, Energy Policy 39, 5399-5408.
Darby, S., 2001. Making it Obvious: Designing Feedback into Energy Consumption. In: Second International Conference on Energy Efficiency in Household Appliances and Lighting. Italian Association of Energy Economists/ EC-SAVE programme, pp. 685-696.
Darby, S., 2006. The effectiveness of feedback on energy consumption, A review for DEFRA of the literature on metering, billing and direct displays. UK: Environmental Change Institute, University of Oxford. http://www.eci.ox.ac.uk/research/energy/downloads/smart-metering-report.pdf
Darby, S., 2010. Literature review for the Energy Demand Research Project. UK: Environmental Change Institute, University of Oxford. https://www.ofgem.gov.uk/ofgem-publications/59113/sd-ofgem-literature-review-final-081210.pdf (accessed September 14, 2015).
Denholm, P., Margolis, R.M., 2007. Evaluating the limits of solar photovoltaics (PV) in electric power systems utilizing energy storage and other enabling technologies. Energy Policy 35 (5), 4424-4433.
Desmedt, J., Vekemans, G., Maes, D., 2009. Ensuring effectiveness of information to influence household behaviour. Journal of Cleaner Production 17, 455-462.
Ehrhardt-Martinez, K., Donnelly, K. A., Laitner, J. A., 2010. Advanced metering initiatives and residential feedback programs: a meta-review for household electricity-saving opportunities (No. E105). USA: American Council for an Energy-Efficient Economy (ACEEE).
Espey, J., Espey, M., 2004.Turning on the lights: a meta-analysis of residential electricity demand elasticities. Journal of Agricultural and Applied Economics 36 (1), 65-81.
Ek, K., Söderholm, P., 2010. The devil is in the details: Household electricity saving behavior and the role of information. Energy Policy 38 (3), 1578-1587.
EPRI, 2009. Residential electricity use feedback: a research synthesis and economic framework, Electric Power Research Institute, Final report No. 1016844.
Faruqui, A., Sergici, S., Sharif A., 2010. The impact of informational feedback on energy consumption- A survey of the experimental evidence. Energy 35 (4), 1598-1608.
Frederiks, E.R., Stenner, K., Hobman E.V., 2015. Household energy use: Applying behavioural economics to understand consumer decision-making and behaviour. Renewable and Sustainable Energy Reviews 41, 1385-1394. Fischer, C., 2008. Feedback on household electricity consumption: a tool for saving energy?. Energy Efficiency 1(1), 79-104.
Gandhi, R., Knittel, C. R., Pedro, P., Wolfram C., 2016. Running randomized field experiments for energy efficiency programs: a practitioner’s guide, draft.
Gangale, F., Mengolini, A., Oneyyi, I., 2013. Consumer engagement: an insight from smart grid projects in Europe. Energy Policy 60, 621-628.
Gram-Hanssen, K., Bech-Danielsen, C., 2004. House, home and identity from a consumption perspective. Housing, Theory and Society 21, 17-26.
Gram-Hanssen, K., 2014. Existing buildings - Users, renovations and energy policy. Renewable Energy 61, January, 136-140.
Hardy, M., 1993. Regression with dummy variables, Sage University Paper Series on Quantitative Applications in the Social Sciences, 07-093, Newbury Park, CA : Sage.
Hargreaves, T., Nye, M., Burgess, J., 2010. Making energy visible: A qualitative field study of how householders interact with feedback from smart energy monitors. Energy Policy 38 (10), 6111- 6119.
Hargreaves, T., Nye, M., Burgess, J., 2013. Keeping energy visible? Exploring how householders interact with feedback from smart energy monitors in the longer term. Energy Policy 52, 126-134.
Harrison, G.W., List, J.A., 2004. Field Experiments. Journal of Economic Literature 42 (4), 1009-1055.
He, H. A., Greenberg, S., Huang, E. M., 2010. One size does not fit all: applying the transtheoretical model to energy feedback technology design. In: Proceedings of the 28th international conference on Human factors in computing systems - Presented at the Human factors in computing systems, Atlanta, Georgia, USA, , 927-936.
Houde, S., Todd, A., Sudarshan, A., Flora, J. A., Armel, K.C., 2013. Real Time Feedback and electricity consumption: a field experiment assessing the potential for savings and persistence. The Energy Journal 34 (1), 87-102.
Hutcheson, G.D., 2011. Ordinary Least-Squares Regression. In Moutinho, L., and Hutcheson, G.D., The SAGE dictionary of quantitative management Research,224-228.
Imbens, G.W., 2004. Non parametric estimation of treatment effects under exogeneity: a review. Review of Economics and Statistics 86, 4-29.
Jonsson, D.K., Gustafsson, S., Wangel, J., Höjer, M., Lundqvist, P., Svane, O., 2011. Energy at your service: highlighting energy usage systems in the context of energy efficiency analysis. Energy Efficiency 4, (3), 355-369. Karjalainen, S., 2010. Consumer preferences for feedback on household electricity consumption. Energy and Buildings 43(2-3), 458-467.
Karlin, B., Zinger, J.F., Ford, R., 2015. The effects of feedback on energy conservation: a meta-analysis. Psychological Bulletin 141 (6), 1205-1227.
Kavousian, A., Rajagopal, R., Fischer, M., 2013. Determinants of residential electricity consumption: Using smart meter data to examine the effect of climate, building characteristics, appliance stock, and occupants' behavior Energy 55, 184-194.
Krishnamurti, T., Davis, A., Wong-Parodi, G., Wang, J., Casey Canfield C., 2013. Creating an in-home display: Experimental evidence and guidelines for design. Applied Energy 108, 448-458.
Laitner, J. A., Ehrhardt-Martinez, K., McKinney, V., 2009. Examining the Scale of the Behaviour Energy Efficiency Continuum. In ECEEE 2009 Summer Study: Act! Innovate! Deliver! Reducing Energy Demand Sustainably. La Colle sur Loup, France: European Council for an Energy-Efficient Economy.
Lopes, M., Antunes, C., Martins, N., 2012. Energy behaviours as promoters of energy efficiency: a 21st century review. Renewable and Sustainable Energy Reviews 16, 4095-4104.
Lutzenhiser, L., 1993. Social and Behavioural Aspects of Energy Use. Annual Review of Energy and Environment 18, 247-289.
Maréchal, K., 2010. Not irrational but habitual: The importance of “behavioural lock-in” in energy consumption. Ecological Economics, 69 (5), 1104-1114.
Maréchal, K., Holzemer, L., 2015. Getting a (sustainable) grip on energy consumption: the importance of household dynamics and ‘habitual practices’. Energy Research and Social Science, 10, 228-239.
Martiskainen, M., 2007. Affecting consumer behaviour on energy demand, Final report to EdF Energy, UK: Sussex Energy Group - SPRU - Science and Technology Policy Research.
Martiskainen, M., Coburn, J., 2011. The role of information and communication technologies (ICTs) in household energy consumption-prospects for the UK. Energy Efficiency 4 (2), 209-221.
Martinsson, J., Lundqvist, L.J, Sundström, A., 2011. Energy saving in Swedish households. The (relative) importance of environmental attitudes. Energy Policy 39, 5182-5191.
McCalley, L. T., Cees, J., Midden, H., 2002. Energy conservation through product-integrated feedback: The roles of goal setting and orientation. Journal of Economic Psychology 23, 589-603.
Ofgem, DECC, 2011. Energy Demand Research Project- Final Analysis, June 23rd. https://www.ofgem.gov.uk/ofgem-publications/59105/energy-demand-research-project-final analysis.pdf Parnell, R., Popovic Larsen, O., 2005. Informing the Development of Domestic Energy Efficiency Initiatives: An Everyday Householder-Centered Framework. Environment and Behavior 37, 787-807.
Pasche, M., 2014. Soft Paternalism and Nudging - Critique of the Behavioral Foundations., MRPA Working papers Jena, Germany.
Podgornik, A., Sucic, B., Blazic, B., 2016. Effects of customized consumption feedback on energy efficient behaviour in low-income households. Journal of Cleaner Production 130, 25-34.
Poortinga, W., Steg, L., Vlek, C., Wiersma, G., 2003. Household preferences for energy -saving measures: a conjoint analysis. Journal of Economic Psychology 24, 49-64.
Rubin, D.B., 1977. Assignment to treatment group on the basis of a covariate. Journal of Educational Statistics, 2, 1-26.
Schleich, J., Klobasa, M., Gölz, S., Brunner, M., 2013. Effects of feedback on residential electricity demand - Findings from a field trial in Austria. Energy Policy 61, 1097-1106.
Steg, L., 2008. Promoting household energy conservation. Energy Policy, 36(12), 4449-4453.
Strengers, Y., 2012. Peak electricity demand and social practice theories: Reframing the role of change agents in the energy sector. Energy policy 44, 226-234.
Sweeney, J., Kresling, J., Webb, D., Soutar, G.N., Mazzarol, T., 2013. Energy saving behaviours: Development of a practice-based model. Energy Policy 61, 371-381.
Torriti, J., Hassan, M. G., Leach, M, 2010. Demand response experience in Europe/policies programmes and implementation. Energy 35, 1575-1583.
Torriti, J., 2012. Price-based demand side management: Assessing the impacts of time-of-use tariffs on residential electricity demand and peak shifting in Northern Italy. Energy, 44 (1), 576-583.
Vassileva, I., Odlare, M., Wallin, F., Dahlquist, E., 2012. The impact of consumers' feedback preferences on domestic electricity consumption. Applied Energy 93, 575-582.
Vassileva, I., Dahlquist, E., Wallin, F., Campillo, J., 2013. Energy consumption feedback devices’ impact evaluation on domestic energy use. Applied Energy 106, 314-320.
Vassileva, I., Campillo, J., 2014. Increasing energy efficiency in low-income households through targeting awareness and behavioral change. Renewable Energy 67, 59-63.
Veblen, T., 1994 [1899]. The Theory of Leisure Class. In The Collected Works of Thorstein Veblen (Vol. 1). Routledge, London.
Verbong, G., Beemsterboer, S., Sengers, F., 2013. Smart Grids or Smart Users? Involving users in developing a low carbon electricity economy. Energy Policy (52), 117-125.
Viscusi, W.K., Huber, J., Bell, J., 2011. Promoting recycling: Private values, social norms, and economic incentives. The American Economic Review 103 (1), 65-70.
Wilhite, H, Nakagami, H., Masuda, T., Yamaga Y., Haneda H., 1996. A cross-cultural analysis of household energy use behaviour in Japan and Norway. Energy Policy 24(9), 795-803.
Whitmarsh, L., 2009. Behavioural responses to climate change: Asymmetry of intentions and impacts. Journal of Environmental Psychology 29, 13-23.
Wood, G., Newborough, M., 2007. Influencing user behaviour with energy information display systems for intelligent homes. International Journal of Energy Research 31, 56-78.
Figure 2: The various equipment provided to participating households
G1 - Self
Monitoring
G2 – Direct Feedback
G1 - Self
Monitoring
G21 –
Real Time
Feedback
G22 –
Real Time
Plus
Feedback
1. General
Counter Sensor
2. ZigBee
Coordinator
3. Communication
Gateways
4. Nomad captors
5. Web Feedback
Figure 3: Households level of income: our survey and the departmental level
* Our survey (n=65)
** Households in the department of Alpes Maritimes from the Ministry of Economy and Finance
Figure 4: Level of electricity consumption in our groups 0,0% 10,0% 20,0% 30,0% 40,0% 50,0% 60,0% Less than 1250 €/month
2240 €/month 5677 €/month More than 8126 €/month No answer 5,6% 20,8% 60,0% 8,0% 5,6% 42,0% 48,0% 14,0% 2,0% 4,0%
TicElec Households * Alpes Maritimes Households **
0 200 400 600 800 1 000 1 200
January February March April May June July August September
Co n su m p ti o n (k W h )
2012 Self Monitoring 2012 Direct Feedback (Real Time)
Figure 5: Peak-load shift in G 21 and G22 in March