HAL Id: hal-01495255
https://hal.archives-ouvertes.fr/hal-01495255
Submitted on 24 Mar 2017
HAL is a multi-disciplinary open access archive for the deposit and dissemination of sci-entific research documents, whether they are pub-lished or not. The documents may come from teaching and research institutions in France or abroad, or from public or private research centers.
L’archive ouverte pluridisciplinaire HAL, est destinée au dépôt et à la diffusion de documents scientifiques de niveau recherche, publiés ou non, émanant des établissements d’enseignement et de recherche français ou étrangers, des laboratoires publics ou privés.
Climate Economics in Progress 2013
Patrice Geoffron
To cite this version:
Patrice Geoffron. Climate Economics in Progress 2013. CDC Climat, Université Paris-Dauphine, pp.282, 2013. �hal-01495255�
Climate
Economics in
Progress 2013
Sommaire
Introduction ...7
Part 1: Carbon Prices and Markets ... 15
Chapter 1: Carbon prices and markets around the world ... 17
1) Introduction ...17
2) Emissions trading schemes ...19
3) Carbon taxes ...41
4) Conclusion ...51
Chapter 2: Short-term emissions reductions in the electricity sector ... 53
1) Introduction ...53
2) Determinants of abatement potential by technological substitution ....53
3) History of the abatement potential in Europe over the period 2005-2012 ..55
4) Estimated abatement in phases 1 and 2 of the European market ...59
5) Geographical distribution of abatement ...61
6) Conclusion ...63
Chapter 3: Free allocation benchmarks in phase 3 of the EU ETS ...65
1) Introduction ...65
2) Two implications of switching to benchmarking ...66
3) Two potential flaws of implemented benchmarking ...70
4) Conclusion ...74
Chapter 4: Governance of CO2 markets: lessons from the EU ETS ... 77
1) Introduction ...77
2) The three causes of current market weaknesses ...79
3) Expectations tend to overestimate the constraint and ignore future uncertainty ...81
Climate Economics in Progress, 2013 Editor in chief: Patrice Geoffron Coordinator: Preety Nadarasapillay
Scientific Direction: Pierre-André Jouvet, Christian de Perthuis Team Coordinators:
Raphael Trotignon, Section 1: Carbon prices and markets Philippe Delacote, Section 2: Agriculture, Food, Forestry
Alain Ayong le Kama, Section 3: Mobility in a low-carbon society Claudie Boiteau, Section 4: Law, Regulation, Climate
Marc Baudry, Section 5: Ecological Transition Jean-René Brunetière, Section 6: Housing
Translation: Michael Westlake and Geoffrey Finch Publishing and graphic design: Les Pointilleuses, Camille Didelon and Aurélia Monnier
Photo credit : Raphael Trotignon
The Climate Economics Chair’s partners Launching partners
CDC Climat
Paris-Dauphine University
Foundation « Europlace Institute of Finance » Research Initiatives’ partners
Amundi Astrium CDC Climat CSTB Danone EDF GDF Suez HSBC In Vivo Michelin Orbéo Sofiprotéol Total
Twenty First Capital Veolia
5 4
Part 4: Law, Regulation, Climate ...188
Chapter 9: The obligation to purchase electricity produced by wind energy and legislation pertaining to State aid ...191
1) Introduction ...191
2) Evading the issue ...194
3) Time to reconfigure the system ...199
Chapter 10: The financial markets and energy: European cooperation between energy and financial regulatory authorities ...209
1) Introduction ...209
2) Regulating energy markets in an evolving environment ...210
3) Cooperation mechanisms between energy and financial regulators ...213
4) Conclusion ...215
Part 5: Ecological transition ... 217
Chapter 11: Theoretical grounds for coupling environmental policies and innovation policies ... 219
1) Introduction ...219
2) The intrinsic interdependency between innovation and environmental policies when facing “green” inventions ...220
3) Efficient taxation of fossil fuels to finance “green” innovation ...226
4) Conclusion ...233
Chapter 12: An overview of policy instruments for green innovation ... 235
1) Introduction ...235
2) Instruments supporting the supply of renewable energy ...238
3) Instruments supporting the demand for renewable energy ...247
4) Conclusion ...256
Part 6: Carbon economy in the construction sector ... 261
Chapter 13: Climate economics in the construction and housing sector ....263
1) Introduction ...263
2) What ways to reduce emissions in the building sector? ...267
3) The general framework of the research ...271
4) Helping to clarify strategies ...273
5) First lines of research for RI6 of the Climate Economics Chair ...275
Author’s bios ...279
4) Evaluation of the Commission’s proposals with the ZEPHYR model ...83
5) The case for an Independent Carbon Market Authority (ICMA) ...87
6) Conclusion ...90
Part 2: Agriculture, Food, Forestry and Climate Change ...95
Chapter 5: Biomass for power generation in Europe: addressing the potential ...97
1) Introduction ...97
2) Key issues and economic considerations in biomass power generation..98
3) Biomass in the current European power generation: potential demand, associated abatement, and cost estimates ...105
4) Matching European biomass supply with potential demand from the power sector: uncertainties and competition for biomass resources ...118
5) Conclusion ...121
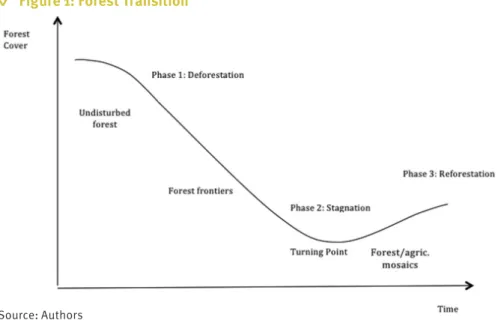
Chapter 6: Forest transition and REDD+ in developing countries: challenges for climate change mitigation ... 125
1) Introduction ...125
2) Forest transition theory, REDD+ and deforestation ...126
3) Different REDD+ strategies for different phases ...134
4) How REDD+ policies can lead to different forest transitions ...141
5) Conclusion ...145
Part 3: Mobility in a Low Carbon Society ... 149
Chapter 7: Specific challenges of the transport sector for implementing carbon regulation ...151
1) Introduction ...151
2) An integrated approach to the complexity of the transport system...152
3) Inertia in the transport system ...157
4) Factors influencing behavioural change in the short and medium term ...160
5) Conclusion ...165
Chapter 8: Low-carbon policies for road transportation in Europe ... 167
1) Introduction ...167
2) Command and control levers ...169
3) Economic instruments ...173
4) Summary table ...183
Introduction
Paving the road
towards “Paris 2015”
Patrice Geoffron, Pierre-André Jouvet
Inaugurated in 2010, the Climate Economics Chair (CEC) is a joint initi-ative of CDC Climat and Paris-Dauphine University. With this project, our common objective is to stimulate innovation in the field of climate change economics, by linking academic and empirical approaches with political decision-making.
In October 2011, the first edition of Climate Economics in Progress was published, delivering an initial package of research work, at a preliminary stage of the Chair’s project. With this second edition, two years later, the scope of our collective work has been extended, with new industrial partners involved in the project and with an expanded research team of both senior and junior researchers.
Between these two editions, the evolution of the international landscape has (unfortunately) confirmed the need for massive efforts to fight against climate change and, for our purposes, to develop and improve an innovative economic toolbox, appropriate to the challenge.
— The assessment provided by the Intergovernmental Panel on Climate Change (IPCC) in September 2013 reaffirmed (with a higher degree of cer-tainty) that human influence has been the predominant cause of observed warming since the mid-20th century, with each of the last three decades being successively warmer at the Earth’s surface than any previous period, and with a 40% incremental CO2 concentration since pre-industrial times (due to the combustion of fossil fuels and net changes in land use).
— The European situation is paradoxical. The EU is the only part of the world with a clear political commitment to promote a low-carbon model of society through, in the medium term, the “20-20-20” targets for 2020 and, in the longer term, the goal of an 80% emissions reduction by 2050 (“Factor 4”). In the meantime, however, the EU is experiencing a severe economic crisis with drastic budgetary limitations for implementing this transition, that are having negative side effects on the functioning of EU ETS (the key tool in the
9 8 In tr od uc tio n
Paving the road towards “Paris 2015”
To address these issues, the team has developed a simulation model –
Zephyr-Flex – that provides a better understanding of the EU ETS (emissions
reduction, supply and demand equilibrium) and its implications for the enti-ties covered. In addition, Zephyr-Switch is a complementary module aimed at describing European countries’ electricity sectors at the technology level.
Part 1 contains four chapters:
— Chapter 1, Carbon prices and markets around the world, is a panorama of the existing economic tools for targeting greenhouse gas emissions. The case of carbon markets is first examined, with an overview of the various market-based carbon pricing initiatives around the world and with a focus on the evolution over time of covered emissions and of carbon prices. Carbon taxes are also analysed in a similar manner.
— Chapter 2, Short-term emissions reductions in the electricity sector, offers an ex-post evaluation of short-term emissions reductions from elec-tricity generation over the first two phases of the EU ETS (2005-2012). The analysis is conducted using the Zephyr-Switch simulation model, with a rep-resentation of the equilibrium of short-term electricity supply and demand. — Chapter 3, Free allocation benchmarks in Phase 3 of the EU ETS, deals with the shift from free allocation to auctions adopted in Phase 3, focusing on transitional free allocation associated with the move from grandfathering to auctioning.
— Chapter 4, Governance of CO2 markets: lessons from the EU ETS, looks at
the lessons drawn from the last eight years of the EU ETS from a broader point of view, focusing on the governance and coordination of climate instruments. Part 2: Agriculture, Forests and Food
Agriculture, forests and land-use change contribute to a large proportion of GHG emissions worldwide (13% for agriculture and 17% for forests), while providing humankind with essential social and eco-system benefits (food, biodiversity, energy, water provision, livelihoods, etc.). The main aim of this Research Initiative is to assess the contribution of these activities to climate change mitigation, taking into account the multi-criteria nature of these sec-tors. The programme covers three main areas:
“Mitigation options in French and Chinese agriculture” addresses, on a
comparative basis in an emerging and a developed economy, the tension between emissions mitigation and the sector’s efficiency in terms of feeding the population.
“Multi-criteria impact assessment in forest and biofuel projects”. The aim
is to analyse synergies and trade-offs, since forests provide many eco-sys-tem services and socio-economic co-benefits and agriculture provides food, biomass and livelihoods.
European strategy). Even in Germany, following the implementation of the
Energiewende in 2011, a debate has arisen as to the economic sustainability
of such a U-turn, potentially calling for investment of 1000 billion euros over the coming decades.
Clearly, when the first edition of our work was published, efforts to com-bat climate change were subject to severe financial constraints, requiring economists (alongside engineers) to be involved in this long-term challenge. Because “Paris 2015” will take place in this context of international stress, the future success of the COP will directly depend on the ability to design, in the meantime, innovative economic schemes to finance the low-carbon transition.
Climate Economics in Progress 2013 is our contribution to this collective effort.
◊
The book is organized in accordance with the structuring of the Chair in terms of “Research Initiatives” (RI), which represent the fields currently covered by the project.
Part 1: Carbon Markets and Prices
The Carbon Markets and Prices Research Initiative is concerned with evaluating carbon pricing instruments and the conditions for their expansion in the world. The programme is organized around four topics:
“Functioning of the EU ETS”: The aim is to analyse the rules of the
European emissions trading system, through the monitoring and analysis of the compliance and the transaction data of the facilities covered. It involves analysing the mechanisms of price formation, the use of flexibility mecha-nisms and the impact of regulatory developments.
“Extension of carbon pricing in the world”: The aim is to provide a
map-ping of emerging carbon markets (including recent developments in North America and Asia) and to consider their “linkage” (both from theoretical and practical standpoints). Carbon price signals are also covered through project-based mechanisms.
“Introduction of carbon taxes”: The purpose is to trace the evolution of
environmental taxation in the world, in particular by analysing existing car-bon taxes in Europe and studying their impact on the countries and sectors concerned.
“Governance and coordination of economic instruments”: The objective
is to observe and understand the interactions between the European car-bon market and other climate-energy policies (renewable energy, energy efficiency, domestic carbon taxes, etc.) and to assess the implications for the governance of carbon instruments. The research team is also discussing these aspects at a more global level in preparation for the 2015 COP in Paris.
In
tr
od
uc
tio
Part 3 contains two chapters:
— Chapter 7, Specific challenges of the transport sector for implementing
carbon regulation, addresses the complexity of transport systems, which is
dependent on multiple objectives, externalities, sectors, levels and players and is subject to inertia. Despite this complexity, the chapter focuses on key factors likely to influence behaviour in the medium and longer term and examines the relevant issues when implementing economic tools for carbon regulation in road transport.
— Chapter 8, Low-carbon policies for road transportation in Europe, pro-poses a classification of policy tools based on the form of action taken by the instrument (e.g. whether it is binding or non-binding). This leads on to the differentiation of regulatory constraints, price incentives, collaborative tools and information policy and an assessment of their potential impact on the demand and supply sides.
Part 4: Law, Regulation, Climate
This Research Initiative advances knowledge on the legal aspects of eco-nomic instruments for addressing climate change. With a focus on European energy and carbon markets, it provides legal analyses of the economic instruments that may be favoured in the transition to a competitive, low-car-bon economy, with a focus on three topics:
“Law and regulation of energy markets and ‘carbon reduction’” examines
the operation of regulated energy markets which, while ensuring the liberal-ization of the sector, help to achieve carbon reduction.
“Law and regulation of carbon markets”. This research theme contributes
to studies aimed at analysing the conditions for increased legal protection for both regulated and voluntary carbon markets and proposing solutions for the optimal operation of these markets.
“Regulation and institutional coherence”, in relation to the regulation of
the energy and carbon markets, addresses new issues around regulating institutional systems, using an approach based on comparative law.
Part 4 has two chapters:
— Chapter 9, The obligation to purchase electricity produced by wind
energy and legislation pertaining to State aid, deals with the tensions
between the promotion of renewables and competition issues, around the definition of State aids.
— Chapter 10, The financial markets and energy: European cooperation
between energy and financial regulatory authorities, presents and
dis-cusses the regulatory framework of European financial energy markets and the existing European model of cooperation between energy and financial authorities.
“Land-use, product competition and forest-agriculture interactions”.
The goal is to scrutinize patterns of short-term and long-term interactions between agricultural expansion and deforestation and their potential syn-ergies through agro-forestry.
There are two chapters:
— Chapter 5, Biomass for power generation in Europe: addressing the
potential, analyses the potential for introducing bioenergy in European power
generation. It considers both the potential demand of existing European power-plants and the potential supply provided by agriculture and forests.
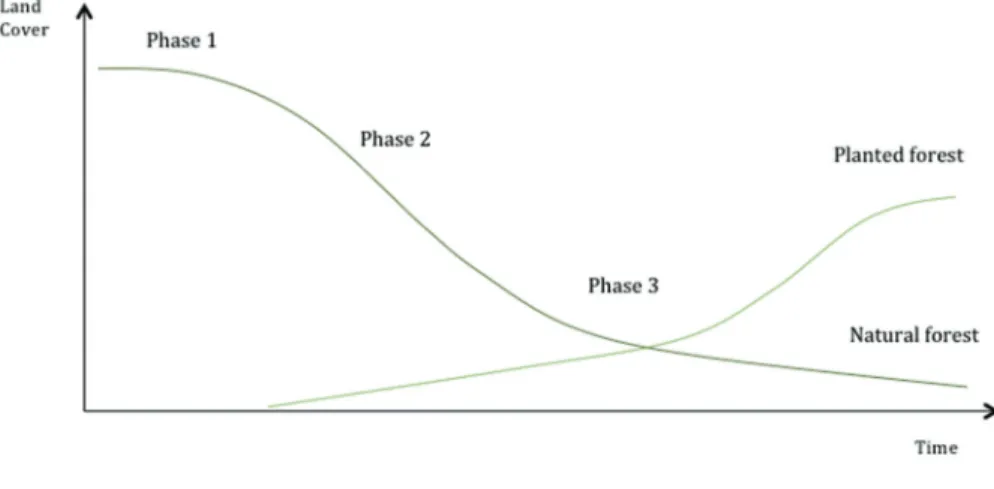
— Chapter 6, Forest transition and REDD+ in developing countries:
chal-lenges for climate change mitigation, presents the “forest transition”
hypoth-esis, which describes the long-term change of forest cover in a given country, and analyses the implications of this theory within the REDD+ framework. Part 3: Mobility in a Low-Carbon Society
“Mobility in a Low-Carbon Society” covers the transition to sustaina-ble mobility, which requires a major structural shift in both passenger and freight transport systems. Road transport is responsible for roughly three quarters of the CO2 emissions produced by the transport industry, which itself accounts for 25% of total CO2 emissions in Europe. To introduce the right signals, economic theory offers public policy makers a number of levers and tools, though these are often highly theoretical. The general idea guid-ing the work is that the future competitiveness of the transport industry is directly related to its ability to attach greater value to external environmental factors, especially carbon emissions. The research programme is structured around three topics:
“Meeting the overall challenge of climate change at the level of urban mobility” aims at organizing local governance for low-carbon mobility
and estimating the potential demand for and the environmental impact of innovative urban mobility solutions (technological, organizational and infrastructural).
“Industry approaches to low-carbon mobility” analyses the process of
creating innovations (products, processes, organization, etc.), thus enabling industry to adapt to new regulations, and more widely promoting the role and participation of private actors in building carbon regulations.
“New technologies and innovative mobility services for urban travel-lers” investigates individual mobility in different geographical areas, and
estimates the potential for development among urban households and the environmental impact of new mobility services. The role of businesses in determining the mobility behaviour of urban households is emphasized, as well as fleet management policies.
13 12 In tr od uc tio n
Paving the road towards “Paris 2015”
comprehensive view of sectoral analyses (industry and electricity for RI1, agriculture and forest for RI2, transport for RI3). This research programme will address the following questions:
What proportion of energy is permanently lost in domestic use and what proportion of this consumption is recoverable (and is the energy consumed a relevant measure from an overall management perspective)?
What typologies should be used to assess the cost-effectiveness (taking account also of energy uses) of each type of building?
How does one evaluate the real potential for energy savings in relation to costs (taking account of all types of cost)?
What are the economic effects of structural rigidities and other barri-ers (architectural constraints, legal provisions, financial capacity, relations between landlords and tenants, relations among joint owners, subdivision regulations, etc.)?
What are the optimal strategies over time to bring a building up to a given level of performance in 2050? What might be the stages of this strategy?
Chapter 13, Climate economics in the construction and housing sector, presents an overview of the main issues and considers the key research questions that need to be addressed in this programme.
◊
This 2013 edition of Climate Economics in Progress thus represents a contribution to the trial-and-error process in constructing and fine-tuning efficient economic tools for mitigating emissions and for developing adapta-tion strategies. While the content is indebted to the cooperaadapta-tion of our highly committed European corporate partners, we pay great attention to putting forward solutions that can help transform the social and political outlooks of our societies regarding environmental issues by means of economic tools. Part 5: Ecological Transition
The fifth Research Initiative aims to better account for the key role of “natural capital” and to put the economy on a sustainable growth path, with specific attention to “green innovations” and the economic tools to promote them. Three research tracks have been identified:
Efficiency and innovation in the use of natural resources is intended to
provide a detailed analysis of “green innovation”, including the study of the profitability and the dissemination of renewables and carbon-mitigating technologies, such as carbon capture and storage. The emphasis is more specifically on the role of innovation for ensuring their economic viability.
Natural capital and eco-systemic services aims at broadening the
per-spective through research themes that encompass climate change but are not restricted to its direct consequences, such as “energy efficiency” or “biodiversity”.
Long-term financing and the involvement of investors investigates the
interplay between finance and an environmentally sustainable economy. It mainly focuses on whether “green innovation”, as measured by the number of “green” patents in a firm’s patent portfolio, adds value to intangible cap-ital or whether investors disregard it.
There are two chapters:
— Chapter 11, Theoretical grounds for coupling environmental policies
and innovation policies, argues that policy instruments aimed at addressing
the free-riding problem characterizing innovation economics and the pol-lution externality that is the basis of environmental economics have to be jointly analysed in shaping efficient “green innovation” policies.
— Chapter 12, An overview of policy instruments for green innovation, offers an overview of the main policy instruments for promoting “green” innovation and the spread of “green” technologies. Though this chapter does not reject the standard dichotomy between “demand pull” and “tech-nology push” instruments, it argues that the distinction is not as obvious as it seems. Emphasis is placed on the crucial role of details in designing instruments, illustrated by feed-in tariffs and of tax credits.
Part 6: Climate economics in building and housing
According to UNEP (United Nations Environment Programme), building is the sector offering the best prospects for reducing greenhouse gas emis-sions in the medium and long term. In the French case, residential and ter-tiary buildings account for almost 45% of the energy consumed in France and emit about 28% of greenhouse gas. The Climate Economics Chair is prepar-ing a new Research Initiative focused on this area, so as to provide a more
Part 1
Carbon prices
and markets
The economics literature contrasts “command and control” policies, in which the public authority sets up standards and rules to directly reduce environmental damage, and policies based on “economic tools” that aim at changing the behaviour of economic agents through the modification or introduction of prices, which reflect the cost of environmental damage in a context where traditional markets fail to account for environmental external-ities. There is a broad consensus among economists in favour of economic tools that aim at protecting the environment in the most efficient way, i.e. by minimizing the total cost of pollution abatement. Despite those recommen-dations, most current environmental policies continue to favour command and control policies. However, since the 1990s, climate change policy has been a notable exception. There are two ways of introducing a price that incorporates environmental externalities into the markets, namely price-based regulation and quantity-price-based regulation. Price-price-based policies gen-erally consist of taxes or comparable levies; quantity-based policies usually consist of cap-and-trade or baseline-and-credit programmes, which create tradable emissions rights. Both have been implemented in various countries and in various economic sectors.
The four chapters of Part 1 address a wide range of issues related to the implementation of carbon pricing tools within and outside Europe and to the impact of their development.
— Chapter 1, Carbon prices and markets around the world, is a panorama of the existing economic tools for targeting greenhouse gas emissions. The case of carbon markets is first examined, with an overview of the various market-based carbon pricing initiatives around the world and with a focus on the evolution over time of covered emissions and of carbon prices. Carbon taxes are also analysed in a similar manner.
— Chapter 2, Short-term emissions reductions in the electricity
17
Chapter 1
Carbon prices and markets
around the world
Simon Quemin, Jill Madelenat, Jeremy Elbeze,
Wen Wang
1. Introduction
Global action to tackle and mitigate climate change has never been more urgent. As global GHG concentrations continue to rise in the atmos-phere, the buffering capacity to maintain temperatures at decent levels becomes ever more eroded. The window for concerted action to avoid dangerous and irreversible climate change is growing ever thinner. Though the international consensus is that global temperatures should not exceed 2°C above pre-industrial levels, the current and inadequate level of mitigation around the world is likely to lead us towards a world that is 4°C warmer by 2100. Such a situation would profoundly impact human life and ecosystems in the long term. There is a growing gap between the 44 GtCO2e that should be emitted annually at the global scale by 2020 if we want to stand a chance of being on track for the 2°C target and the 52 to 57 GtCO2e now deemed to be the possible emissions by 2020 if we stick to the current level of action. The true challenge is therefore to agree on a policy that will be both able to bridge this gap and to achieve this at the lowest cost.
Three families of instruments are available to control greenhouse gas emissions. The first is that of “command and control” regulations, which consist of setting specific standards to emission sources, enforced by administrative controls and penalties. Although they are particularly well suited to specific products for which technologies are similar and emissions are easily verifiable, they are less adapted to controlling green-house gas emissions at a larger or global scale, given the extreme variety of emissions sources and processes involved. Accordingly, the total cost of reductions achieved with this method is likely to be high given the dif-ficulties encountered by the public authority when deciding the most effi-cient distribution of efforts among actors in a context of high uncertainty. electricity generation over the first two phases of the EU ETS (2005-2012).
The analysis is conducted using the Zephyr-Switch simulation model, with a representation of the equilibrium of short-term electricity supply and demand.
— Chapter 3, Free allocation benchmarks in Phase 3 of the EU ETS), deals with the shift from free allocation to auctions adopted in Phase 3, focusing on transitional free allocation associated with the move from grandfathering to auctioning.
— Chapter 4, Governance of CO2 markets: lessons from the EU ETS, looks
at the lessons drawn from the last eight years of the EU ETS from a broader point of view, focusing on the governance and coordination of climate instruments.
Pa rt 1 : C ar bo n p ric es a nd m ar ke
As an alternative to command and control policies, economists have sug-gested incorporating the cost of climate change into economic choices through a carbon price. In theory, this price should be equal to the damage done to the atmosphere by the additional emission of one tonne of carbon dioxide. Carbon pricing should compensate for a failure of the economy, by recognizing the scarcity of a global common good which had hitherto been considered infinite: the amount of CO2 that can be emitted into the atmosphere.
To generate this carbon price, governments have two instruments avail-able, which can address a wider range of emissions sources and take into account their heterogeneity: carbon taxes and carbon markets (Emission Trading Schemes, or ETSs). These two economic tools allow the total reduc-tion cost to be minimized by the arbitrage of economic actors facing the carbon price. Emitters with low reduction costs (below the carbon price) will reduce emissions first because it is cheaper for them to reduce emissions than to pay the price associated with emissions. Conversely, actors with high reduction costs will pay the carbon price, and reduce their emissions later when the price level becomes attractive. Emissions are thus reduced from the cheapest to the most expensive and the total cost is minimized.
If it is impossible to assess the “right” carbon price to the nearest penny, it should however be the one that fosters low-carbon measures, both in the short and long run. In the short term, emitters can adapt their existing pro-duction facilities and propro-duction processes, for example by fuel-switching. In the longer term, the carbon price encourages low-carbon capital invest-ments. In short, the price is meant to guide a change of behaviour: as a car-bon price is incorporated into the production costs of goods and services, it provides an incentive for both companies to manufacture their products while emitting less and households to shift their consumption from emis-sion-intensive goods to cleaner ones.
Carbon taxes and carbon markets are two symmetrical ways of gen-erating a carbon price. In the case of taxation, the public authority deter-mines the carbon price, and observes the effect of this price on emissions. Symmetrically, in a carbon market, the public authority determines an emis-sion reduction target (a limit on the quantity of emisemis-sions allowed, or more commonly a cap) and allows the exchange of emission rights on the market to reveal the corresponding carbon price. Theoretically speaking, there is a mirroring relationship between the cap and the tax level. Consequently, this chapter is divided into two symmetrical parts. The first section examines the case of carbon markets. We begin with an overview of the various mar-ket-based carbon pricing initiatives around the world. We then complete this initial overview with a particular emphasis on both the evolution of covered emissions over time and that of carbon prices. With that in place, we con-clude the first section by summarizing the main lessons that can be drawn
from both the existing markets and recent market proposals. The second section deals with carbon tax in a similar manner.
2. Emissions trading schemes
In the last decade or so, greenhouse gas Emissions Trading Schemes (ETSs) have proliferated. While international climate negotiations have stalled in the search of a successor for the Kyoto Protocol and the deadline of Paris 2015 continues to loom over a necessary agreement process, this pro-liferation has even gained momentum recently as a multiplicity of regional, national and even sub-national schemes have appeared. Some with a high level of harmonization and others with very little in common, these different schemes vary both in terms of shape and design and reflect the various eco-nomic, cultural and political environments in different regions of the world. Beyond the level of ambition or stringency proper to each scheme, incipient initiatives have been designed based on both the successes and failures of older ones like the European Union Emission Trading Scheme (EU ETS). In particular on the issue of supply-side flexibility, which has shown to be a cru-cial point in terms of resiliency of the emission constraint over time, recent or soon-to-be schemes’ proposals are quite different from one another, but all are innovative in their own ways.
The current situation heavily contrasts with what was deemed to be the most efficient way to tackle climate change in the late-1990s, that is a single global carbon market minimizing the cost of reductions across the globe. Back then, as major industrialized countries pledged to take actions to diminish their GHG emissions under the Kyoto Protocol, the very core of the then on-going debate was slanted towards how to design this scheme in the most effective manner and at the lowest costs. In the fragmented, decentralized carbon market and climate policy emerging landscape, this approach seems far behind us now, if not unachievable. However, the multi-plicity of markets raises the question of implementing transmarket dynam-ics by linking them up and progressively arriving at a single global market. Bearing in mind the unequal and recent developments in carbon pricing in a growing number of countries around the world, a thorough overview of these initiatives is needed.
Overview of market-based carbon pricing initiatives around the world To date there are ten ETSs worldwide, regardless of their ages, their sta-tuses or their respective covered emissions. In this section, we will first focus on the various ETS developments around the world and on the most determi-nant setting of those schemes, which is the nature of the reduction targets.
21 20 Pa rt 1 : C ar bo n p ric es a nd m ar ke ts
Chapter 1: Carbon prices and markets around the world
Figure 1: A mapping of the various ETSs around the world
Note: Emissions Trading Schemes only. Crediting mechanisms and carbon taxes not included. Source: Climate Economics Chair
Pa rt 1 : C ar bo n p ric es a nd m ar ke
Table 1: Comparative Table
National & ETS Targets Cap Setting* Scope** Form of Allocation
EU ETS 2005 Mandatory 2020: -20% /1990 lvl 2050: -80% /1990 lvl About 2.2 Bt.
Cap decreases by 1.74% per year, except for aviation. Absolute hard cap.
Power, heavy industry + new ind. in 08 and 12. Aviation since 12.
T=20MW; %=45.
NAPs à EU-centralized process. Dominant free alloc. à dominant auctions + free alloc for EITE
(to be phased out) 2020: -21%/1990 lvl
NZ ETS 2008 Mandatory & Voluntary
2020: -10/20% /1990 lvl
2050: -50% /1990 lvl Could reach 80 Mt by 2015 About 40 Mt for now. Absolute soft cap.
Gradual inclusion. All economy by 2015 (forestry since 2008, agriculture in
2015?). T=2ha; %=40 in 2011.
Free allocation except for fuel and power. Will decrease. No auctions.
Point of obligation as far upstream as possible. Not defined.
RGGI 2009 Mandatory
Depends on State. About 110 Mt.
Cap: likely to be slashed by 45%, from 2015: -2.5%/yr
Absolute hard cap.
Power sector only. T=25MW; %=22. Mainly auctions (90%). No free allocations. 2014: 2009 lvl 2018: -10% /2009 lvl California 2013
Mandatory & Voluntary as of 2018
2020: 1990 lvl
2050: -80% /1990 lvl Absolute cap set at 160 Mt in 13-14, then at 390 Mt in 2015, then decreasing
by 12 Mt per year.
Power, heavy ind. (2013) à + fuel distr. (2015). T=25kt/yr; %=36 in 2013, 85 in
2015.
Mainly auctions with some free allocation to power and industry decreasing over time. 22% of overall target achieved via ETS
Kazakhstan 2013 Mandatory & Voluntary
2020: -5% /1990 lvl
2050: -25% /1990 lvl Cap: unknown for 2014 on yet. 167Mt in 2013. Absolute hard cap.
Power + heavy ind. (Agriculture and transport later included?)
T=20kt/yr; %=77.
100% grandfathering in P1 à in P2 EU-like benchmarks. Remainder auctioned. Unknown yet.
Australia 2014/2015? Mandatory & Voluntary
2020: -5% or -15/25% /2000 lvl 2050: -80% /2000 lvl
About 330Mt.
5-year rolling cap from 20124/2015 on. Absolute hard cap.
Power, heavy ind., transport, waste. Agri and forestry out.
T=25ktCO2e/yr %=60.
Dominant auctions. Free allocation (transitional assistance + EITE) gradually phased out Unknown yet.
South Korea 2015 Mandatory & Voluntary
2020:-4%/2005 lvl 2050: unknown
About 350Mt.
Cap: set in 2014; in line with reduction target.
Absolute hard cap.
Energy, ind., trade, building and waste. %=60; T=25kt then lowered to 15; 125
for business entities.
100% free allocation in P1 à EU-like bench-marks. Remainder auctioned, except for EITE. Unknown yet.
Chinese 7 Pilots 2013 & 2014
Mandatory
2015: intensity target
~ -18% /2010 lvl Relative Cap. Could transition to abso-About 700Mt. lute cap by 2020.
Depends on pilot. Power and heavy ind. T=20kt/yr on average; % range
from 35 to 6O.
100% grandfathering for pilot phase in general. Corrected for expected output and growth.
Afterward: unknown. Irrelevant.
25 24 Pa rt 1 : C ar bo n p ric es a nd m ar ke ts
Chapter 1: Carbon prices and markets around the world
Banking & Borrowing Price Management Offsets (x%=limit of use) Peculiarities
EU ETS 2005 Mandatory
Unlimited banking.
Borrowing allowed within CP, limited to amount of next year’s free allocation.
No price stabilization mechanisms but pos-sible via structural reforms under
discus-sion. Backloading approved.
CDM (LDCs)/JI (KP2 OK) offsets allowed with restrictions. Limit per instal not set (50% of overall
obligation)
1st multi-national and largest ETS. Structural & flexibility reforms being discussed. Suffers from
lack of clarity. NZ ETS
2008 Mandatory & Voluntary
Unlimited banking. Forbidden for fixed price NZUs.
Borrowing forbidden.
Possibility to buy NZUs at a fixed price (NZ$25). Corresponds to a price ceiling. The
“one-for-two” rule applies.
EU-like restrictions for CDM/ JI (100%) allowed until 2015. Deforestation can be offset by
planting trees
Includes land-based sectors. Soft cap: ETS helps meet KP targets but Gvt liable for
ensur-ing target is met. RGGI
2009 Mandatory
Unlimited banking. Borrowing forbidden but possible via
advance auctions.
Minimum auction price. Cost Containment Reserve (proposal). CP can be extended.
RGGI-based offsets only up to 3.3%. Intl offsets allowed + limit increased
if prices exceeds thresholds.
Total cap=aggregation of state-level cap. Non-binding participation. Was subject to heavy
over-allocation. California
2013
Mandatory & Voluntary as of 2018
Banking allowed but sbjt to holding limit. Borrowing forbidden but possible
via advance auctions.
Reserve price for auctions. Price Ceiling Mechanism (allowance reserve).
Only US-based offsets allowed (8%). Applies to 4 areas, including for-estry. REDD (2%). Will be widened.
ETS = back-up, as part of a broader plan. Original treatment of land/REDD via offsets.
Linking with Québec as of 2014. Kazakhstan
2013 Mandatory & Voluntary
Both are forbidden during P1. Banking likely to be allowed from P2.
Currently: a share of the allowance reserve can be sold at a fixed price. To be further
developed.
Only domestic offsets allowed (100%). ERUs and CERs may be used later, depending on Intl negotiations.
1st Asian country to implement an ETS, rela-tively unhindered so far. KAZ belongs to Annex
1 but not Annex B. Australia
2014/2015? Mandatory & Voluntary
Unlimited banking. Borrowing limited to following vintage
year, up to 5% of current year obl.
5-year rolling cap.
Price floor cancelled. Ceiling set at $20/t above EUA price.
Only CFI-issued offsets allowed (5%) until 2015. Then, UN credits (12.5%) and EUAs (50%) allowed.
Fixed price until 2015. Ambition depending on Intl efforts. Designed to be highly linked. CFI
land-sector offsets. South Korea
2015 Mandatory & Voluntary
Banking restricted (1 year span of next CP).
Borrowing allowed within a CP, for up to 10% of emissions.
Clear mechanisms and explicit triggers (reserve, limits on borrowing and banking,
offsets, holding; Price floor & ceiling).
Only domestic offsets allowed (10%) until 2020. Then, Intl offsets
included but use of UN credits uncertain.
1st Asian country to pass an ETS into law. Unique inclusion threshold. Strong opposition
from industry. Chinese 7 Pilots
2013 & 2014 Mandatory
In general: banking allowed in pilot phase. Banking forbidden.
Still under discussion. May include price ceiling/floor, fixed price, reserve, supply/
demand adjustment every year.
Only domestic offsets (CCERs) allowed. Limit depends on scheme,
never exceeds 15%.
1st ETS building itself from the bottom-up (pro-vincial à national).
High execution speed, implemented in 2 years.
* EUETS=aviation included (210Mt), RGGI= 09-11 averaged emissions (RGGI COATS).
** T = Inclusion threshold; % = percentage of GHG emissions covered in terms of overall GHG emissions.
Legend: EITE=Emissions-Intensive and Trade-Exposed; CFI=Carbon Farming Initiative; CP= Compliance Period; KP=Kyoto Protocol; LDC= Least Developed Country; NAPs=National Allocation Plans; P1,2,3=Phase 1,2,3.
Note: For clarity, only major ETSs are included. The Swiss ETS and the Québec cap-and-trade respectively resemble that of Europe and California, and are therefore not included. Monitoring, Reporting and Verification (MRV) procedures are not discussed as it would require a thorough and detailed comparative analysis, which is beyond the aim of our work.
Pa rt 1 : C ar bo n p ric es a nd m ar ke
The various statuses of the ETSs
Figure 1 maps the various ETSs around the world and Table 1 summarizes their key features. There is a wide range of stages of development since some are already in force while others are to be launched in the years to come or still under negotiation. Even among ETSs in force, the statuses dif-fer greatly. Some are at a very advanced stage, such as the European Union Emission Trading Scheme (EU ETS) or the Regional Greenhouse Gas Initiative (RGGI), which respectively started in 2005 and 2009 and have already been through reviews and amendments, while others like California and Québec (2012) or Kazakhstan (2013) have only just got started. The seven Chinese pilots, for instance, are expected to be launched over the course of 2013. The Australian Carbon Pricing Mechanism (CPM) has a special feature: it came into force in 2012 but cannot be seen as a fully implemented ETS as it is now in a fixed-price period in which government sells permits at fixed prices but is expected to transit to a flexible-price period either by July 1st, 2014 or 2015 as the current Prime Minister intends to scrap its carbon tax to bring the flexible price period forward by one year. Likewise, in South Africa, existing taxes could possibly be converted into a domestic ETS. In general, recent or soon-to-be schemes have been built based on experiences gath-ered from older ETSs, mostly the EU ETS (general lessons on the design of such schemes are drawn at the end of this chapter).
Many other countries are also considering the implementation of national ETSs with various degrees of likelihood, sometimes as part of multinational dynamics. A blatant example of this is Turkey, which would be required to implement an ETS should it join the EU. Similar to the case of Turkey is that of Ukraine, which should prepare a new ETS draft law for the end of the year 2013. 2017 seems to be a realistic start date should the forthcoming proposal be accepted. Some countries also opt for testing cap-and-trade through pilot schemes, eventually expanding to the federal/national level. The most telling example is that of China (see Box 1). Brazil seems to be taking a similar path as an ETS is expected to be initiated in Rio de Janeiro in the next couple of years. A similar scheme could also emerge in Sao Paulo and in the Acre region, which could then pave the way toward a national ETS. Finally, some of World Bank Partnership for Market Readiness participants such as Chile, Mexico, Peru for the Americas but also Vietnam and Thailand in Asia are all eyeing the implementation of an ETS. Among these, Chile is the most developed project. An in-depth analysis of those schemes is available in Quemin (2013).
Absolute versus intensity targets
Absolute targets impose a defined cap on overall emissions, meaning that the maximum authorized amount that covered sources can emit is explicitly stated.
This is the rationale for most emissions trading schemes and is the rule for example in the EU ETS, RGGI and California. An exception is New Zealand, which has an absolute but currently unspecified reduction target, what is thus called a “soft” cap. It means that there are significant exceptions that allow certain entities to exceed the cap or to benefit from special treatments. This goes hand in hand with the “two-for-one” rule allowing liable entities to surrender one permit for every two tonnes emitted, or the unlimited use of offsets. However, the NZ government is currently drawing up a proposal for auctions, which implicitly implies that a 5-year overall hard cap will be provided.
Conversely, intensity-based targets do not impose a defined cap on over-all emissions. They consist in capping the carbon content of GDP or energy consumption without imposing an absolute limit on quantities. Such targets have been implemented since 2007 in the Canadian province of Alberta, where liable entities must reduce their emissions intensity by 12% from their government-approved 2003-2005 baseline emission intensity. Emission Performance Credits (EPCs) are generated by facilities that have gone beyond the 12% baseline and can be traded. The seven Chinese pilots are also built on this model before possibly shifting toward an absolute target by 2020. As reduction targets are expressed as a percentage of the carbon intensity of production or of the GDP, emissions may not be decreasing in absolute terms in the end, hence raising the question of the environmental effectiveness of such schemes.
Emissions coverage around the world The emissions covered by ETSs
The graph below shows three paths of emissions coverage over time at the global scale. The solid line represents the evolution of coverage includ-ing schemes in force as of 2013, while the two dotted lines are hypothetical scenarios accounting for future and likely schemes.
29 28 Pa rt 1 : C ar bo n p ric es a nd m ar ke ts
Chapter 1: Carbon prices and markets around the world
Figure 2: Various emissions coverage paths
Legend: As of today = EU ETS+aviation, NZ ETS, CH ETS, RGGI, Tokyo ETS, Australia, California, Québec, Kazakhstan, 7 Pilots
Scenario A = As of today + South Korea, Chile, Brazil, Ukraine
Scenario B = Scenario A + Mexico, Turkey, Ontario, British Columbia, Manitoba Source: Climate Economics Chair
The “As of today” scenario encompasses ten schemes that have already kicked off or are about to over the course of the year, namely EU ETS + aviation, NZ ETS, CH ETS, RGGI, Tokyo ETS, Australia, California, Québec, Kazakhstan and the seven Chinese Pilots. Scenario A includes “As of today” schemes plus schemes whose implementation is already scheduled (South Korea) or deemed likely (Chile, Brazil, Ukraine) given the current state of negotiations. In addition, scenario B takes into account other schemes that might start before 2020, including Mexico, Turkey, and three WCI states (Ontario, British Columbia and Manitoba). Despite the recent announcements made by the White House that could possibly lead to a cap-and-trade targeting power plants at a federal level and the Chinese intention to implement a national scheme, those were not included as their hypothetic scopes or start dates are subject to high uncertainty.
Sticking with the “As of today” scenario and thus limiting our hypotheses on the future of carbon trading, the EU ETS will keep on having the lion’s share of emissions trading by 2020, roughly covering half of the globally capped emissions, down from almost 95% in 2011 (see Figure 3). As of 2013, existing ETSs (including Australia carbon tax and the seven Pilots) cover approximately 3.7 GtCO2e annually, that is around 7% of the 50 GtCO2e emit-ted globally. However, the share of covered emissions could soar in the years to come, of course with countries like Brazil, Korea, Ukraine or Chile currently
crafting their own schemes, but notably with big emitters like China and the US possibly joining the club as they have recently unveiled carbon-policy plans. Ambitious as they may be, these initiatives still fall far short of what is needed to limit the temperature rise below 2°C.
Figure 3: Emissions Coverage Distribution, “As of today” scenario.
Source: Climate Economics Chair
ETS Scope & Target
The ETS-specific target and therefore the cap might be more or less strin-gent than the overall nation-wide reduction target, if such a target exists. It is therefore important to review the various ETS scopes around the world. Energy generation and industrial processes, broadly defined, are always included, except for RGGI, which is only focused on power plants. The high-lights from Table 1 can be summed up as follows: because they are often already and easily monitored and account for a large share of emissions, power plants and heavy industry are initially included, then gradually joined by other parts of the industry sector and other sectors of the economic pie.
As noted above, a gradual inclusion is generally being made based on the phases’ timeframe. These may be rather restrained as in the case of Europe, where only aviation and a few industrial activities were included in Phases 2 and 3 or, conversely, be rather comprehensive as in New Zealand where the entire economy will be included by 2015. Forestry and agriculture are generally excluded as emissions reductions are regarded as rather uncertain and complex to quantify in the long run. However, the NZ ETS is the excep-tion as it kicked off in 2008 only with forestry (counted as a carbon sink), later joined by liquid fossil fuels, power generation, industrial processes and fishing in 2010 and waste and synthetic GHG in 2013. Currently, agriculture
Pa rt 1 : C ar bo n p ric es a nd m ar ke
only has a reporting obligation but should it join the ETS in 2015, the whole economic pie could then be covered. In Australia, the agricultural sector is also covered but in an indirect manner, from the Carbon Farming Initiative. For its part, California has planned to include distributors of fuels for com-bustion in the transportation and building sectors as of 2015. The South Korea scheme will also span trade, building and waste sectors, in addition to the usual ones. Another important feature (not discussed here) is the inclusion threshold that allows the exclusion of small emitters whose partic-ipation costs could exceed the benefits of inclusion. Finally, it is noteworthy to mention that provisions for voluntary opt-in (and conversely opt-out) are sometimes included.
Carbon prices around the world
In contrast to the economists’ ideal of a unique carbon price, several ETS have emerged in the last decade thus leading to multiple carbon prices around the world. The graph below shows the evolution of carbon prices in the main market-based carbon pricing initiatives around the world. A brief explanation for each scheme prices follows.
Figure 4: Various carbon prices evolution on a quarterly basis since 2005
Legend: EU ETS: Dec 12 contract price, then spot price; RGGI: quarterly auction price; NZ ETS: NZU spot price; California: quarterly auction price; CDM: secondary CER spot price.
Source: Climate Economics Chair, from CITL, RGGI COATS, Point Carbon.
EU ETS
First, EUAs traded at around €20-25 as the market was deemed “short” (emissions > cap). However, when 2005 verified emissions were released in 2006, market players realized the market was in fact probably over-sup-plied. Phase 1 allowances could not be banked into Phase 2, therefore prices
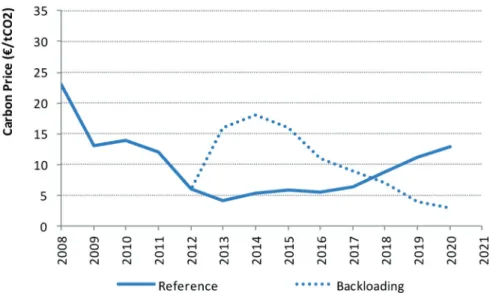
dropped, with Phase 1 contracts spot prices converging to zero as a result of the no carry-over provision. In the beginning of Phase 2, prices soared again due to discussions on the 2020 target and expectations of a tighter cap. The prices reached €30 per tonne before collapsing to €12 in early 2009 due to the economic and financial crisis. This massive drop was followed by 2 years of relatively low volatility and stable prices, i.e. a new equilibrium in a context of slow recovery. Prices rose a little in mid-2011 after the Fukushima catastrophe as nuclear power endured a blow (a substitute for fossil-based electricity production), but prices fell again in late 2011, never to be propped up to such levels again. This fall was caused by discussions about an energy efficiency directive and by the effects of the renewable energy directive — possibly overlapping with the ETS target, but also by the debt crisis along with the degraded growth outlook. Prices were then halved in early 2013 due to the European Commission “backloading” proposal being rejected by Parliament. Since then backloading has been voted by Parliament but the effect on the EUA price has been very modest. EUAs trade now at around €4.5, a little above $6.
The EUA price is the main driver for the CER price, notably because Europe is the major source of demand for CDM (Clean Development Mechanisms) credits. Over the course of 2012 though, the CER prices collapsed to rock-bot-tom levels. The main reasons for this collapse are:
the tightening of qualitative regulations on CERs and ERUs in the EU that caused a massive use of post-2012 non-eligible credits for pre-2013 compli-ance before they lose their values as substitutes for EUAs
a post-2012 credits supply that covers the potential demand more than twice: after 2012 compliance, only about 700 MtCO2e in total for 2013-2020 can be covered with offsets compared with the EU-allowed CDM credits sup-ply estimated at around 1,700 MtCO2e;
the almost non-existent and uncertain demand from other carbon mar-kets or countries until 2015 at the earliest, should new ETS allowing inter-national credits emerge, for example in Australia, where they have been combined with a steadily increasing supply of offsets as CDM projects have produced more than what was expected.
NZ ETS
Roughly speaking, the NZU prices have been driven by CDM credit prices. Given the small size of its economy and the subsequent limited potential for cheap abatement, New Zealand designed an open ETS. As part of their “soft” cap, the use of international offsets is allowed for up to 100% of obligation, which explains the NZU dependence on CER. Via indirect linking through the CDM and given the size ratio of both schemes, the drop in EUA prices therefore impacted the NZ ETS, driving the NZU prices very low. The decrease
33 32 Pa rt 1 : C ar bo n p ric es a nd m ar ke ts
Chapter 1: Carbon prices and markets around the world
has been steady since the beginning of 2011, following the CDM prices move-ments. NZUs now stall at record lows and are locked-in their downward spiral.
As New Zealand refused to renew its commitments under the second period of the Kyoto Protocol (2013-2020), CDM/JI credits are thus likely not to be usable after 2015, but carry-over provisions for vintages from CP1 into CP2 are still under discussion. Consequently, foresters monetize their NZUs by swapping them into UN offsets, planning to surrender the cheaper off-sets for compliance while reaping the benefits from the NZU sales before eventually exiting the market they entered on a voluntary basis. Although emitters are taking advantage of the current low NZU prices by purchasing them from foresters and then banking them lest future prices should rise, analysts do not foresee the prices taking off, even after 2015, unless the opposition (Labour + Green) regain power in the 2014’s elections and tighten up the scheme.
RGGI
After more than three years locked at the minimum auction price of $1.93 (subject to increase with inflation), the prices reached $3.45 at the last quar-terly auctions. The low price and the thin liquidity were caused by a growing allowance supply glut which reflected the unforeseen evolution of natural gas markets in the US, the economic slowdown and efficiency gains. The RGGI partners are now discussing tightening the cap by 45% down to 91 from 165 millions of short tonnes of CO2 as part of an updated model rule. The RGA price has steadily increased since the bolstering announcement last February, clearing at + 74% from where they had stalled before. Prices are foreseen to keep on increasing. The reduction is to be effective as of January 1, 2014 as all nine of the partners are on track to pass it into law and update the related regulations.
California
Even if it is too early to assess the performance of the scheme, as it only kicked off this year, one can observe that CCA prices have been quite steady since the first auctions held in late 2012. The prices have stood a little higher than the auction reserve price (settled at $12 in 2012, increasing by 5% per year plus inflation onwards). As of today, California is now where the carbon price is the highest in the world, almost twice the price of an EUA.
Box 1: Carbon markets development in China
As the world’s largest energy consumer and GHG emitter, China has been gradually adopting policies to control its GHG emissions growth and to shift to a low-carbon development pathway. Its climate commitment submitted under the Copenhagen Accord was translated into the national carbon intensity targets, written into the national 12th Five-Year Plan. Since the traditional command-and-control regulatory approaches demonstrated their limits in achieving energy intensity goals, the government intended to expand the scope of the policy measures to use market-based mechanisms to control emissions.
In October 2011, the national development and reform committee (NDRC) designated five cities (Beijing, Tianjin, Shanghai, Chongqing, and Shenzhen) and two provinces (Guangdong and Hubei) as the pilots to test carbon emission trading. Local authorities are required to coordinate the draft of overall ETS design and implementation plans, formulate ETS oversight guidelines, determine emission caps based on local GHG inventories, draw up allowance allocation rules, establish registry and governance systems, and develop market infrastructure.
Later in June 2012, the interim VER Rules were officially published to provide a basis for project-based offset markets in China. Credits complying with the VER Rules will be labelled China Certified Emission Reductions (CCERs) and the entire approval process resembles that of the UN offset mechanism, i.e. CDM, with the NDRC acting as the CDM Executive Board (EB) to approve methodologies and projects registration
as well as host national registry for issued credits. The VER Rules foresee that pilot regions may elect the type of CCERs to be allowed under their ETSs. As to August 2013, most of the pilots have released their ETS implementation plans, which set the overall framework to foster efforts around detailed market design and implementation schedules at a later stage. On the one hand, the ETS implementation plans converge on many design elements; on the other hand, diversities do exist to accommodate regional situations. All pilot regions shall set an absolute emission cap, which constitute 35%-60% of local
CO2 emissions. Although all pilot ETSs
intend to cover energy/carbon intensive sectors, the list of sectors varies greatly among regions. For example, Tianjin ETS concentrates on several energy and industrial sectors while Shenzhen will bring 26 sectors under its scheme given the important role of service industries in this city. It should be noted that public buildings are included in the Beijing and Shenzhen plans and Shanghai states it will bring aviation into its regulatory ETS. Energy use or carbon emission thresholds were set to identify liable emitters with Guangdong ETS tending to cover over 800 entities while the number being only 100 in Tianjin.
All pilot ETSs will only cover CO2 gasses,
at least in the initial stages.
Allowances for individual entities are primarily to be determined based on their emission inventories of previous years. In all pilot regions, most of the permits are to be freely allocated to emitters and auction is considered as a complementary method. Released ETS plans indicate banking is authorized while borrowing is not permitted.
Pa rt 1 : C ar bo n p ric es a nd m ar ke
All pilots allow eligible CCERs offset as a compliance instrument, with upper limits of 5%-15% of overall cap. Most local governments require the majority of eligible CCERs to be generated from projects located within their jurisdictions. Authorities are also considering introducing price regulation mechanisms to avoid negative price fluctuations, including the hold of quota reserves and setting a price ceiling/ floor.
Although most schemes are scheduled to start over the year of 2013, only Shenzhen officially launched its pilot ETS on June 18th. The scheme covers 635 industrial enterprises and 197 public buildings, which account for about 40% of the total emissions of Shenzhen. Allowances of 100 million tonnes of carbon are allocated to the 635 industrial enterprises in the span of 2013-2015. A “Grandfathering” approach is adopted to identify emission quotas for electricity generators and water and gas suppliers. As for manufacturers, carbon emissions of per Unit Industrial Added Value were developed for allowance allocation.
In addition, measurement and verification methodologies were also formulated to quantify emissions from large-scale public buildings in the city. The local government also drew up the MRV guidelines. The Shenzhen Emissions Exchange is entrusted as the emissions trading platform. On the first day of transactions, 8 deals were completed with a total amount
of 21,112 tonnes of CO2e at a price of
28-32 Yuan per tonne (around €3.7). PetroChina and Hanergy Holding Group became the first buyers, purchasing 10,000 tonnes of allowances each.
However, no other transaction was reported until the day of writing. In spite of the announcement of ETS commencement, many key elements have not yet been ready for the full function, including detailed operations rules, registry management, and third-party verification processes. All these are expected to be gradually developed and released in the second half of 2013 and 2014. Nevertheless, the launch of China’s first market for compulsory carbon trading is a landmark step for China in building a nationwide carbon emission trading market.
Notwithstanding significant progress, various obstacles remain and are likely to delay the launch of effective pilot regional ETSs and a national ETS. The core concern is about the feasibility of a pure market-based tool applied in a system with an immature market economy. Price-control systems for the power sector and coordination among government agencies are also hindrances to effective ETS. In addition, extensive capacity building work is also needed for the MRV, including the design of an effective and robust registry system.
As for the national ETS scheme, the implementation of pilots ETS will surely provide the national government with experiences and lessons
to examine the potential development of a national market. Apart from this, the viability of a national scheme is also dependent on progress in international climate negotiations and domestic capacity building. Given the difficulties encountered in establishing ETS trials and current climate negotiation status, a national scheme is not likely to start before 2020.
Some lessons on the design of carbon markets Level of ambition – Environmental Cap
Setting the cap at the dawn of the scheme is a fundamental but thorny issue. The regulator must determine a clear and predictable level of emis-sions to be cut within a given time frame and over a given panel of sources. The trouble is that there is no methodology to set the “right” cap when it comes to a global pollutant. It is all the more so debated given the strin-gency of the cap largely influences the resulting price. The choice of a cap is therefore more political and strategic than it is scientific. Indeed, political decisions aside, many parameters (such as economic forecasts, overlap with other policies, etc) must be factored in to get to the cap, rendering it hard to fathom. As predictability is key to foster long-term investments, the EU ETS and RGGI both have a linear reduction factor applied to the cap. In making an arbitrage between predictability and resiliency, Australia came up with an innovative idea: a 5-year rolling cap, meaning that 5 years worth of caps will be known at all times. Thus, the cap could be annually adjusted for new market overview and context. One last point: as highlighted in the EU ETS, starting with a decentralized process later turning into a centralized one might help the scheme get started.
Form of allocation
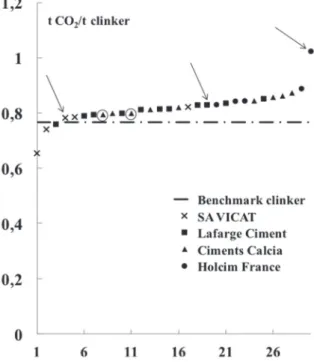
Permits can be distributed for free, which has hitherto been the main-stream method, or through auctions, which has considerably gained momen-tum lately, or by a combination of the two. In the early stages of the EU ETS for example, free allocation has been the dominant way to allocate allowances as it helped garner support for the scheme. Because free allocation implied explicit distributional effects (significant windfall profits, particularly in the power sector) and also created within-sectors differences within the scheme as similar facilities received varying amounts of free allowances depending on the nations they were located in, it was called into question. It was dealt with by replacing free allocation by auctioning as the basic principle of allo-cation. The share of auctioned allowances is to increase over time as some transitional free allocation based on an EU-wide and centralized benchmark-ing approach is still allowed for Emissions-Intensive Trade-Exposed (EITE) sectors, gradually phased out by 2020 for power plants and by 2027 for industrial facilities. The EU ETS case has been inspiring, as many schemes have opted for similar allocation approaches.
MRV Standards
Monitoring, Reporting and Verification (MRV) procedures will not be dis-cussed in detail, as it would require a thorough analysis, which is beyond the aim of our work. However, one can observe a convergence of MRV standards