HAL Id: hal-01136524
https://hal.archives-ouvertes.fr/hal-01136524
Submitted on 27 Mar 2015
HAL is a multi-disciplinary open access
archive for the deposit and dissemination of
sci-entific research documents, whether they are
pub-lished or not. The documents may come from
teaching and research institutions in France or
abroad, or from public or private research centers.
L’archive ouverte pluridisciplinaire HAL, est
destinée au dépôt et à la diffusion de documents
scientifiques de niveau recherche, publiés ou non,
émanant des établissements d’enseignement et de
recherche français ou étrangers, des laboratoires
publics ou privés.
Monitoring the phenology of mediterranean natural
habitats with multispectral sensors: an analysis based on
multiseasonal field spectra
C. Corbane, F. Guttler, S. Alleaume, Dino Ienco, Maguelonne Teisseire
To cite this version:
C. Corbane, F. Guttler, S. Alleaume, Dino Ienco, Maguelonne Teisseire. Monitoring the
phenol-ogy of mediterranean natural habitats with multispectral sensors: an analysis based on
multisea-sonal field spectra.
International Geoscience and Remote Sensing Symposium (IGARSS), 35th
Canadian Symposium on Remote Sensing, CSRS 2014, Jul 2014, Québec, Canada. pp.3934-3937,
�10.1109/IGARSS.2014.6947345�. �hal-01136524�
MONITORING THE PHENOLOGY OF MEDITERRANEAN NATURAL HABITATS WITH
MULTISPECTRAL SENSORS - AN ANALYSIS BASED ON MULTISEASONAL FIELD
SPECTRA
Corbane C., Güttler F., Alleaume S., Ienco D., Teisseire M.
Irtsea, UMR TETIS
ABSTRACT
Due to their high degree of vegetation heterogeneity, fragmentation and biodiversity, Mediterranean natural habitats are difficult to assess and monitor with in-situ observations solely. Together with standardized ground plots and regular in-situ measurements, remote sensing is a powerful monitoring device that can contribute to a better understanding of the diversity of natural and semi-natural habitats and to monitor their phenology. In this paper, we implemented a systematic test of the suitability of multiseasonal remote sensing data for monitoring the phenological variations of natural habitats in a Mediterranean landscape. Six multispectral sensor signals were simulated for comparison based on their spectral response curves and in-situ averaged spectra collected at monthly intervals between February and October 2013 (IKONOS, Landsat 5 TM, Landsat 8, Pléiades, Sentinel-2, and Worldview-2). The simulations and comparisons performed in this test showed that Sentinel-2 sensor has the higher sensitivity to the variations in the coverage of photosynthetic vegetation thus offering interesting perspectives for operational monitoring of natural habitats.
Index Terms— Mediterranean natural habitats,
phenology, field spectra, monitoring, remote sensing
1. INTRODUCTION
Mapping the spatial distribution of natural habitats and monitoring their conservation status are crucial for assessing progress towards the targets of European and international environmental policies (e.g. the European 2020 Biodiversity Strategy [1] and the United Nations’ Convention on Biological Diversity). Due to their high degree of vegetation heterogeneity, fragmentation and biodiversity, Mediterranean natural habitats, are particularly difficult to assess and monitor with in-situ observations solely. Together with standardized ground plots and regular in-situ measurements, remote sensing is a powerful monitoring device that can contribute to a better understanding of the diversity of natural and semi-natural habitats, their spatial distribution, and their conservation status. This has been established by several studies and reported in many review papers [2]–[4]. The description and classification of natural habitats is usually based on vegetation physiognomy and floristic composition. Phenology of natural and semi-natural habitats has been rarely studied because of the difficulty of
acquiring this type of information with conventional field methods. To address this gap, a systematic test of the suitability of multiseasonal data of six multispectral sensors for monitoring the phenological variations of natural habitats in a Mediterranean landscape has been implemented in this study.
2. METHOD
An empirical study was implemented at monthly intervals between February and October 2013 within a protected site, part of Natura 2000 network, located near Montpellier city in Southern France (43°47'48.84'' N 3°45'53.38'' E). Seven permanent plots representing five different types of typical Mediterranean habitats were established for the time of data acquisition: One plot for calcareous grassland, one plot for fallow fields, one plot for humid grasslands, two plots for fens and two plots for maquis. Each of the defined plots consists of a square of 30 x 30 meters. For each plot, data collection transects (2 diagonal and one median) were defined. Along these transects, measures of reflectance were recorded every 2 meters with an ASD FieldSpec spectrometer (spectral range from 350 to 2500 nm). In parallel to the spectroradiometric measurements, visual estimates of the cover fraction of the photosynthetic vegetation were performed at each measure of reflectance. The unaltered ASD spectra (i.e. around 60 measurements per plot) were averaged to one spectrum per date. Six multispectral sensor signals, frequently used for remote sensing of vegetation properties were simulated for comparison based on their spectral response curves and the unaltered averaged spectra (IKONOS, Landsat 5 TM, Landsat 8, Pléiades, Sentinel-2, and Worldview-2). The thermal bands of Landsat 5 TM, Landsat 8 and Sentinel-2 were not considered because they are not covered by the ASD spectrometer.
The simulations were implemented per sensor, plot and date following [5] and using the simulatoR-tool:
𝑠𝑖𝑔𝑛𝑎𝑙!,!! !!"#× ! !"# × !"#!,!
with signali,x the plot-based simulated signal of sensor x in
band i, rad the radiometric resolution in bit, ref the plot-based canopy reflectance measured by the field spectrometer, and srci,x the spectral response curve for band
i of sensor x, Σsrci,x = 1.
The spectral response curves for each sensor were obtained from the operator’s websites or from personal
2014 IEEE International Geoscience and Remote Sensing
Symposium, IGARSS 2014 and the 35th Canadian Symposium
on Remote Sensing, CSRS 2014; Quebec Convention
communication (Sentinel-2). “These curves are used in the simulation to calculate a weighted average of the original reflectance values. This weighted average is subsequently scaled to the respective sensor’s radiometric resolution and converted to integers” [5]. The simulations are based on simplified assumptions that involve the spectral and radiometric resolution of the sensors only without consideration of the influence of other sensors’ characteristics such as: the spatial resolution, sensor geometry, signal-to-noise ratio, as well as atmospheric influences.
Our aim was to analyze the sensitivity of multispectral remote sensing sensors to phenological variations of Mediterranean natural habitats. The ground recorded percentages of photosynthetic vegetation per plot served here as proxies for phenological variations. For each habitat and multispectral sensor the simulated reflectances were regressed against the averaged percentages of photosynthetic vegetation, taking the model fit as a measure of performance. Partial Least Squares Regression was used (PLSR, [6]) for this analysis. PLSR is a well-known regression technique, mostly applied in chemometrics. Its stability property faced to inter-correlated spectral data gives PLSR a clear superiority to canonical correlation analysis, multiple linear regression, ridge regression or other regression techniques. It is a method for relating two data matrices, X (predictor variables) and Y (response variable), by a linear multivariate model. “PLSR constructs a set of orthogonal components that maximize the sample covariance between the response variable and the linear combination of the predictor variables”[7]. These linear combinations are called the latent variables (LV). In the case of this study, the LVs are generated as independent linear combination of spectral bands that aim at the best representation of the dependent response variable. The weight vector that is used to compute the latent variable is called a loading vector. There are as many latent variables as loading vectors.
The optimal number of LV to be included in the PLSR model is commonly chosen with respect to the root mean squared error in cross-validation (RMSECV): the response variable is modeled with increasing numbers of LV and each model is cross-validated. The optimal number of latent variables is typically the number at which the addition of another latent variable does not greatly improve the performance of the model. In addition to the RMSECV, we also used the following statistics to analyze the model performance: the coefficient of determination of cross-validation (R2CV) and the ratio of performance to deviation (RPD, [8])). The RPD value is the relationship between the standard deviation of the averaged percentages of photosynthetic vegetation observed in the field and the standard error of cross-validation.
A global PLSR including all the sensors and per sensor PLSR were performed. For the global PLSR we included all spectral information in the model. This was considered
useful to ease the sensor comparison. All models were validated with full leave-one-out cross-validation. The interpretation was based on the loading values which indicate the relative importance of the respective band for the model.
3. RESULTS
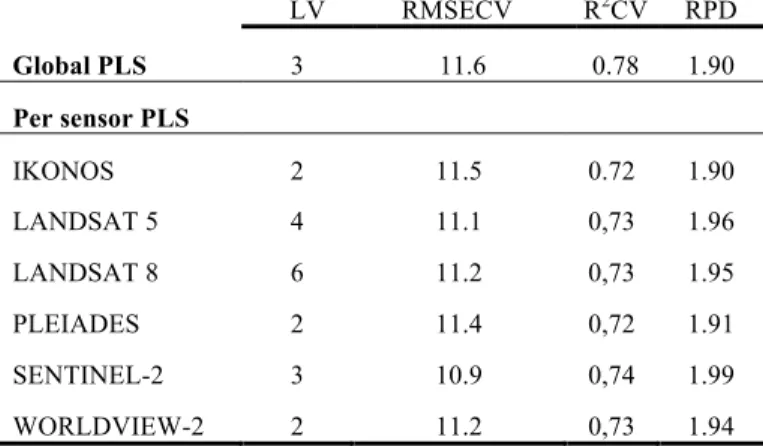
As detailed in table 1, the global PLSR including all the simulated sensors and their bands gave a RMSECV of 11.6 indicating a good degree of precision in the estimates of the percentages of photosynthetic vegetation cover with a good reliability (mean R2CV= 0.78). The RPD of 1.9 was satisfactory according to the criteria of [9]. Figure 1 represents the loading plot of the first three LV. The loadings describe how strongly each LV in the PLSR depends on the original spectral bands and in what direction. Cleary the first two LV of the global PLSR model explain most of the variations in the phenology of the studied habitats (71% and 26% of explained variance for comp1 and comp2 respectively).
Table 1. Statistics of global and per sensor PLS model fits for multi-temporal prediction of the percentages of photosynthetic vegetation cover.
LV RMSECV R2CV RPD Global PLS 3 11.6 0.78 1.90 Per sensor PLS IKONOS 2 11.5 0.72 1.90 LANDSAT 5 4 11.1 0,73 1.96 LANDSAT 8 6 11.2 0,73 1.95 PLEIADES 2 11.4 0,72 1.91 SENTINEL-2 3 10.9 0,74 1.99 WORLDVIEW-2 2 11.2 0,73 1.94
As expected, the NIR regions showed the highest explanatory power of the phenological variations and can hence be assessed satisfactorily with any of the simulated multispectral sensors (loading value of 0.3 for the first LV irrespective of the sensor type). Sensors with SWIR regions (i.e. Landsat 5, Landsat 8 and Sentinel-2) showed consistently high explanatory powers as it can be observed from the high negative loading value of -0.3 for the second LV. However, with 5 bands showing relatively high loading values of more than 0.2, Sentinel-2 sensor seems to show the higher sensitivity to the variations in the coverage of photosynthetic vegetation. This is supported by the results of per sensor PLSR shown in table 1. Up to 6 latent variables (in the case of Landsat 8) were used in the
regression. All of the six tested sensors are sensitive to phenological variations of the natural habitats but, with a R2CV of 0.74 and a RPD of 1.99, Sentinel-2 shows a
slightly better performance than the other sensors.
4. CONCLUSION
The simulations and comparisons performed in this test are based on simplified assumptions that merely involved the spectral and radiometric resolutions of the sensors. Other sensor characteristics such as the spatial and temporal resolutions and signal-to-noise ratio were not considered. Hence any inference towards the suitability of a certain sensor must be done with caution. Given its spectral coverage and its high temporal resolution, the upcoming Sentinel-2 will definitely enhance the capabilities for operational monitoring of natural habitats. However, given that Mediterranean landscapes habitats are highly fragmented with a mosaic of natural habitats, the spatial resolution of Sentinel-2 may be too coarse to address the spectral differences between vegetation patterns. Further research addressing other sensor characteristics is needed for completing this analysis.
5. REFERENCES
[1] European Commission DG Environment, “Interpretation Manual of European Union Habitats,” European Commission, DG Environment, Brussels, 2007.
[2] J. Vanden Borre, D. Paelinckx, C. A. Mücher, L. Kooistra, B. Haest, G. De Blust, and A. M. Schmidt, “Integrating remote sensing in Natura 2000 habitat monitoring: Prospects on the way forward,” Journal for Nature Conservation, vol. 19, no. 2, pp. 116–125, mai 2011.
[3] H. Nagendra, R. Lucas, J. P. Honrado, R. H. G. Jongman, C. Tarantino, M. Adamo, and P. Mairota, “Remote sensing for conservation monitoring: Assessing protected areas, habitat extent, habitat condition, species diversity, and threats,”
Ecological Indicators, vol. 33, no. 0, pp. 45 – 59, 2013.
[4] D. Rocchini, N. Balkenhol, G. A. Carter, G. M. Foody, T. W. Gillespie, K. S. He, S. Kark, N. Levin, K. Lucas, M. Luoto, H. Nagendra, J. Oldeland, C. Ricotta, J. Southworth, and M. Neteler, “Remotely sensed spectral heterogeneity as a proxy of species diversity: Recent advances and open challenges,”
Ecological Informatics, vol. 5, no. 5, pp. 318–329, Sep. 2010.
[5] H. Feilhauer, F. Thonfeld, U. Faude, K. S. He, D. Rocchini, and S. Schmidtlein, “Assessing floristic composition with multispectral sensors—A comparison based on monotemporal and multiseasonal field spectra,” International
Journal of Applied Earth Observation and Geoinformation,
vol. 21, pp. 218–229, avril 2013.
[6] S. Wold, M. Sjöström, and L. Eriksson, “PLS-regression: a basic tool of chemometrics,” Chemometrics and Intelligent
Laboratory Systems, vol. 58, no. 2, pp. 109–130, Oct. 2001.
[7] K.-A. Lê Cao, S. Boitard, and P. Besse, “Sparse PLS discriminant analysis: biologically relevant feature selection and graphical displays for multiclass problems,” BMC
Bioinformatics, vol. 12, no. 1, p. 253, 2011.
[8] C.-W. Chang, D. A. Laird, M. J. Mausbach, and C. R. Hurburgh, “Near-Infrared Reflectance Spectroscopy– Principal Components Regression Analyses of Soil Properties,” Soil Science Society of America Journal, vol. 65, no. 2, p. 480, 2001.
[9] P. C. Williams, “Implementation of near-infrared technology,” in Near-infrared technology in the agriculture
and food industries, 2nd ed., P. Williams and K. Norris, Eds.
2004, pp. 145–169.
Figure 1. Global PLS loadings for the first three latent variables (LV). The LV are the linear combinations of the original spectral bands that aim at the best representation of the response variable. The loadings describe how strongly each LV in the PLSR depends on the original spectral bands and in what direction. Note that the spectral bands of Sentinel-2 sensors are labeled here by the band centers (nm).