HAL Id: hal-01885648
https://hal.archives-ouvertes.fr/hal-01885648
Submitted on 20 Mar 2019
HAL is a multi-disciplinary open access
archive for the deposit and dissemination of
sci-entific research documents, whether they are
pub-lished or not. The documents may come from
teaching and research institutions in France or
abroad, or from public or private research centers.
L’archive ouverte pluridisciplinaire HAL, est
destinée au dépôt et à la diffusion de documents
scientifiques de niveau recherche, publiés ou non,
émanant des établissements d’enseignement et de
recherche français ou étrangers, des laboratoires
publics ou privés.
Y145Stop Prion Protein Amyloid Probed by Relaxation
Dispersion NMR
Matthew Shannon, Theint Theint, Dwaipayan Mukhopadhyay, Krystyna
Surewicz, Witold Surewicz, Dominique Marion, Paul Schanda, Christopher
Jaroniec
To cite this version:
Matthew Shannon, Theint Theint, Dwaipayan Mukhopadhyay, Krystyna Surewicz, Witold Surewicz,
et al.. Conformational Dynamics in the Core of Human Y145Stop Prion Protein Amyloid Probed by
Relaxation Dispersion NMR. ChemPhysChem, Wiley-VCH Verlag, 2019, BioNMR Spectroscopy, 20
(2), pp.311-317. �10.1002/cphc.201800779�. �hal-01885648�
Conformational Dynamics in the Core of Human Y145Stop Prion
Protein Amyloid Probed by Relaxation Dispersion NMR
Matthew D. Shannon,
[a]Theint Theint,
[a]Dwaipayan Mukhopadhyay,
[a]Krystyna Surewicz,
[b]Witold K.
Surewicz,
[b]Dominique Marion,
[c]Paul Schanda
[c]and Christopher P. Jaroniec*
[a] Microsecond to millisecond timescale backbone dynamics of theamyloid core residues in Y145Stop human prion protein (PrP) fibrils were investigated by using 15N rotating frame (R
1r)
relaxation dispersion solid-state nuclear magnetic resonance spectroscopy over a wide range of spin-lock fields. Numerical simulations enabled the experimental relaxation dispersion profiles for most of the fibril core residues to be modelled by using a two-state exchange process with a common exchange rate of 1,000 s-1, corresponding to protein backbone motion on the
timescale of 1 ms, and an excited-state population of 2%. We also found that the relaxation dispersion profiles for several amino acids positioned near the edges of the most structured regions of the amyloid core were better modelled by assuming somewhat higher excited-state populations (~5-15%) and faster exchange rate constants, corresponding to protein backbone motions on the timescale of ~100-300 µs. The slow backbone dynamics of the core residues were evaluated in the context of the structural model of human Y145Stop PrP amyloid.
1. Introduction
Transmissible spongiform encephalopathies, a family of fatal neurodegenerative conditions that includes Creutzfeld-Jakob disease in humans and ‘mad cow’ disease, involve the conformational rearrangement of an a-helical brain prion protein from its native cellular form (PrPC) to a pathogenic misfolded
amyloid-like form (PrPSc).[1-2] Although not currently understood at
the atomistic level, the three-dimensional structures adopted by the PrPSc aggregates appear to be intimately linked to prion
toxicity and ease of disease transmission.[3-5]
The C-terminally truncated human Y145Stop prion protein variant (huPrP23-144), which is associated with a hereditary PrP cerebral amyloidosis,[6] has previously been shown to display in
vitro the key features of mammalian prion propagation including
strain variability and cross-seeding barriers.[7] Remarkably,
mouse PrP23-144 amyloid generated from recombinant protein has also recently been found to trigger transmissible prion disease in mice.[8] To gain atomic level structural insights into
PrP23-144 amyloid propagation we have carried out a series of
solid-state nuclear magnetic resonance (NMR) studies for a set of homologous recombinant proteins corresponding to the human, mouse and Syrian hamster amino acid sequences as well as related mutants.[9-15] These studies concluded that huPrP23-144
fibrils consist of two protofilaments, where each protofilament contains a structured compact core region of ~30 amino acids (aa) spanning residues ~112-141 with parallel in-register b-sheet architecture and a large dynamically disordered ~90-residue N-terminal tail domain.
Interestingly, these experiments also revealed considerable variations in the NMR spectral intensities suggestive of the presence of conformational dynamics for multiple core residues, with the backbone signals for residues Y128 and M129 located in a flexible loop segment roughly in the middle of the core region not detectable at all in conventional solid-state NMR spectra recorded at temperatures exceeding approximately -20 oC.[9-10]
Additional experiments designed to probe the backbone one-bond 15N-1HN, 13Ca-1Ha and 15N-13CO/13Ca dipolar couplings
revealed uniformly high dipolar order parameters (S ~ 0.9-1) for all the amyloid core residues consistent with the presence of only small-amplitude motions of the different bond vectors around their equilibrium positions on the sub-µs timescale. In contrast, considerable variations in transverse spin relaxation rates were observed for the backbone 1H, 13C and 15N nuclei, suggestive of
the presence of slower motions, on the timescale of ~0.1-1 ms, for the core residues.[10] A more detailed analysis of these slower
motions could not be performed, however, since the initial experiments were conducted on fully protonated fibril samples at moderate (~10 kHz) magic angle spinning (MAS) rates, where considerable residual 1H-1H dipolar couplings contribute
significantly to the decay of spin coherences, masking the dynamics-induced relaxation.
Recent advances in solid-state NMR methodology, including the availability of fast MAS probes combined with protein deuteration and proton spin dilution as well as proton detection for enhanced sensitivity,[16-22] have enabled the detailed investigation
of backbone dynamics for a variety of proteins and protein assemblies in the solid phase over a wide range of timescales [23-29] including the slow µs-ms motions that are of interest for
huPrP23-144 amyloid fibrils in the present study. Of particular utility in the context of characterizing these µs-ms motions in a residue-specific manner are multidimensional rotating frame (R1r)
relaxation dispersion (RD) experiments[29-34] for amide 15N nuclei
as a function of the spin-lock radiofrequency (RF) field strength spanning both the low-field (or Bloch-McConnell) regime[31] and
the near rotary resonance (nRF ≈ nMAS)[30-31] regime, where both 15N-1H dipolar couplings and 15N chemical shift anisotropy are
effectively recoupled under MAS.[35] In the Bloch-McConnell
regime, these RD experiments provide information about the modulation of isotropic 15N chemical shifts due to the µs-ms
protein backbone dynamics, while the near rotary resonance RD [a] Matthew Shannon, Theint Theint, Dwaipayan Mukhopadhyay,
Christopher P. Jaroniec
Department of Chemistry and Biochemistry, The Ohio State University, Columbus, Ohio, 43210, United States E-mail: jaroniec.1@osu.edu
[b] Krystyna Surewicz, Witold K. Surewicz
Department of Physiology and Biophysics, Case Western Reserve University, Cleveland, Ohio, 44106, United States
[c] Dominique Marion, Paul Schanda
Institut de Biologie Structurale (IBS), 38027 Grenoble, France Supporting Information for this article is given via a link at the end of the document.
(NERRD) measurements report on the angular fluctuations of the
15N-1HN bond vectors on this timescale.
Here we employ the above 15N RD experiments to
investigate, in residue-specific fashion, the µs-ms timescale motions in the amyloid b-core of huPrP23-144 fibrils. Analysis of these data is used to extract the key motional parameters including the exchange rate, the minor conformer population and the amplitude of angular motions.
2. Results and Discussion
All experiments were performed using huPrP23-144 amyloid fibrils generated from uniformly 2H,13C,15N-labeled
protein that was back-exchanged in a 1:1 mixture of H2O and D2O
as described in the Experimental Section. The resulting 50% 1H
incorporation at the exchangeable amide proton sites in combination with rapid sample spinning at 40 kHz frequency, provides sufficient suppression of residual 1H-1H dipolar couplings
to enable quantitative measurements of residue-specific 15N R 1r
rate constants for a broad range of spin-lock fields with high-resolution and sensitivity by using 1H detection.
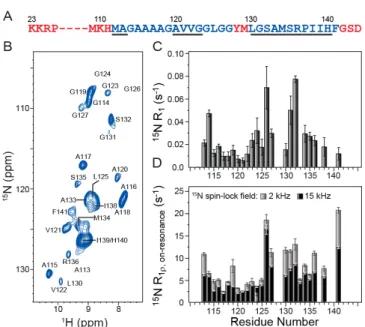
The 2D 15N-1H cross-polarization spectrum shown in Figure
1B shows that the vast majority of the cross-peaks for individual residues are well-resolved, with typical 1H linewidths of ~0.1-0.15
ppm indicative of high degree of sample homogeneity and effective suppression of homonuclear 1H-1H dipolar couplings.
The assignments of the 15N-1H correlations in this spectrum could
be readily performed by recording a pair of 3D hCANH and hCONH spectra[36] (Supporting Information (SI) Figure S1) and
taking advantage of the previously reported 15N, 13Ca and 13CO
chemical shift assignments.[9]
To rapidly assess the extent of microsecond timescale motions for the huPrP23-144 amyloid core residues, we measured the residue-specific 15N R
1r rate constants for 15N
spin-lock fields of 2 and 15 kHz using the pulse sequence shown in SI Figure S2A. Additionally, in order to account for off-resonance effects in the 15N R
1r experiments (see Experimental Section), 15N
longitudinal relaxation (R1) rate constants were determined using
the pulse sequence shown in SI Figure S2B. The residue-specific
15N R
1 and 15N R1r, on-resonance values are shown in Figure 1C and
1D, respectively. These data indicate that both the 15N R
1 and 15N
R1r rate constants are generally smallest for the least
solvent-exposed hydrophobic core residues (aa ~115-125),[15] while larger
relaxation rate constants are observed for most of the remaining residues, particularly those located near the N- and C-terminal edges of the amyloid core region and bracketing the flexible region (aa ~127-130) within the core. Importantly, the 15N R
1r
values for many of the core residues recorded with the 2 kHz spin-lock field were found to be considerably larger than the corresponding values recorded with the 15 kHz field (on average the 15N R
1r, on-resonance values were ~8 s-1 and ~5.5 s-1 for the 2 kHz
and 15 kHz spin-lock fields, respectively). This residue-specific relaxation dispersion is strongly indicative of the presence of slow protein backbone motions throughout the huPrP23-144 amyloid core. It is also quite remarkable that, relative to one another, the residue-specific 15N transverse relaxation (R
2) rate constants
obtained for the fully protonated huPrP23-144 amyloid in our earlier work[10] are in reasonable qualitative agreement with the
Figure 1. (A) Amino acid sequence of huPrP23-144, with the most rigid amyloid
core residues shown in blue font. The dynamically disordered N- and C-terminal residues and two flexible residues located within the core region, which are not detectable in conventional solid-state NMR experiments, are shown in red font. Regions with the highest b-strand propensity predicted by TALOS-N[37] based
on backbone 13C and 15N chemical shifts are underlined. (B) 2D 15N-1H chemical
shift correlation spectrum of amyloid fibrils generated from 2H,13C,15N-labeled
huPrP23-144 back-exchanged in a 1:1 mixture of H2O and D2O. The spectrum
was recorded in 2 h at 800 MHz 1H frequency, 40 kHz MAS rate, and sample
temperature of ~10 oC. Due to large variations in resonance intensities, for
clarity the cross-peaks are drawn with the lowest contour at 75 times the rms noise level. The locations of cross-peaks for residues A113, G124, G126, and L130, for which the signal-to-noise is below this threshold, are indicated. (C) Residue-specific 15N R1 values determined using the pulse sequence shown in
SI Figure S2B. (D) Residue-specific 15N R1r values determined using the pulse
sequence shown in SI Figure S2A with 15N spin-lock fields of 2 kHz or 15 kHz
as indicated.
15N R
1r values determined in the present study. Note, however,
that the former R2 rate constants were a factor of ~10-20 larger
due to the incomplete averaging of 1H-1H dipolar couplings, while
the current R1r data are largely free of deleterious dipolar
dephasing effects.
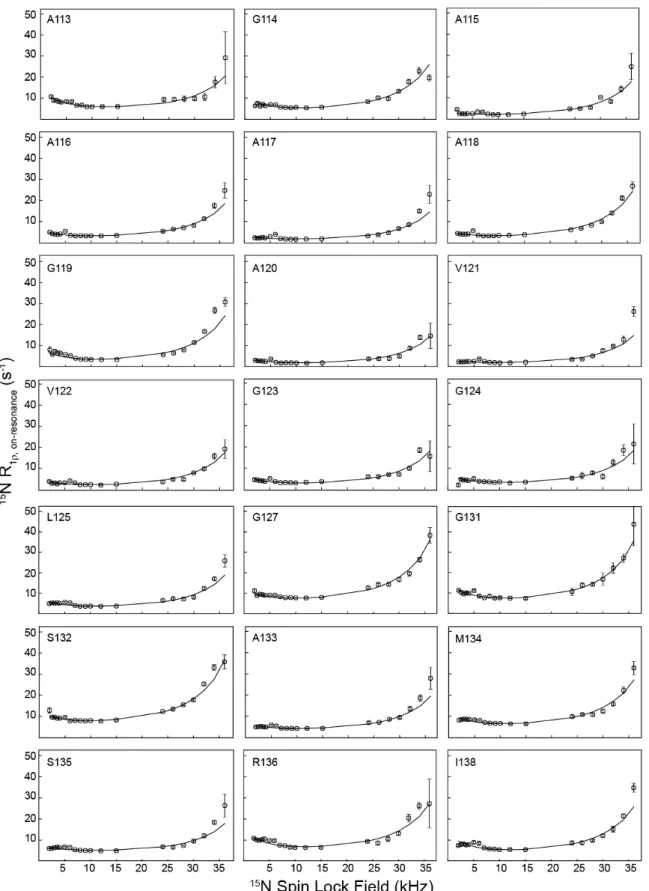
Having established the existence of slow protein motions in the core of huPrP23-144 fibrils, in order to gain a more comprehensive insight into these motions we recorded complete residue-specific 15N R
1r RD profiles at 40 kHz MAS rate spanning
the Bloch-McConnell (2-15 kHz 15N spin-lock field) and near n =
1 rotary resonance (24-36 kHz 15N spin-lock field) regimes. Figure
2 shows these complete RD profiles for most of the huPrP23-144 amyloid core residues, with representative relaxation trajectories for individual residues at different spin-lock fields shown in SI Figures S3 and S4. Overall, the experimental data are of high quality owing to the use of 1H detection, with relatively small
uncertainties in the 15N R
1r values extracted for different spin-lock
fields. Inspection of the experimental data in the 2-15 kHz spin-lock field regime reveals prominent 15N R
1r RD effects for some
of the residues (e.g., A113, L130 and F141) but rather subtle ones for most others, especially the hydrophobic core aa ~115-125, making it difficult to extract accurate motional parameters from
Figure 2. Residue-specific 15N R1rRD profiles for huPrP23-144 amyloid fibrils at 800 MHz 1H frequency. Experimental data are shown as open circles, and numerical
fits used to extract the global exchange rate and minor excited-state population, as well as site-specific parameters Dw and a (c.f., Figure 3) are shown as solid lines. RD profiles for residues G126, L130, and F141, which were not fit as well by the global exchange model, are shown in SI Figure S5 along with individual residue-specific fits. RD profiles for residues I139 and H140 could not be obtained due to insufficient resolution in the 2D 15N-1H spectrum.
residues display considerable broadening of the n = 1 rotary resonance condition as the 15N spin-lock field is increased from
24 to 36 kHz, due to reorientation of the amide 15N CSA and 15 N-1H dipolar coupling tensors, suggestive of the presence of µs-ms
timescale motions throughout the sequence.[31]
To gain more quantitative insight into the huPrP23-144 amyloid backbone dynamics we performed a multi-parameter numerical fit of the 15N R
1r data for the entire range of spin-lock
fields investigated. Briefly, numerical simulations of 15N R 1r
relaxation in the presence of a dynamic two-state model were used to generate in silico RD profiles as a function of the exchange rate constant (kex), population of the minor,
excited-state conformer (pB), and residue-specific chemical shift
difference (Dw) and angular amplitude (a) parameters. A grid search of these computed RD profiles was then performed to identify the best-fits to residue-specific experimental RD data (see Experimental Section). While fits of particularly high quality could be obtained by modeling the 15N R
1r RD profiles for individual
residues one-by-one with completely independent values of kex
and pB (in addition to the residue-specific Dw and a parameters),
we instead opted for a simpler, more physically-relevant motional model where RD profiles for all residues are fit simultaneously to a single, global excited-state population and exchange rate. This treatment of the data yielded best-fit kex and pB parameters of
1,000 s-1 and 2%, respectively, with reasonable quality fits for the
vast majority of the residues as seen in Figure 2 (i.e., for these residues the improvement in c2 between experimental and
calculated RD profiles obtained via independent fitting vs. by using the global exchange model was statistically insignificant). Note that the exchange rate of 1,000 s-1 obtained by the global
fitting of the complete RD profiles for all huPrP23-144 residues is considerably lower than the lowest spin-lock field (2 kHz) that was practically attainable in our experiments, due to coherent contributions to R1r that can become dominant at sufficiently low
spin-lock field amplitudes.[38] Given that the largest modulations
of 15N R
1r in the low-field Bloch-McConnell regime are expected
for exchange rates that are on the order of the spin-lock field, this provides a rationale for why relatively small RD effects were observed for many residues in the 2-15 kHz regime and also underscores the importance of utilizing RD data over a wide range of spin-lock fields spanning both the Bloch-McConnell and near rotary resonance regimes in order to reliably identify protein backbone motions occurring on the ~ms timescale.
Figures 3A and 3B, respectively, show plots of the Dw and a values as a function of residue number extracted from the global fit of the 15N R
1r RD profiles with kex = 1,000 s-1 and pB = 2%. As
noted above, these parameters report on the structural differences between the major and minor states undergoing exchange via the isotropic 15N chemical shift difference (Dw) and
the angle between the 15N-1H bond vectors (a) in the two states.
While both of these parameters display some scatter for individual residues, we note that most of the hydrophobic amino acids (aa ~115-125) tend to have the smallest Dw (~3 ppm or less), while Dw exceeds ~3.5-4 ppm for many of the remaining residues. These trends in Dw show a reasonable correlation with the extracted residue-specific a values, where most residues in the region ~115-125 have a in the ~10-15o range while most other
residues appear to have larger angular fluctuations (a ~ 15-25o).
Figure 3. Plots of residue-specific (A) Dw and (B) a values extracted from the global fit of 15N R1r RD profiles for huPrP23-144 amyloid with k
ex = 1,000 s-1 and
pB = 2%. (C) Schematic structural model of the huPrP23-144 fibril with
approximate locations of several amino acid residues indicated by red spheres. Altogether, these results imply that the most restricted millisecond timescale motions occur for the most solvent-protected residues ~115-125 found in the hydrophobic core of the fibril[15] (Figure 3C),
while the more solvent-exposed residues located at the edges of the amyloid core, the C-terminal b-strand and the adjacent partly flexible loop exhibit larger amplitude dynamics on this timescale. Finally, we note that for three residues (G126, L130 and F141) the comparison of c2 values for individual fits versus the global fit
using an F-test revealed a statistically significant improvement with the individual fits. The global and individual fits as well as the
fit parameters for these residues are shown in SI Figure S5. While the values of Dw and a obtained with both fits were comparable overall, the individual residue fits yielded considerably higher minor state populations (pB ~ 5-15%) and exchange rates (kex ~
3,000-7,500 s-1) relative to the global fit. Given that all three
residues are located near the most flexible regions of the huPrP23-144 amyloid core, including the C-terminus (F141) and loop preceding the C-terminal b-strand (G126 and L130) it is feasible that these amino acids are associated with somewhat faster backbone motions (on a timescale of hundreds of microseconds) and elevated excited state populations compared to the remaining amyloid core residues.
3. Concluding Remarks
In summary, we have carried out a detailed analysis of slow protein backbone motions in the b-core of huPrP23-144 amyloid fibrils by using solid-state NMR 15N R
1r RD measurements over a
wide range of spin-lock fields. The residue-specific RD profiles spanning both the Bloch-McConnell and near rotary resonance regimes could be modelled for most of the amyloid core residues by assuming a common exchange rate of 1,000 s-1,
corresponding to protein backbone dynamics on the timescale of 1 ms, and a 2% excited-state population. Additionally, several residues located near the edges of the most structured segments of the huPrP23-144 fibril core, including G126, L130, and F141, were found to exhibit somewhat faster exchange, corresponding to backbone motions on the timescale of ~100-300 µs, and higher excited-state populations on the order of 5-15%.
While it remains unclear whether the slow µs-ms timescale motions occurring for residues located throughout the huPrP23-144 fibril core have any biological consequence, taken together with earlier reports of extensive motions on multiple timescales for other protein fibrils,[27] our findings further underscore the notion
that, in spite of their ordered nature, amyloids can be highly dynamic entities. The presence of these µs-ms protein backbone dynamics in huPrP23-144 amyloid is also consistent with our earlier observation of significant amide hydrogen-deuterium exchange taking place for many residues within the parallel-in-register b-sheet regions on timescales as short as several hours.[15] One hypothesis is that these slow backbone motions in
huPrP23-144 amyloid originate in the partly flexible loop region (aa ~126-129) as well as the N- and C-terminal amyloid core edges around residues 112 and 141, respectively, and propagate into the more structured regions of the b-core. This hypothesis is further supported by the finding that the solvent-exposed residues appear to undergo somewhat larger amplitude motions relative to the more solvent-protected hydrophobic residues located in the interior of the fibril.
4. Experimental Section
4.1 Sample Preparation
Overexpression of uniformly 2H, 13C, 15N-labeled
huPrP23-144 using M9 minimal media containing 2H,13C-glucose (2 g/L)
and 15N-ammonium chloride (1 g/L) in D2O and protein purification
were carried out as described previously.[13] The purified
lyophilized protein was dissolved in excess 1:1 H2O:D2O mixture
at a concentration of 60 µM and incubated at room temperature
for 1 h. The completeness of the amide hydrogen-deuterium exchange was quantified by comparing 1D 1H NMR spectra for
the 50% back-exchanged huPrP23-144 sample and a fully protonated reference sample of identical concentration. The protein solution was then concentrated to 400 µM using a 3 kDa molecular weight cutoff Amicon centrifugal filter device, and amyloid fibril formation was initiated by adding potassium phosphate pH 6.4 buffer in 1:1 H2O:D2O to a final concentration
of 50 mM. Fibrils were routinely characterized using atomic force microscopy to confirm sample homogeneity,[13] washed with two
aliquots of 50 mM potassium phosphate pH 6.4 buffer in 1:1 H2O:D2O, and centrifuged directly into a 1.9 mm Bruker zirconia
rotor. The rotor was sealed using slow-setting epoxy glue to prevent potential sample dehydration during the experiments.
4.2 NMR Spectroscopy
Solid-state NMR studies were performed on an 800 MHz Bruker Avance III HD spectrometer equipped with a 1.9 mm 1 H-13C-15N MAS probe. The MAS rate was set to 40 kHz, the effective
sample temperature was maintained at ~10°C, and all experiments utilized low-power pulse sequences and 1H detection
for optimal sensitivity.
To establish the resonance assignments in 2D 15N-1H
spectra, which served as the basis for residue-specific 15N spin
relaxation measurements described below, 3D hCONH and hCANH spectra were recorded using the pulse sequences of Pintacuda and co-workers[36] and analyzed in combination with
available 15N, 13Ca and 13CO chemical shifts.[9] Briefly, for
magnetization transfer these experiments employed 1H-13C’/13Ca
cross-polarization (CP) with 4 ms duration and a linear ramp on the 1H channel, 13C’/13Ca-15N double-quantum SPECIFIC CP[39]
with 15N and 13C field strengths of ~30 kHz and ~10 kHz,
respectively, and a tangent ramp on the 13C channel, and 15N-1H
CP with 0.6 ms duration and a linear ramp on the 1H channel.
Water suppression was achieved immediately prior to the 15N-1H
CP by using a series of long 1H pulses with xy-phase
alternation,[40] ~18 kHz field strength and total duration of 300 ms.
The indirect 15N and 13C’/13Ca dimensions utilized 5 ms of
evolution with XiX 1H decoupling.[41] Additionally, during 13C’/13Ca
evolution the one-bond 13C’-13Ca J-couplings were suppressed by
using a frequency-selective rSNOB pulse[42] with 250 µs duration
applied at the 13C’ or 13Ca frequency as appropriate, and in both
the 13C’/13Ca and 15N dimensions the 13C-15N J-evolution was
suppressed by applying a 180o pulse on the 15N and 13C,
respectively. The direct dimension consisted of 30 ms of 1H
evolution with WALTZ-16 15N decoupling.[43]
The residue-specific 15N R
1r relaxation rate constants were
determined in a pseudo-3D manner by using the pulse scheme in Figure S2A, with 14 ms of 15N evolution in the indirect dimension
and most of the remaining key parameters identical to those noted above for the 3D hCONH and hCANH experiments. The experiments employed 15N spin-lock fields ranging from 2 to 36
kHz, with the RF field amplitudes calibrated as described previously.[31] For 15N spin-lock field strengths up to 15 kHz, a
series of 15N-1H correlation spectra was recorded for spin-lock
durations of 1, 5, 25, 50, 75, 100, 125 and 150 ms. For spin-lock field strengths between 24 and 36 kHz durations of 1, 2.5, 5, 10, 20 and 30 ms were used (note that the 30 ms spin-lock duration was omitted for the highest, 36 kHz, 15N field strength to stay
utilized). Additionally, in order to correct for off-resonance effects in the 15N R
1r measurements, the residue-specific 15N R1 were
determined using the pulse scheme in Figure S2B with relaxation delays of 0.00001, 1, 3 and 5 s.
4.3 Data Analysis
All NMR data were processed using NMRPipe.[44]
Resonance assignments were established by analyzing the spectra in SPARKY,[45] and nmrglue[46] was used to extract the
peak volumes in the series of 2D 15N-1H spectra and perform data
fitting to decaying single exponentials in order to obtain the residue-specific 15N R
1r and 15N R1 rate constants. The
“on-resonance” 15N R
1r values, corrected for off-resonance effects,
were then calculated according to the following equation: R 1r,on-resonance = R1r/sin2 q - R1/tan2 q, where q = arctan(w1/W) with w1 and
W being the spin-lock field strength and resonance offset, respectively.
Numerical simulations of the residue-specific 15N R 1r RD
profiles in the entire 2 to 36 kHz range of spin-lock fields were performed using in-house programs within the GAMMA simulation library[47] akin to previously described work.[48] A
two-spin (1H-15N) system was generated in Liouville space and
duplicated for the two exchanging states, connected by the exchange rate constants. The evolution of spin coherence under the 15N spin-lock RF field of varying strength was simulated by a
stepwise time integration of the Liouville-von Neumann equation with standard powder averaging. The 15N R
1r values were
obtained by a numerical fit of the obtained coherence decay profiles, assuming a mono-exponential decay. While in general relaxation decays in spinning solids are not mono-exponential,[34, 49] the data analysis scheme employed here, where both
experimental and simulated data are treated identically and fitted to mono-exponential functions, nevertheless allows for quantitative comparison.
The above simulations of 15N R
1r as a function of 15N
spin-lock field strength were repeated on a 4D grid by systematically varying the following parameters: (1) the population of the minor excited state (pB), (2) the exchange rate between the states (kex),
(3) the 15N chemical shift difference between the exchanging
states (Dw) and (4) the angular change of the 1H-15N dipolar and 15N CSA tensors between the exchanging states (a; for a
graphical representation see Fig. 17 of ref. [49]). Note that the
simulated R1r profiles exhibit – on top of the exponential decay –
periodic oscillations due to dipolar recoupling, which become quite significant especially near the n = 1 rotary resonance condition. This has also been noted in earlier studies,[34] and is
experimentally not observed here because the distribution of RF fields in the coil dampens this effect.[34] No attempt to account for
the inhomogeneity of the spin-lock RF field was attempted in our simulations due to the heavycomputational load that would be required for such calculations. For comparison with experimental R1r profiles, a vertical offset in R1r, which accounts for relaxation
from other sources than the two-site exchange model, was also included, and the best-fit to the experimental data was obtained via a systematic grid-search on the basis of the c2 value. As noted
in the Results and Discussion section, simulations of the experimental 15N R
1r RD profiles were performed both by using
independent pB and kex values for each residue and by assuming
improvement in fit quality obtained by independently fitting the data for individual residues was statistically significant, an F-test was used to compare the residue-specific c2 values obtained with
the global vs. independent fitting procedure.
Acknowledgements
The research was supported by the National Institutes of Health (grants R01GM094357, R01GM118664, R01GM123743 and S100D012303 to C.P.J. and P01AI106705 and R01NS083687 to W.K.S.), the Camille & Henry Dreyfus Foundation (Camille Dreyfus Teacher-Scholar Award to C.P.J.), and the European Research Council (ERC-Stg-2012-311318-Prot-Dyn2Function to P.S.). The authors thank Dr. Alexey Krushelnitsky (Martin-Luther-Universität Halle-Wittenberg) for stimulating discussions.
Keywords: Protein Dynamics • Amyloids • Prions • Relaxation Dispersion • Solid-state NMR Spectroscopy
[1] S. B. Prusiner, Proc. Natl. Acad. Sci. USA 1998, 95, 13363-13383.
[2] A. Aguzzi, M. Polymenidou, Cell 2004, 116, 313-327. [3] J. Collinge, A. R. Clarke, Science 2007, 318, 930-936. [4] A. Aguzzi, C. Sigurdson, M. Heikenwaelder, Annu. Rev.
Pathol. 2008, 3, 11-40.
[5] J. G. Safar, X. Xiao, M. E. Kabir, S. Chen, C. Kim, T. Haldiman, Y. Cohen, W. Chen, M. L. Cohen, W. K. Surewicz, PLoS Pathog. 2015, 11, e1004832.
[6] B. Ghetti, P. Piccardo, M. G. Spillantini, Y. Ichimiya, M. Porro, F. Perini, T. Kitamoto, J. Tateishi, C. Seiler, B. Frangione, O. Bugiani, G. Giaccone, F. Prelli, M. Goedert, S. R. Dlouhy, F. Tagliavini, Proc. Natl. Acad. Sci. USA 1996,
93, 744-748.
[7] W. K. Surewicz, E. M. Jones, A. C. Apetri, Acc. Chem. Res. 2006, 39, 654-662.
[8] J. K. Choi, I. Cali, K. Surewicz, Q. Kong, P. Gambetti, W. K. Surewicz, Proc. Natl. Acad. Sci. USA 2016, 113, 13851-13856.
[9] J. J. Helmus, K. Surewicz, P. S. Nadaud, W. K. Surewicz, C. P. Jaroniec, Proc. Natl. Acad. Sci. USA 2008, 105, 6284-6289.
[10] J. J. Helmus, K. Surewicz, W. K. Surewicz, C. P. Jaroniec,
J. Am. Chem. Soc. 2010, 132, 2393-2403.
[11] J. J. Helmus, K. Surewicz, M. I. Apostol, W. K. Surewicz, C. P. Jaroniec, J. Am. Chem. Soc. 2011, 133, 13934-13937. [12] E. M. Jones, B. Wu, K. Surewicz, P. S. Nadaud, J. J.
Helmus, S. Chen, C. P. Jaroniec, W. K. Surewicz, J. Biol.
Chem. 2011, 286, 42777-42784.
[13] T. Theint, P. S. Nadaud, K. Surewicz, W. K. Surewicz, C. P. Jaroniec, Biomol. NMR Assign. 2017, 11, 75-80.
[14] T. Theint, P. S. Nadaud, D. Aucoin, J. J. Helmus, S. P. Pondaven, K. Surewicz, W. K. Surewicz, C. P. Jaroniec, Nat.
Commun. 2017, 8, 753.
[15] D. Aucoin, Y. Xia, T. Theint, P. S. Nadaud, K. Surewicz, W. K. Surewicz, C. P. Jaroniec, J. Struct. Biol. 2018, doi:
https://doi.org/10.1016/j.jsb.2018.1004.1002.
[16] E. K. Paulson, C. R. Morcombe, V. Gaponenko, B. Dancheck, R. A. Byrd, K. W. Zilm, J. Am. Chem. Soc. 2003,
125, 15831-15836.
[17] V. Chevelkov, K. Rehbein, A. Diehl, B. Reif, Angew. Chem.
[18] D. H. Zhou, J. J. Shea, A. J. Nieuwkoop, W. T. Franks, B. J. Wylie, C. Mullen, D. Sandoz, C. M. Rienstra, Angew. Chem.
Int. Ed. 2007, 46, 8380-8383.
[19] R. Linser, U. Fink, B. Reif, J. Magn. Reson. 2008, 193, 89-93.
[20] P. Schanda, M. Huber, R. Verel, M. Ernst, B. H. Meier,
Angew. Chem. Int. Ed. 2009, 48, 9322-9325.
[21] M. J. Knight, A. L. Webber, A. J. Pell, P. Guerry, E. Barbet-Massin, I. Bertini, I. C. Felli, L. Gonnelli, R. Pierattelli, L. Emsley, A. Lesage, T. Herrmann, G. Pintacuda, Angew.
Chem. Int. Ed. 2011, 50, 11697-11701.
[22] D. Mance, T. Sinnige, M. Kaplan, S. Narasimhan, M. Daniels, K. Houben, M. Baldus, M. Weingarth, Angew.
Chem. Int. Ed. 2015, 54, 15799-15803.
[23] V. Chevelkov, Y. Xue, R. Linser, N. R. Skrynnikov, B. Reif,
J. Am. Chem. Soc. 2010, 132, 5015-5017.
[24] M. J. Knight, A. J. Pell, I. Bertini, I. C. Felli, L. Gonnelli, R. Pierattelli, T. Herrmann, L. Emsley, G. Pintacuda, Proc. Natl.
Acad. Sci. USA 2012, 109, 11095-11100.
[25] T. Zinkevich, V. Chevelkov, B. Reif, K. Saalwachter, A. Krushelnitsky, J. Biomol. NMR 2013, 57, 219-235. [26] D. B. Good, S. Wang, M. E. Ward, J. Struppe, L. S. Brown,
J. R. Lewandowski, V. Ladizhansky, J. Am. Chem. Soc. 2014, 136, 2833-2842.
[27] A. A. Smith, E. Testori, R. Cadalbert, B. H. Meier, M. Ernst,
J. Biomol. NMR 2016, 65, 171-191.
[28] N. A. Lakomek, S. Penzel, A. Lends, R. Cadalbert, M. Ernst, B. H. Meier, Chem. Eur. J. 2017, 23, 9425-9433.
[29] P. Rovo, R. Linser, Chemphyschem 2018, 19, 34-39. [30] C. M. Quinn, A. E. McDermott, J. Magn. Reson. 2012, 222,
1-7.
[31] P. Ma, J. D. Haller, J. Zajakala, P. Macek, A. C. Sivertsen, D. Willbold, J. Boisbouvier, P. Schanda, Angew. Chem. Int.
Ed. 2014, 53, 4312-4317.
[32] J. M. Lamley, C. Oster, R. A. Stevens, J. R. Lewandowski,
Angew. Chem. Int. Ed. 2015, 54, 15374-15378.
[33] V. Kurauskas, S. A. Izmailov, O. N. Rogacheva, A. Hessel, I. Ayala, J. Woodhouse, A. Shilova, Y. Xue, T. Yuwen, N. Coquelle, J. P. Colletier, N. R. Skrynnikov, P. Schanda, Nat
Commun 2017, 8, 145.
[34] A. Krushelnitsky, D. Gauto, D. C. Rodriguez Camargo, P. Schanda, K. Saalwachter, J. Biomol. NMR 2018, 71, 53-67. [35] T. G. Oas, R. G. Griffin, M. H. Levitt, J. Chem. Phys. 1988,
89, 692-695.
[36] E. Barbet-Massin, A. J. Pell, J. S. Retel, L. B. Andreas, K. Jaudzems, W. T. Franks, A. J. Nieuwkoop, M. Hiller, V. Higman, P. Guerry, A. Bertarello, M. J. Knight, M. Felletti, T. Le Marchand, S. Kotelovica, I. Akopjana, K. Tars, M. Stoppini, V. Bellotti, M. Bolognesi, S. Ricagno, J. J. Chou, R. G. Griffin, H. Oschkinat, A. Lesage, L. Emsley, T. Herrmann, G. Pintacuda, J. Am. Chem. Soc. 2014, 136, 12489-12497.
[37] Y. Shen, A. Bax, J. Biomol. NMR 2013, 56, 227-241. [38] J. R. Lewandowski, H. J. Sass, S. Grzesiek, M. Blackledge,
L. Emsley, J. Am. Chem. Soc. 2011, 133, 16762-16765. [39] M. Baldus, A. T. Petkova, J. Herzfeld, R. G. Griffin, Mol.
Phys. 1998, 95, 1197-1207.
[40] D. H. Zhou, C. M. Rienstra, J. Magn. Reson. 2008, 192, 167-172.
[41] A. Detken, E. H. Hardy, M. Ernst, B. H. Meier, Chem. Phys.
Lett. 2002, 356, 298-304.
[42] E. Kupce, J. Boyd, I. D. Campbell, J. Magn. Reson. B 1995,
106, 300-303.
[43] A. J. Shaka, J. Keeler, R. Freeman, J. Magn. Reson. 1983,
53, 313-340.
[44] F. Delaglio, S. Grzesiek, G. W. Vuister, G. Zhu, J. Pfeifer, A. Bax, J. Biomol. NMR 1995, 6, 277-293.
[45] T. D. Goddard, D. G. Kneller, 2006, SPARKY 3, University of California, San Francisco.
[46] J. J. Helmus, C. P. Jaroniec, J. Biomol. NMR 2013, 55, 355-367.
[47] S. Smith, T. Levante, B. H. Meier, R. Ernst, J. Magn. Reson.
A 1994, 106, 75-105.
[48] V. Kurauskas, E. Weber, A. Hessel, I. Ayala, D. Marion, P. Schanda, J. Phys. Chem. B 2016, 120, 8905-8913. [49] P. Schanda, M. Ernst, Prog. Nucl. Magn. Reson. Spect.