HAL Id: hal-01709517
https://hal.archives-ouvertes.fr/hal-01709517
Submitted on 19 Mar 2019
HAL is a multi-disciplinary open access
archive for the deposit and dissemination of
sci-entific research documents, whether they are
pub-lished or not. The documents may come from
teaching and research institutions in France or
abroad, or from public or private research centers.
L’archive ouverte pluridisciplinaire HAL, est
destinée au dépôt et à la diffusion de documents
scientifiques de niveau recherche, publiés ou non,
émanant des établissements d’enseignement et de
recherche français ou étrangers, des laboratoires
publics ou privés.
Elastomer biaxial characterization using bubble inflation
technique. I: Experimental investigations
N Reuge, Fabrice Schmidt, Yannick Le Maoult, M Rachik, F Abbe
To cite this version:
N Reuge, Fabrice Schmidt, Yannick Le Maoult, M Rachik, F Abbe. Elastomer biaxial characterization
using bubble inflation technique. I: Experimental investigations. Polymer Engineering and Science,
Wiley-Blackwell, 2001, 41 (3), pp.522-531. �10.1002/pen.10749�. �hal-01709517�
Elastomer Biaxial Characterization
Using Bubble Inflation Technique.
I:
Expe rim enta
I
Investigations
N.
REUGE',
F.M. SCHMIDT2**,
Y.
LE
MAOULP,M. RACHIK3, and F. ABBE4
'Laboratoire
descomposites thermostructuraux
Domaine universitaire 3 , A E e
de
1Q B&tie33600 Pessac, fiance
2Ecok
desMines
d'Albi-Cannaux
Campus Jarlard, Route
de
Teilkt
8101 3 Albi
CT
Cedex 09, ficuwe
3Universitk Tectuwlogique
de
CompSgne
BP64960206 Compi&gne Cedex, France
4 S m C M A ,
Division
SEPLe
Haillan
BP37 33135 Saint-Medard en Jalks,
fiance
The biaxial rheological behavior of materials such as elastomers or polymers can be obtained using a bubble-inflation-technique. A circular membrane is clamped at the rim and expanded under gas pressure. The inflation of the circular membrane
is recorded using a CCD video camera and the blowing pressure by a pressure sen- sor, Then, fi-om elongation and curvature radius measurements at the pole of the bubble, one can deduce equibiaxial stress-strain data. This study describes the op- timization of a bubble-inflation rheometer. The most sensitive point of the tech- nique is the estimation of the elongation at the bubble pole, deduced from video camera measurements. A direct measurement of the bubble thickness was per- formed using a magnetic probe in order to validate rheometer results. Such a vali- dation has evidently never been carried out before. Results of quasi-static equibiax- ial characterization of elastomers are presented and analyzed.
1) INTRODUCTION
here is a growing interest in determining biaxial
T
properties of materials such as elastomers used for mechanical applications or thermoplastics for the simulation of plastic-processing operations such as blow molding, stretch blow molding or thermoforming(1). In these specific processes, the polymer is heated above the glass-transition temperature but far from the melting point. Consequently, the biaxial rheome- ter should be suitable for a material close to a solid- like state. In addition, the characterization of elas- tomers is a difficult t a s k because of their high
*Corresponding author.
522
deformation ability and their complex behaviors (non- linear elasticity, viscoelasticity, crystallhation, insta- bility, and so on).
Different types of biaxial rheometers are used to- ward this end. The classic technique of biaxid plane extension of cruciform samples is not really suitable for such materials. The Meissner rheometer (2), made of rotary clamps, seems to be more suitable (but com- plex and expensive, especially in multiaxial configura- tion). Another way to characterize such materials is the squeeze-flow-technique, where a sheet of sample is compressed. A special lubricant is required between the sample surfaces and the compressing plates in order to avoid any shear flow within the sample. But this rheometer is more convenient for liquid-like materials.
Elastomer
B
W
Characterization. IUltimately, bubble inflation seems to be the best way to carry out an equibiaxial elongation of elastomers with a relatively simple device.
The inflation of circular membranes has been of in- terest to scientists and engineers for many years. Bubble inflation with compressed air was used for the first time by Treolar (3) in 1944, to study the behavior of natural rubber and its mechanisms of bursting. In 1951, Rvlin et al. (4) used this technique to identify Neo-Hookean and Mooney-Rvlin rheological parame- ters, and showed that the equibiaxial state of defor- mation at the pole bubble is equivalent to compres- sion according to the normal axis of the membrane. In 1971, Alexander (5) studied and modeled atmospheric neoprene balloon instabilities using the bubble infla- tion technique. In 1973, Paisant (6) studied the defor- mation of natural rubber and SBR membranes to model their biaxial behaviors.
Polymer materials have been also investigated with this technique. In 1975, Schmidt and Carley (7) de- veloped numerical models using non-linear constitu- tive equations issued from the rubber-like materials theory for the membrane-inflation problem and com- pared their results with experimental values obtained with high-impact polystyrene and cellulose acetate butyrate above their respective glass-transition tem- peratures. In 1980, Denson and Hylton (8) used oil to inflate ABS membranes near the forming temperature (138°C). Oil being incompressible, they could cany out retardation experiments, which were impossible with air. I n 1992, Thomas and Tintillier (9) used a video camera system (CCD camera) and preprinted membranes to analyze equibiaxial deformations of PET membranes heated above the glass transition temperature. In 1994, Kappel(l0) used the same kind of device to study a n elastomer. They reached promis-
ing results, but the equibiaxial rheometer is not yet
really operational.Q. 1. Inflated bubble in biaxial ewtenswn
9
In 1996, Michaeli et at. (1 1) developed a specific bubble inflation rheometer, in which again, a mem- brane is inflated using silicon oil with some improve- ments to prescribe a constant strain rate during the entire process.
In 1997, Verron (12) developed a numerical proce- dure using bubble height to compute the rheological parameters for a given constitutive equation during membrane inflation. This numerical approach does not require a complex video camera device to mark the membrane, but the method requires the knowl- edge of the constitutive equation.
Our goal is to develop and optimize a rheometer based on a bubble-inflation technique similar to those of Thomas, Tintillier and Kappel. For this, we have proceeded to comparisons with the measured thick- ness of the inflated membrane using the inflation de- vice and a magnetic probe thickness measurement. The inflation rheometer was then applied to determine the biaxial rheological properties of elastomers at am- bient temperature (no heating stage).
2) BUBBLE I"LATI0N ASSulvIpTIONS 2.1) Hoop Stresa Calculation
A uniform circular membrane is clamped at the rim and inflated using compressed air applied to one side in order to produce a bubble as sketched in R g . 1. The inflation of the circular membrane results in a truly biaxial stretching at the pole of the bubble and a planar extension near the rim. The assumption of spherical symmetry allows u s to equate a,, to uLPq at the pole of the bubble. So, the Cauchy stress tensor a_
-
expressed in spherical coordinates reduces to:The ratio between the thiclmess of the inflated mem- brane e and the curvature radius R, being small enough (13, 14), the
thin
shell assumption allows u s to neglect the radial stress u, in front of the hoop stress ow. In addition, we equate uee to the thickness- average hoop stress, which leads to:assuming that the thickness is uniform at the pole of the bubble. AP is the differential inflation pressure. uo is an additional stress due to the initial compression of the membrane.
2.2) Thioknerrs chhdation
The differential inflation pressure may be easily recorded using a pressure sensor and the curvature radius measured using video camera images analysis in order to calculate the hoop stress (Eq 2). For the thickness calculation, we need to locate a marked
N.
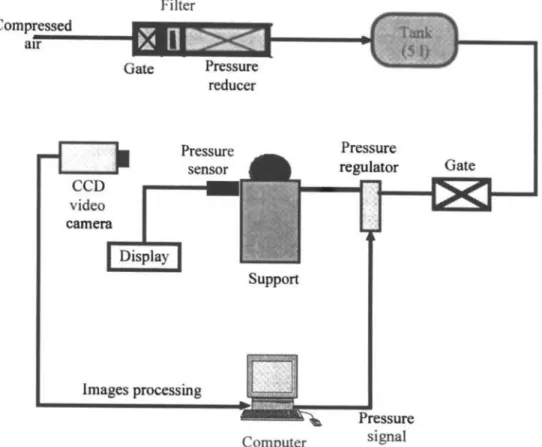
Reuge, F. M. Schmidt, Y. Le M a o d t , M. Rachik, and F. AbbCFig. 2. schematic view of the bubble in_flation rheometer.
area around the pole of the bubble where the defor- mation of the membrane is equibiaxial and the thick- ness uniform (See Section 3).
Using the volume balance at a local level, the thick- ness may be computed using the area change:
(3) where e, is the flat circular membrane thickness. The hoop stretch
A,,
is the ratio between the current length of the profile contour of the polar zone I and the initial length of the polar zone6:
e0 e = -
G
I
(4) 1 he, =<
Then, the thickness-average hoop stress leads to: (5) 3) BUBBLE INFLATION TECHNIQUE
A schematic view of the bubble inflation rheometer is presented in Fig. 2. A circular membrane is mounted between two metal disks containing a circular ap- erture (40 mm diameter) and clamped on a support. The membrane has a 60-mm diameter and a 2-mm
thickness. The air pressure is regulated with a very accurate device and recorded using a pressure sensor located close to the backside of the membrane. The inflation of the membrane is recorded using a CCD SONY video camera (752 X 582 pixels).
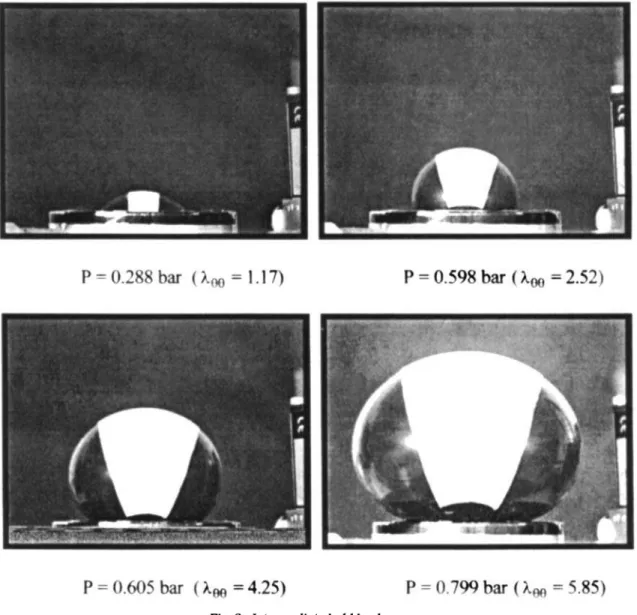
A PC
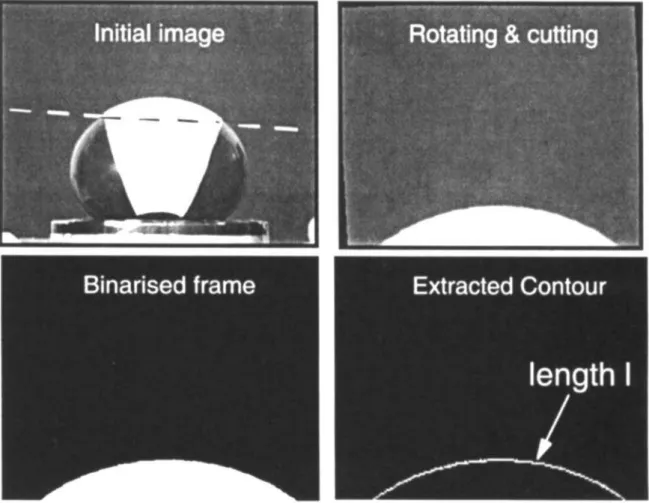
com- puter is used to send a s@ to the pressure regu- lator and to acquire images of video camera by a MATROX image grabber (24 frames/s). Elastomeric membranes were successfully inflated beyond the hemispherical stage to large elongation up to 4 (&. 3). It appears immediately that the hemispherical de- formation occurs only at low elongation (5 2.5)A very sensitive point is that elongation and curva- ture radius must not be measured on the entire bub- ble contour because deformation of the membrane is rigorously equibiaxial only at the pole of the bubble. Consequently, we had to mark the bubble in order to locate a polar area where equibiaxiality can be consid- ered (this assumption will be verified in Section 4). A viscous silicon paste was used to perform a rectangu- lar white mark with an initial width of 10 mm. So, the polar area could be extracted, the length of its contour measured, and its curvature radius computed using a least squares fit (Q. 4). These operations were carried out by our image-processing software (15). Finally, the hoop stretch and stress could be deduced from video- metric and pressure measurements.
Elastomer Biawial Characterization. I
Fig. 3. In- ' bubble shapes.
4) BIAXIAL
REEOMETER ASSESSMENT
An experimental setup was carried out in order to validate the polar area assumption. For this, we have to compare the thickness measured at the pole of the bubble using the bubble-inflation rheometer (video camera measurement) and the thickness measured directly by another device, using a magnetic probe. Such a validation seems never to have been carried out before.
The standard technique used for the thickness meas- urement requires a magnet ball and a magnetic probe (16). The magnet ball is placed upon the membrane and the clamping system is reversed (Fig. 5). The magnetic field measured by the probe depends only on the distance between the probe and the ball, which rep- resents the thickness of the membrane. For a 2-mm- thick sample, the uncertainty of this device is 530 pm. Then, the membrane is inflated for increasing pressure values. For each pressure value, the magnetic probe
fixed on a rack is in perfect contact with the pole of the reversed bubble. We proceed to five measurements for
each pressure value. The pole bubble height H is meas- ured using the video camera image analysis.
4.1) Spherical Bubble-Inflation Amsumption If we assume that the bubble remains spherical during inflation (the curvature radius and the thick- ness are assumed to be constant), the volume balance on the entire bubble (aesumption 1) permits calcula- tion of the relative thickness
-
e :e0
where
%
is the useful membrane radius.Now,
using the volume balance a t the pole of the bubble (p.- muuption 2) yields:526
N.
Reuge,F. M.
Schmidt.Y.
Le Maoult,M.
Rachik, andF.
Abbt?Fig. 4. Video camera images processing.
FQ. 5. Magnetic probe in cantact with the pole.
Elastomer Biaxial Characterization. I
1
0.9
0.8
0.7
0.6
0.5
0.4
0.3
0.2
0.1
0
0
10
20
30
40
50
60
70
80
90
Bubble height
(-)
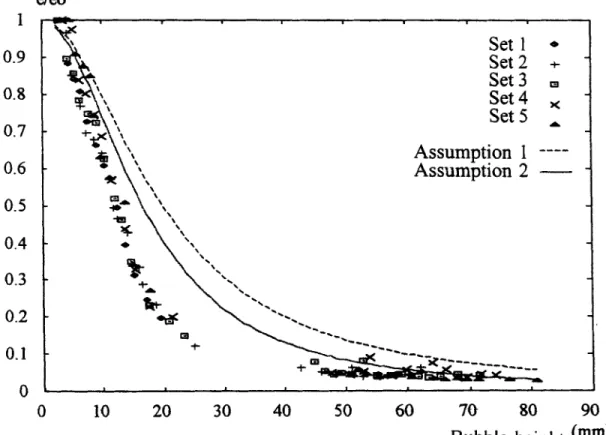
Fig. 6. Comparison between measured and calculated relatim thickness uersw bubble height.n 2 - e en
_ -
e e0In R g . 6, the relative thickness - measured using the bubble-inflation rheometer and using assumptions 1 and 2 are plotted versus bubble height. In both cases,
the error between the measured thickness and the calculated thickness is important. The maximum error
be
-
is morethan
lOO?!. Thus, the spherical bubble as- esumption together with the volume balance assump- tion will not yield useful values for this application. Note that for the assumption 2, the discrepancy is lower than for the assumption 1.
4.2) Polar Area Assumption
In Fig. 7, the relative thickness is plotted versus bubble height for the magnetic probe thickness and the rheometer thickness. Three different elongation
domains appear:
a domain where the elongation is low/medium (A00
5 2.5 i.e.
H
5 28 mm) and for which the discrep-ancy between the two methods is less than looh:
the agreement is fair and allows validation of the
rheometer measurement:
an instability zone where no measurement is possi-
ble: this phenomenon is related to the stress-in-
duced crystallization of the elastomer during the
biaxial elongation and will be analyzed in Section
5 ;
in the last domain of large elongation (Aee 2 4.25
i.e.
H
2 42 mm), the uncertainty of the magneticprobe measurement increases as a result of local
variations of the thickness (the sample slides slightly
between the clamps).
6)
APPLICATIONS
5.1) Eqdbiaxial Rheological Behavior of an
llTRlSBR Elamtomer
We present the equibiaxial stress/strain data for a
natural mbber/SBR compound. used by SNECMA-SEP for mechanical applications (flexible pieces) obtained for
static inflation at ambient temperature (25°C). This
elastomer is a natural rubber (NR) sulfur cured
(SEV
system) filled with carbon black. For reasons of confi-
dentiality, the exact composition of this material can-
not be given. The pressure is imposed at a given
value. The different parameters are calculated using the image processing software associated to the bub- ble inflation rheometer (inflated membrane thickness,
curvature radius, hoop stress and stretch). The proce-
dure is repeated until the elastomer limit of elongation
1.2
1
0.8
0.6
0.4
0.2
0
N . Reuge,
F. M.
Schmidt, Y. Le Maoult, M . Rachik, and F. Abbeefeo
Magnetic probe *
Rheometer
+
+
+
a@e 24.25
0
10
20
30
40
50
60
70
80
90
Bubble height
(mm>
m.
7. amparison between magnetic probe and rheometer relative thickness versus bubble height.is reached (before bursting). We proceed to five mea- surements for each pressure value. Note that the un- certainty for the measurements is less than 4%, which is quite fair.
In Fig. 8, equibiaxial stress-elongation data of the studied elastomer are plotted. Again, three different elongation domains appears:
a domain where the elongation is low/medium (A00
5 2.5) and for which the rheological behavior of the
elastomer is quasi-linear;
an instability zone where no measurement is possi- ble:
a last domain of large elongation (Aee 2 4.25), where
strain hardening occurs.
At small and medium deformations, chain segments of the NR-network are linearly extended. The stress-
strain curve is linear. Then, the domain of instability
begins and the bubble inflates quickly at constant pressure. Figure 3 illustrates this phenomenon: image
3b shows the bubble just before the instability and
image 3c the bubble just after the instability; the elon-
gation
goes
from 2.5 to 4.25 as the pressure remainconstant at 0.6 bar. This phenomenon is well known
for inflation of
NR
membrane and can be attributed tostrain-induced crystallization (see S d o n 5.2).
In Fig. 9, the mean curve for equibiaxial stress-elon-
gation of the elastomer studied is plotted and com-
pared with the uniaxial stress-elongation curve. The
tensile test was performed with an Instron 1100 equip-
ment using a standard H2 sample 46-002). The
elongation speed was fixed to 1 mm/min. In that case,
uniaxial and equibiaxial curves are very similar (the
maximum discrepancy is 1 5 O h ) . This is not the case
if we plot the true stress-strain data (Rg. 10). Depend-
ing
on the type of elongation, the true strain and stressare defined below:
Uniaxial elongation
Equibiaxial elongation
(9)
We have now for a given value of true stress the
equibiaxial true strain that is two times the uniaxial
true strain.
- -
E = 2~88. u =
6.2) Streso-Induced CryoWlirotion
During Elongation
Mullins et al. (17, 18) have reported on an insta-
bility phenomenon for natural rubber during tensile
EZastomer Biaxial Characterization. I
70
60
50
40
30
20
l o
+Set
1
*
-
Set2
+--
Set3
=
Set4
Set5
~-
;t=
-
-
4
-
A3
-
d C D-
*+
4
4
-
/-
-
r + -0
-
I I I I I IFtg. 8. Hoop equibiaxial stress-elongation data IT = 25°C).
70
-
Biaxial
-
-
uniaxial
----
60
50
40
30
20
10
POLYMER ENGINEERING AND SCIENCE, MARCH 2001, Vol. 41, No. 3 529
-
-
-
-
-
-
-
-
-
-
y0 - -
I I I I IN. Reuge,
F. M.
Schmidt, Y.Le
M m u l t ,M.
RQchik, and F. Abbe? 70 60 5040
30
20 10 0 0 0.51
1.52
2.5
3
3.54
-
& Fig. 10. comparison between biavial and uniaxial true stress-strain data for a natuml rubber, SBR compound (T = 25°C).tests and balloon inflation similar to the phenomenon we have observed. They point out that the instability zone is related to the stress-induced crystallization during elongation at ambient temperature. In addi- tion, they observe that crystallization appears first where stresses and deformations are maximum (the center of the tensile sample and the pole of the bal- loon). Then the crystallization front is progressively propagated in the whole natural rubber. In particular, they point out stress softening for crystallizing elas- tomers when the Same sample is submitted to suc- cessive elongation cycles. This effect is the so-called
Mullins effect. We have submitted the natural rubber/
SBR compound elastomer to three successive elonga- tion cycles, and we observe the same behavior as plot- ted in R g . I I . This simple experience demonstrates that the instability phenomenon for this elastomer is due to crystallization during elongation.
Another effect induced by the crystallization is strain hardening. Because of the stronger alignment of chain segments, crystallization appears preferably at locations of large strain or stress, respectively, and leads to a reinforcement of these weakest do- mains of the network. The resulting improved tensile strength properties are typical for NR-networks and a
consequence of the high cis-portion in this rubber, re- lated to the ability to crystallize, together with the very slow crystal growth velocity (19, 20).
6) CONCLUSION
A bubble-inflation rheometer has been developed and optimized. We have validated the thickness com- puted using the area change by measuring the thick- ness using a standard magnetic probe. In addition, we demonstrate that the spherical bubble assumption to- gether with the volume balance assumption will not yield useful values for this application.
Then, biaxial rheological characterization of a nat- ural rubber/SBR compound elastomer was conducted
using
this rheometer. For this elastomer, the biaxial behavior is very similar to the uniaxial behavior. It should be noted that the comparison depends upon whether we use the true stress and strain or the uni- axial and hoop stress and strain. The stress-induced crystallization phenomenon has been hghlighted.Future works will allow u s to proceed to dynamic inktion by using a high-speed video camera and the relevant image grabber. In order to proceed to polymer inflation, an air convection Oven will be added to the present bubble-inflation rheometer. This will d m us
Elastomer Biuxial Characterization. I
35
30
25
20
15
10
5
0
1
2
3
4
5
6
Aee
m.
I I . Stress-sofining for the elastomer ajter successiue elongation cycles.to heat polymers above the glass transition tempera- ture and to obtain biaxial stress-strain data for poly- mers.
ACKNOWLEDGMENT
SEP-Division SNECMA Company supported this re- search. Special thanks go J. P. k c e n s , T. Lopez and B. David.
REFERENCES
1. H. G. Delorenzi and H. F. Nied, computers & Stmctures,
2. J. Meissner, hlym Eng. Sci, 27 (1987).
3. L. R G. Treolar, Pans. Inst. R u b b e r I n d , 18,201 (1944). 4. R. S. Rivlin and D. W. Saunders, PhiL 'lhns. R Soc., 5. H. Alexander, Ink J. Engng. Sci, 8, 151 (1971).
6. J. C. Paisant, "Aspect rhtologique du gonilement dune membrane en caoutchouc, mesure des configurations de forme" (in French), Industrie Mir&&, 1 15 ( 1973). 7. L. R Schmidt and J. F. Carley, Polym Erg. Sci., 15, 51
(1975).
8. C. D. Denson and D. C. Hylton, PoZyrn Erg. Sci. SO,
535 (1980). 26, 197 (1987).
-43, 251 (1951).
9. L. Thomas and M. Tintillier, 'D&eloppement et mise au point dune mtthode dessai de bullage de flans en P. E.
T avec mesure videometrique" (in French), DEA Report, ENSTIMD (1992).
10. H. Kappel, 'Developpement dune methode experimen- tale detude du comportement des maeriaw en defor- mation biaxiale symetrique" (in French), Report, ESSTIN
(1994).
11. W. Michaeli and K Hartwig, Kunststoffe, 86 (1996). 12. E. Verron, 'Contribution experimentale et numerique
au proctdes de moulage par souMage et thermofor- mage" (in French), Thesis, ECN (1997).
13. F. M. Schmidt, J. F. Agassant, M. Rellet. and L. Desout- ter, J. Non-Newt. FIuidMech., 64. 19 (1996).
14. F. M. Schmidt, J. F. Agassant, and M. Bellet, PoZym
Erg. Sci, 38, 1399 (1998).
15. N. Reuge. 'Mise au point et opthnisation d'un rheometre
t5quibiaxia.l pour la caracterisation d'un elastomere" (in French], Report, EMAC (1998).
16. G. Lejeune. 'Contrijle dtpaisseur" (in French), Tech- nique de l'ingtnieur, R-1370. 16. (1999).
17. L. Mullins, J. RubberReseank 16,275 (1947). 18. L. Mullins, J. A. C. Harwmd, a n d k R. Payne, J. EU, 17 19. M. Kluppel. Kautschuk und G m i Kunstsbffe, 47,
20. L. Mandelkem. Rubber Ctmnistry Md Tech,nology, 86, (1967).
242 (1994). 61 (1993).
POLYMER ENGINEERING AND SCIENCE, MARCH 2001, Vd. 41, No. 3 531
Powered by TCPDF (www.tcpdf.org) Powered by TCPDF (www.tcpdf.org) Powered by TCPDF (www.tcpdf.org) Powered by TCPDF (www.tcpdf.org) Powered by TCPDF (www.tcpdf.org) Powered by TCPDF (www.tcpdf.org) Powered by TCPDF (www.tcpdf.org) Powered by TCPDF (www.tcpdf.org) Powered by TCPDF (www.tcpdf.org) Powered by TCPDF (www.tcpdf.org)