HAL Id: hal-02272079
https://hal.sorbonne-universite.fr/hal-02272079
Submitted on 27 Aug 2019HAL is a multi-disciplinary open access
archive for the deposit and dissemination of sci-entific research documents, whether they are pub-lished or not. The documents may come from teaching and research institutions in France or abroad, or from public or private research centers.
L’archive ouverte pluridisciplinaire HAL, est destinée au dépôt et à la diffusion de documents scientifiques de niveau recherche, publiés ou non, émanant des établissements d’enseignement et de recherche français ou étrangers, des laboratoires publics ou privés.
pressure Diaphragm shear modulus reflects
transdiaphragmatic pressure 1 during isovolumetric
inspiratory efforts and ventilation against 2 inspiratory
loading 3
Damien Bachasson, Martin Dres, Marie-Cecile Nierat, Jean-Luc Gennisson,
Jean-Yves Hogrel, Jonne Doorduin, Thomas Similowski
To cite this version:
Damien Bachasson, Martin Dres, Marie-Cecile Nierat, Jean-Luc Gennisson, Jean-Yves Hogrel, et al.. Diaphragm shear modulus reflects transdiaphragmatic pressure Diaphragm shear modulus reflects transdiaphragmatic pressure 1 during isovolumetric inspiratory efforts and ventilation against 2 in-spiratory loading 3. Journal of Applied Physiology, American Physiological Society, 2019, 126 (3), pp.699-707. �10.1152/japplphysiol.01060.2018�. �hal-02272079�
1
Diaphragm shear modulus reflects transdiaphragmatic pressure
1
during isovolumetric inspiratory efforts and ventilation against
2
inspiratory loading
3
Damien Bachasson*#1, Martin Dres#2,3, Marie-Cécile Niérat3, Jean-Luc Gennisson4, Jean-Yves Hogrel1,
4
Jonne Doorduin5, Thomas Similowski2,3
5
1Institute of Myology, Neuromuscular Investigation Center, Neuromuscular Physiology Laboratory, Paris,
6
France 7
2AP-HP, Groupe Hospitalier Pitié-Salpêtrière Charles Foix, Service de Pneumologie, Médecine Intensive et
8
Réanimation, (Département “R3S”), F-75013, Paris, France 9
3Sorbonne Université, INSERM, UMRS1158 Neurophysiologie respiratoire expérimentale et clinique, F-75005
10
Paris, France 11
4Imagerie par Résonance Magnétique Médicale et Multi-Modalités (IR4M), CNRS UMR8081, Université
Paris-12
Saclay, Orsay, France 13
5Department of Neurology, Donders Institute for Brain, Cognition and Behaviour, Radboud University Medical
14
Center, Nijmegen, The Netherlands 15
#Both authors equally contributed to this work.
16
*Address for correspondence: Institute of Myology, Neuromuscular Investigation Center, Neuromuscular 17
Physiology Laboratory, Hôpital Universitaire Pitié Salpêtrière, Paris 75651 Cedex 13, France. Tel: +33 1 42 16 18
66 41; fax: +33 1 42 16 58 81. E-mail address: d.bachasson@institut-myologie.org 19
2
Abstract
20
Aim. The reference method for the assessment of diaphragm function relies on the measurement of
21
transdiaphragmatic pressure (Pdi). Local muscle stiffness measured using ultrafast shear wave elastography 22
(SWE) provides reliable estimates of muscle force in locomotor muscles. This study aimed at investigating 23
whether SWE could be used as a surrogate of Pdi to evaluate diaphragm function. 24
Methods. Fifteen healthy volunteers underwent a randomized step-wise inspiratory loading protocol of 0-60%
25
of maximal isovolumetric inspiratory pressure during closed-airways maneuvers and 0-50% during ventilation 26
against an external inspiratory threshold load. During all tasks, Pdi was measured and SWE was used to assess 27
shear modulus of the right hemi-diaphragm (SMdi) at the zone of apposition. Pearson correlation coefficients 28
(r) and repeated measures correlation coefficient (R) were computed to determine within individual and overall 29
relationships between Pdi and SMdi, respectively. 30
Results. During closed-airways maneuvers, mean Pdi correlated to mean SMdi in all participants (r ranged
31
from 0.77 to 0.96, all p < 0.01; R = 0.82, 95% CIs [0.76, 0.86], p < 0.01). During ventilation against inspiratory 32
threshold loading, Pdi swing correlated to maximal SMdi in all participants (r ranged from 0.40 to 0.90, all p < 33
0.01; R = 0.70, 95% CIs [0.66, 0.73], p < 0.001). Changes in diaphragm stiffness as assessed by SWE reflect 34
changes in transdiaphragmatic pressure. 35
Conclusion. SWE provides a new opportunity for direct and non-invasive assessment of diaphragm function.
3
New & Noteworthy
37
Accurate and specific estimation of diaphragm effort is critical for evaluating and monitoring diaphragm 38
dysfunction. The measurement of transdiaphragmatic pressure requires the use of invasive gastric and 39
esophageal probes. In the present work, we demonstrate that changes in diaphragm stiffness assessed with 40
ultrasound shear wave elastography reflect changes in transdiaphragmatic pressure, therefore offering a new 41
noninvasive method for gauging diaphragm effort. 42
4
Introduction
43
The evaluation and monitoring of respiratory muscle function in general and of diaphragm function in particular 44
are clinically relevant in a variety of clinical settings, among which weaning from mechanical ventilation (20). 45
Routine measurements of respiratory function like those of volumes, flows, and gas exchange, are nonspecific 46
and only give indirect information about respiratory muscle function. A more specific approach to 47
quantitatively asses respiratory muscle function relies on the measurement of their force producing capacity (1). 48
Yet there is currently no method directly giving access to respiratory muscle force in humans, hence the reliance 49
on pressure differences to assess respiratory muscle function. Likewise, the reference method for the assessment 50
of diaphragm function is the measurement of the transdiaphragmatic pressure (Pdi). Pdi is defined as the 51
difference between pleural and abdominal pressures that are inferred from esophageal pressure (Pes) and gastric 52
pressure (Pga), respectively (1). As the diaphragm is the only muscle that simultaneously lowers Pes and 53
increases Pga, Pdi is considered as the most specific approach to assess diaphragm function. Pdi is not a direct 54
reflection of diaphragm strength insofar as it depends on an array of factors governing the transformation of 55
force into pressure (such as lung volume as a determinant of diaphragm length, thoracic and abdominal 56
compliances, and thoracoabdominal configuration that can critically affect Pdi irrespective of any change in 57
diaphragm strength (5).Yet Pdi is clinically relevant in that it represents the actual force that drives lung volume 58
changes and therefore, ultimately, alveolar ventilation. Of note, measuring Pdi requires the use of esophageal 59
and gastric probes, which impedes its generalization as a clinical tool. 60
Diaphragm ultrasound imaging allows the noninvasive measurement of diaphragm excursion, thickness and 61
thickening (26, 31). Diaphragm thickening fraction has been shown to be an efficient tool for identifying 62
diaphragm dysfunction, monitoring its temporal changes, and predicting weaning outcomes in ventilated 63
patients (10, 11). However, equivocal relationships between Pdi and diaphragm thickening fraction have been 64
reported (12, 23, 29),. Ultrasound shear wave elastography (SWE) is a recently available imaging method 65
5
allowing direct and real-time quantification of tissue mechanical properties (16). Briefly, SWE relies on the 66
measurement of propagation velocity of shear waves remotely generated inside tissues by ultrasonic focused 67
beams. Shear modulus can be readily estimated from the measured shear wave propagation velocity and tissue 68
density (4). Local muscle stiffness measured using SWE has been shown to provide reliable estimates of muscle 69
force in locomotor muscles (15, 18). Recently, Chino et al. (7) reported that the shear modulus of the diaphragm 70
(SMdi) increases along with mouth pressure (Pmo) during isovolumetric inspiratory efforts. However, the 71
relationship between SMdi and Pdi remains to be investigated. 72
Therefore, the aim of this study was to investigate the potential of ultrasound shear wave elastography to 73
evaluate diaphragm function in healthy subjects during isovolumetric inspiratory efforts and during ventilation 74
against inspiratory loads. We hypothesized that changes in SMdi would reflect changes in Pdi. 75
Materials and Methods
76
Participants
77All participants gave written informed consent. This study conformed to the Declaration of Helsinki and was 78
approved by the local ethics committee (Comité de Protection des Personnes iIe-de-France VI, France). The 79
study was publicly registered prior to the first inclusion (ClinicalTrials.gov, NCT03313141). 80
Experimental setup
81Participants were studied in a semirecumbent position (40 degrees) with uncast abdomen, breathing through a 82
mouthpiece while wearing a nose clip. The mouthpiece was connected to a two-way valve and 83
pneumotachograph (3700 series, linearity range 0–160 L*min-1; Hans Rudolph, Kansas City, MO) for flow 84
measurement. Pmo was recorded using a differential transducer (model DP45–18, Validyne, Northridge, CA). 85
Pes and Pga were measured using 8-cm balloon catheters (C76080U; Marquat Génie Biomédical, Paris, 86
6
France), connected separately to differential pressure transducers (model DP45-32; Validyne, Northridge, CA) 87
as previously described (30). Flow and pressures signals were digitized (Powerlab, ADInstruments, Sydney, 88
Australia) and recorded at a sampling frequency of 2 kHz (Labchart, ADInstruments). Pdi was obtained by 89
online subtraction of Pes from Pga. 90
Ultrasound measurements. Diaphragm ultrasound imaging and shear wave elastography were performed
91
using an Aixplorer Ultrasound scanner (V11.2, Supersonic Imagine, Aix-en-Provence, France) driving a 10-2 92
MHz linear transducer array (SL10-2, Supersonic Imagine). Settings were defined as follow: B-mode enabled; 93
supersonic shear wave imaging mode enabled (SWE); penetration mode enabled; tissue tuner at 1540 m·s-1;
94
dynamic range at 80 dB. Gain and time gain compensation were tailored for each patient. Sampling rates for B-95
mode imaging and SWE were 12 and 2 Hz, respectively. A generous amount of ultrasound gel was used during 96
scanning for optimal acoustic coupling and minimal pressure was applied to the transducer in order to limit 97
tissue deformation and modification of ventilatory mechanism. The right hemi-diaphragm was scanned at the 98
zone of apposition, on the posterior axillary line vertical to the chest wall at the 8th-10th intercostal space. The
99
right hemi-diaphragm was identified as a three-layered structure comprising two hyperechoic lines representing 100
the pleural and peritoneal membranes and a middle hypoechoic layer representing the diaphragmatic muscle 101
fibers. The rotation and angle of the transducer was then finely adjusted to obtain maximal echo intensity from 102
diaphragmatic pleura and peritoneal membrane. The location of the probe was carefully marked on the skin to 103
ensure reliable positioning of the probe within the protocol. Ultrasound acquisition were triggered with the 104
Powerlab for synchronizing ultrasound, flow, and pressures recordings. Ultrasound measurements were 105
performed by a trained operator (MD). An overview of the setup and samples of diaphragm ultrasound imaging 106
is provided in Figure 1. 107
7
Study protocol
108
The study was carried out as follows: i) measurement of maximal isovolumetric inspiratory pressure (PImax), ii)
109
recordings during apnea at functional residual capacity (FRC), iii) recordings during inspiratory efforts against 110
closed airways, iv) recordings during ventilation against inspiratory threshold loading. Each step of the protocol 111
was performed twice. 112
Maximal isovolumetric inspiratory pressure. PImax was measured at FRC. At least five trials were performed
113
until three reproducible efforts, with less than 10% variance, were obtained (1). Maximal Pmo generated 114
amongst the three reproducible trials was defined as PImax.
115
Apnea at FRC and isovolumetric inspiratory efforts against closed airways. During these tasks, the mouthpiece
116
was disconnected from the three-way valve and flow was not monitored. Pressures and SMdi were measured 117
during ~5s open glottis apnea and during inspiratory efforts against closed airways at 10, 20, 30, 40, 50, and 60 118
% of PImax. Both apnea and inspiratory efforts were performed at FRC. Participants were asked to reach
119
progressively the target Pmo and to maintain their effort during ~10s. Visual feedback of generated Pmo and 120
guidelines were provided to participants using the built-in software option. Each task was repeated twice. Tasks 121
were alternated with 1-2 min of unloaded breathing. 122
Ventilation against inspiratory threshold loading. An in-house developed apparatus (23) modified from Chen et
123
al. (6) was used to perform ventilation against inspiratory threshold loads. Briefly, the device consisted of a 124
cylindrical adjustable pressure chamber connected to a non-rebreathing valve. The negative pressure was 125
generated by a commercially available vacuum cleaner. Pressure in the chamber (Pch) was measured 126
continuously using a differential pressure transducer (model DP45-32; Validyne, Northridge, CA). The dead 127
space of the device was estimated at ~600 ml. Participants underwent a step-wise inspiratory threshold loading 128
protocol at 10, 20, 30, 40 and 50% of PImax. Each task was repeated twice. During each task, at least six 129
regular respiratory cycles were recorded. Tasks were alternated with 1-2 min of unloaded breathing. 130
8
Data analysis
131
Pes, Pga, Pdi, Pmo, Pch and flow were analyzed offline using standardized scripts in MATLAB (Mathworks, 132
Natick, MA, USA). Frames from B-mode and SWE recordings were exported using the ultrasound scanner 133
research pack (Soniclab, v12, Supersonic imagine) and each clips were processed offline using standardized 134
scripts in MATLAB (Mathworks). A square region of interest (ROI) was drawn within the shear modulus map 135
(see Figure 1) of the first frame of each clip between the diaphragmatic pleura and peritoneal. The latter ROI 136
was replicated on other frames. SMdi was calculated assuming a linear elastic behavior in muscle tissue (4) as 137
SMdi = ρ·Vs2 where ρ is the density of muscle (1000 kg·m-3), and Vs is the shear wave speed in m·s-1. Values
138
with each ROI were averaged and reported as SMdi. For measurements during isovolumetric inspiratory efforts, 139
signals were manually selected when Pmo was stabilized at the targeted levels. Pressures and SMdi where then 140
averaged over the duration of the selected period. During ventilation against inspiratory threshold loading, 141
maximal SMdi and pressures variations (i.e. Pmo, Pes, Pga, Pdi) within inspiratory time were computed for 142
each cycle. Cycles were discarded if diaphragm visualization was lost during the acquisition, or in the presence 143
of lung artefacts. Mean SMdi at functional residual capacity during apnea was subtracted from mean SMdi or 144
maximal SMdi (within inspiratory time) during isovolumetric efforts and ventilation, respectively. 145
Statistics
146Data within text and tables are presented as mean ± SD and mean [95% CIs] for correlation coefficients. The 147
assumptions of normality and sphericity were confirmed using the D’Agostino’s K-squared and Mauchly’s 148
tests, respectively. Repeated measures ANOVAs were conducted to evaluate change in variables depending on 149
conditions. Tukey’s HSD post-hoc tests were conducted when significant effect was found. Pearson correlation 150
coefficients (r) were used for determining within-individual relationships between variables. For isovolumetric 151
efforts, coefficients of variation were computed to assess the variability of Pdi and SMdi within the selected 152
periods. Repeated measures correlation coefficient (R) were used for determining overall relationships between 153
9
variables (3). This statistical technique is used for determining the common within-individual association for 154
paired measures assessed on two or more occasions for multiple individuals. This allows removing biases 155
caused by violation of independence and/or differing patterns between-participants versus within-participants 156
when performing simple correlation on aggregated data. All analyses were performed in the computing 157
environment R version 3.2.4 (28). Statistical significance was set at p < 0.05 for all tests. 158
Results
159
Fifteen healthy participants (11 men, age = 32 years (min-max, 18-43), BMI = 24 kg·m-2 (SD 2.6); 4 women, 160
age = 28 years (min-max, 20-44), BMI = 21.3 kg·m-2 (SD 1.3)) were studied. Mean PImax was 120 cmH2O (SD
161
26) and mean SMdi during apnea at FRC was 9.13 kPa (SD 2.17). Body weight and PImax were significantly
162
correlated (r = 0.76, p < 0.01.). 163
Isovolumetric inspiratory effort against closed airways. Typical recordings from isovolumetric submaximal
164
inspiratory efforts are shown in Figure 2 (see also Supplemental Video S1 165
[https://figshare.com/s/eb987ad33ec4218e2cae]). Two participants did not perform isovolumetric inspiratory 166
efforts against closed airways and two participants did not performed 60% PImax. Ultimately, the 89 available 167
acquisitions were used for analysis. Mean selection duration for averaging data was 8.7 s (SD 3.9). Within 168
selected data, mean of coefficient of variation for Pmo, Pes, Pga, Pdi, and SMdi were 14.2, 9.0, 6.3, 5.4, and 169
16.2 %, respectively. Pressures, and SMdi for all levels of inspiratory effort are displayed in Table 1 and Figure 170
3A. Repeated measures ANOVA showed significant effect of inspiratory effort levels on SMdi and Pdi. 171
Relationship between mean Pdi swing and mean SMdi during all tasks for all data points is displayed in Figure 172
3B. Mean Pdi significantly correlated to mean SMdi in all participants (r ranged from 0.77 to 0.96, all p < 0.01; 173
R = 0.82, 95% CIs [0.76, 0.86]). Individual correlation coefficients and individual datapoints are shown in Table
174
2 and Figure 4, respectively. 175
10
Ventilation against inspiratory threshold loading. Typical recordings from ventilation against inspiratory
176
threshold loading in Figure 5 (see also Supplemental Video S2
177
[https://figshare.com/s/28abd0263f7df2285b65]). Two participants (5, 10) did not performed 50% PImax, one 178
participant did not performed 40% PImax, and one participant additionally performed 60% PImax). Ultimately, 179
66 cycles were discarded over 970-recorded cycles because of aberrant SMdi values caused by loss of 180
diaphragm visualization or lung artefacts during the acquisition. The number of cycles analyzed per loading 181
level was 11.8 (SD 3.0). Flow, Pressures, and SMdi for unloaded breathing and all levels of inspiratory levels 182
are displayed in Table 3 and Figure 6A. Repeated measures ANOVA showed significant effect of inspiratory 183
threshold loading levels on SMdi and Pdi. Relationship between Pdi swing and maximal SMdi for all analyzed 184
cycles and all loading tasks is displayed in Figure 6B. Maximal SMdi correlated to Pdi swing in all participants 185
(r ranged from 0.40 to 0.90, all p < 0.01; R = 0.70, 95% CIs [0.66, 0.73], p < 0.001). Individual correlation 186
coefficients and individual datapoints are shown in Table 4 and Figure 7, respectively. 187
Discussion
188
The aim of the present study was to investigate the potential of ultrasound shear wave elastography for 189
evaluating diaphragm function in healthy subjects. We found that shear wave modulus of the diaphragm (i.e. 190
stiffness) was strongly correlated with transdiaphragmatic pressure during both isovolumetric inspiratory efforts 191
and inspiratory threshold loading. 192
As expected, increasing the inspiratory load during both isovolumetric inspiratory efforts and ventilation against 193
inspiratory threshold loading resulted in an increase in Pdi (Table 1 and Figure 3; Table 3 and Figure 6, 194
respectively). It should be noted that during unloaded breathing, Pdi and tidal volume were larger than expected 195
for healthy subjects (Table 3) (9). This is most likely the result of the additional resistance and instrumental 196
dead space imposed by the experimental device. Accordingly, variations in Pmo expressed as a percentage of 197
11
PImax were greater than pressure within the inspiratory loading device. Our data showed strong linear
198
relationship between mean SMdi and Pdi during submaximal isovolumetric inspiratory efforts (Figure 3). These 199
findings demonstrate that diaphragm stiffening is strongly related to the level of diaphragm activation as 200
assessed by Pdi measurements. These findings are in line with the repeatedly demonstrated linear relationship 201
between muscle shear modulus and active muscle force in locomotor muscles (2, 15, 18, 21). These results are 202
also in agreement with the recent work by Chino et al. (7) that reported significant correlation between SMdi 203
and Pmo during similar isovolumetric inspiratory efforts at FRC. However, we reported lower SMdi values for 204
given isovolumetric inspiratory efforts e.g. mean SMdi was 63 kPa (SD 16) at 50% of PImax versus 29 kPa (SD 205
13) in the present work. Diaphragm recruitment is known to be reduced during voluntary inspiratory efforts in 206
the semirecumbent position compared to the sitting position that was used in the study by Chino et al. (19). A 207
lower ability of the participants to efficiently recruit their diaphragm may also contributed to explain these 208
results. Our data also show strong linear relationship between max SMdi and Pdi swing during ventilation 209
against inspiratory threshold loading. These findings demonstrate for the first time that diaphragm function can 210
be noninvasively monitored using SWE during breathing. Besides one report in the cardiac muscle (8), this is 211
also the first report supporting that SWE may be used to monitor dynamic muscle contractions. Although we 212
found high individual correlation coefficients between SMdi and Pdi in most participants, our data showed that 213
SMdi may fail to increase along with Pdi during both isovolumetric inspiratory efforts (i.e. participants 5, 11, 214
12; Figure 4 and Table 2) and during ventilation against inspiratory threshold loading (i.e. participants 5, 12, 15; 215
Figure 7 and Table 4). These findings may be explained, at least in part, by misalignment of the transducer 216
according to the direction of diaphragm fascicles. This factor has been repeatedly identified as critical given the 217
highly anisotropic nature of the skeletal muscle (17). Slight offset of transducer angle in reference to the 218
direction of muscle fascicles reduces shear modulus value (17). Therefore, quality criteria for SMdi 219
measurements must be established and adjustment of transducers in the three-dimensional space shall be 220
assisted programmatically to obtain largest SMdi changes during ventilation. Another potential explanation is 221
12
that Pdi is an indirect reflect of diaphragm force, insofar as the its generation is influenced by factors such as 222
lung volume, thoracoabdominal compliances and thoracoabdominal geometrical configuration (see 223
introduction). Also, Pdi can be contributed to by extra diaphragmatic inspiratory muscles or by expiratory 224
muscles if the transmission of the pressure that these muscle generate across the diaphragm is incomplete, 225
which can occur in the presence of concomitant contraction of the diaphragm with other respiratory muscles 226
(14, 27). Thus, high Pdi values can be reached in certain circumstances with limited contribution of the 227
diaphragm. Interestingly, we observed less steep relationship between SMdi and Pdi during isovolumetric effort 228
as compared to ventilation against threshold inspiratory loading. This may be explained, at least in part, by the 229
fact that efforts were performed at functional residual capacity during submaximal isovolumetric effort i.e. 230
closer to diaphragm optimal length as compared to ventilation against threshold inspiratory loading where peak 231
Pdi is reached at higher pulmonary volume. 232
Limitations. Participants were free to use any strategy to reach the target during isovolumetric inspiratory effort
233
(with a Pmo rather that a Pdi target) or to overcome inspiratory loads during ventilation tasks. This may have 234
led to poor diaphragm recruitment. Within the present study, SWE frame rate was limited to 2 Hz and this may 235
contribute, at least in part, to reduce the amplitude of SMdi variations. Increase in SWE frame rate represents a 236
critical challenge to fully exploit the potential of SMdi measurements. Oppersma et al. (23) recently 237
demonstrated that diaphragm strain and strain rate assessed using speckle tracking outperform conventional 238
ultrasound methods. Comparison of SMdi with strain-derived metrics and conventional thickening fraction 239
remain to be investigated. Ultrasound muscle imaging is highly operator dependent. Change in transducer 240
position might have occurred, in particularly with large thorax movement and this may contribute to explain 241
inferior SWE performance in some participants. As previously observed during pretests, SMdi could not be 242
assessed during maximal inspiratory maneuvers. It is unlikely that diaphragm SWE may be accurately used as 243
performed within this study during maximal inspiratory maneuvers because of sudden thorax movement and 244
large diaphragm deformation. Collectively, these findings emphasize the need to develop specifically designed 245
13
skin-transducer interfaces and optimized post processing methods for reducing these confounding effects. In 246
addition, both intra- and inter-operator reliability of SMdi measurements remain to be evaluated. The limited 247
frame rate of SWE mentioned above also prevent the use of SWE during electrical/magnetic phrenic nerve 248
stimulation or brief volitional maneuvers such as the sniff test (1). Although SWE frame rate may be 249
substantially increased (8), it will most likely remain too low for capturing such short events because shear 250
waves must first travel through the tissue to be filmed (16). Similarly to conventional ultrasound methods, lung 251
sliding may block a good view on the diaphragm when tidal volume increases (26). This may therefore prevent 252
us from using diaphragm SWE when ventilatory demand is increased e.g. during exercise and/or with higher 253
inspiratory volume. This will be investigated in future works. At last, increase diaphragm depth caused by 254
thicker subcutaneous tissue in overweighed patients may also affect SMdi measurements (13). 255
Perspective and clinical implications. Diaphragm SWE appears to have a strong potential for direct,
256
noninvasive, and specific assessment of diaphragm effort. SMdi coupled with functional respiratory 257
investigations may help to detect diaphragm dysfunction (25). Although feasibility of diaphragm SWE in the 258
left zone of apposition (and other approaches) remain to be investigated, it might be particularly useful for 259
detecting diaphragm hemi-paralysis. Diaphragm SWE might also be particularly relevant within spontaneous 260
breathing trials and/or pressure support ventilation in ventilated patients during the weaning phase (22, 25). 261
Diaphragm stiffening-time index may also be computed during spontaneous breathing trial similarly to the 262
diaphragm excursion-time index recently proposed by Palkar et al. (24). Hence the feasibility and the 263
performance of SMdi measurements in critically ill patients shall be assessed in future studies. Pediatric use of 264
diaphragm SWE also remain to be addressed. The current offline setting of the data analysis impedes the use of 265
diaphragm SWE at the bedside. Built-in mode must be developed within ultrasound scanners to allow on-site 266
SMdi measurements. The development of a device specifically designed for this purpose may also help to apply 267
and disseminate the use of diaphragm SWE. 268
14
In conclusion, diaphragm SWE may be used as a noninvasive and specific method for detecting stepwise 269
increases in diaphragm effort during submaximal isovolumetric inspiratory efforts and during ventilation 270
against inspiratory threshold loading. SMdi was strongly correlated to Pdi within both models. Further research 271
and technological developments are required to optimize diaphragm SWE and its conditions of use for the 272
diagnosis and follow up of diaphragm dysfunction as well as its potential for predicting weaning outcome in the 273
ventilated patient. 274
Acknowledgments
275
We gratefully thank all the volunteers who participated in this study. This study was supported by the 276
Association pour le Développement et l’Organisation de la Recherche en Pneumologie et sur le Sommeil 277
(ADOREPS), the program Investissement d'Avenir ANR-10-AIHU 06 of the French Government, and the 278
Association Française Contre Les Myopathies (AFM). 279
Conflict of Interest
280
JLG is a scientific consultant for Supersonic Imagine, Aix-en-Provence, France. MD received personal fees 281
from Lungpacer Medical Inc., Vancouver, Canada. A request for a patent that encompasses findings presented 282
in the present work has been filled. 283
15
References
284
1. American Thoracic Society/European Respiratory S. ATS/ERS Statement on respiratory muscle
285
testing. American Journal of Respiratory and Critical Care Medicine 166: 518-624, 2002. 286
2. Ates F, Hug F, Bouillard K, Jubeau M, Frappart T, Couade M, Bercoff J, and Nordez A. Muscle
287
shear elastic modulus is linearly related to muscle torque over the entire range of isometric contraction intensity. 288
Journal of Electromyography and Kinesiology 25: 703-708, 2015.
289
3. Bakdash JZ, and Marusich LR. Repeated Measures Correlation. Front Psychol 8: 456, 2017.
290
4. Bercoff J, Tanter M, and Fink M. Supersonic shear imaging: a new technique for soft tissue elasticity
291
mapping. IEEE Transactions on Ultrasonics Ferroelectrics and Frequency Control 51: 396-409, 2004. 292
5. Chen R, Kayser B, Yan S, and Macklem PT. Twitch transdiaphragmatic pressure depends critically
293
on thoracoabdominal configuration. J Appl Physiol (1985) 88: 54-60, 2000. 294
6. Chen RC, Que CL, and Yan S. Introduction to a new inspiratory threshold loading device. Eur Respir
295
J 12: 208-211, 1998.
296
7. Chino K, Ohya T, Katayama K, and Suzuki Y. Diaphragmatic shear modulus at various submaximal
297
inspiratory mouth pressure levels. Respir Physiol Neurobiol 252-253: 52-57, 2018. 298
8. Couade M, Pernot M, Messas E, Bel A, Ba M, Hagege A, Fink M, and Tanter M. In vivo
299
quantitative mapping of myocardial stiffening and transmural anisotropy during the cardiac cycle. IEEE 300
Transactions on Medical Imaging 30: 295-305, 2011.
301
9. Doorduin J, Sinderby CA, Beck J, Stegeman DF, van Hees HW, van der Hoeven JG, and Heunks
302
LM. The calcium sensitizer levosimendan improves human diaphragm function. American Journal of
303
Respiratory and Critical Care Medicine 185: 90-95, 2012.
16
10. Dres M, Goligher EC, Dube BP, Morawiec E, Dangers L, Reuter D, Mayaux J, Similowski T, and
305
Demoule A. Diaphragm function and weaning from mechanical ventilation: an ultrasound and phrenic nerve
306
stimulation clinical study. Ann Intensive Care 8: 53, 2018. 307
11. Dube BP, and Dres M. Diaphragm Dysfunction: Diagnostic Approaches and Management Strategies.
308
Journal of Clinical Medicine 5: 113, 2016.
309
12. Dube BP, Dres M, Mayaux J, Demiri S, Similowski T, and Demoule A. Ultrasound evaluation of
310
diaphragm function in mechanically ventilated patients: comparison to phrenic stimulation and prognostic 311
implications. Thorax 72: 811-818, 2017. 312
13. Ewertsen C, Carlsen JF, Christiansen IR, Jensen JA, and Nielsen MB. Evaluation of healthy muscle
313
tissue by strain and shear wave elastography - Dependency on depth and ROI position in relation to underlying 314
bone. Ultrasonics 71: 127-133, 2016. 315
14. Gandevia SC, McKenzie DK, and Plassman BL. Activation of human respiratory muscles during
316
different voluntary manoeuvres. J Physiol 428: 387-403, 1990. 317
15. Gennisson JL, Cornu C, Catheline S, Fink M, and Portero P. Human muscle hardness assessment
318
during incremental isometric contraction using transient elastography. Journal of Biomechanics 38: 1543-1550, 319
2005. 320
16. Gennisson JL, Deffieux T, Fink M, and Tanter M. Ultrasound elastography: principles and
321
techniques. Diagn Interv Imaging 94: 487-495, 2013. 322
17. Gennisson JL, Deffieux T, Mace E, Montaldo G, Fink M, and Tanter M. Viscoelastic and
323
anisotropic mechanical properties of in vivo muscle tissue assessed by supersonic shear imaging. Ultrasound in 324
Medicine and Biology 36: 789-801, 2010.
325
18. Hug F, Tucker K, Gennisson JL, Tanter M, and Nordez A. Elastography for Muscle Biomechanics:
326
Toward the Estimation of Individual Muscle Force. Exercise and Sport Sciences Reviews 43: 125-133, 2015. 327
17
19. Koulouris N, Mulvey DA, Laroche CM, Goldstone J, Moxham J, and Green M. The effect of
328
posture and abdominal binding on respiratory pressures. Eur Respir J 2: 961-965, 1989. 329
20. Laghi F, and Tobin MJ. Disorders of the respiratory muscles. American Journal of Respiratory and
330
Critical Care Medicine 168: 10-48, 2003.
331
21. Lapole T, Tindel J, Galy R, and Nordez A. Contracting biceps brachii elastic properties can be
332
reliably characterized using supersonic shear imaging. European Journal of Applied Physiology 115: 497-505, 333
2015. 334
22. Magalhaes PAF, Camillo CA, Langer D, Andrade LB, Duarte M, and Gosselink R. Weaning failure
335
and respiratory muscle function: What has been done and what can be improved? Respiratory Medicine 134: 336
54-61, 2018. 337
23. Oppersma E, Hatam N, Doorduin J, van der Hoeven JG, Marx G, Goetzenich A, Fritsch S,
338
Heunks LMA, and Bruells CS. Functional assessment of the diaphragm by speckle tracking ultrasound during
339
inspiratory loading. J Appl Physiol (1985) 123: 1063-1070, 2017. 340
24. Palkar A, Narasimhan M, Greenberg H, Singh K, Koenig S, Mayo P, and Gottesman E.
341
Diaphragm Excursion-Time Index: A New Parameter Using Ultrasonography to Predict Extubation Outcome. 342
Chest 153: 1213-1220, 2018.
343
25. Pirompanich P, and Romsaiyut S. Use of diaphragm thickening fraction combined with rapid shallow
344
breathing index for predicting success of weaning from mechanical ventilator in medical patients. J Intensive 345
Care 6: 6, 2018.
346
26. Sarwal A, Walker FO, and Cartwright MS. Neuromuscular ultrasound for evaluation of the
347
diaphragm. Muscle & Nerve 47: 319-329, 2013. 348
27. Similowski T, Duguet A, Straus C, Attali V, Boisteanu D, and Derenne JP. Assessment of the
349
voluntary activation of the diaphragm using cervical and cortical magnetic stimulation. Eur Respir J 9: 1224-350
1231, 1996. 351
18
28. Team RC. R: A Language and Environment for Statistical Computing. 2017.
352
29. Umbrello M, Formenti P, Longhi D, Galimberti A, Piva I, Pezzi A, Mistraletti G, Marini JJ, and
353
Iapichino G. Diaphragm ultrasound as indicator of respiratory effort in critically ill patients undergoing
354
assisted mechanical ventilation: a pilot clinical study. Critical Care 19: 161, 2015. 355
30. Verges S, Bachasson D, and Wuyam B. Effect of acute hypoxia on respiratory muscle fatigue in
356
healthy humans. Respiratory Research 11: 109, 2010. 357
31. Zambon M, Greco M, Bocchino S, Cabrini L, Beccaria PF, and Zangrillo A. Assessment of
358
diaphragmatic dysfunction in the critically ill patient with ultrasound: a systematic review. Intensive Care 359
Medicine 43: 29-38, 2017.
360
19
Tables
362
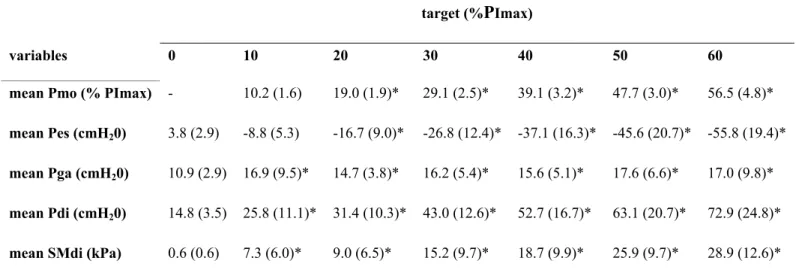
Table 1. Pressures and diaphragm shear modulus during apnea and during isovolumetric inspiratory efforts
363
against closed airways. 364
target (%PImax)
variables 0 10 20 30 40 50 60
mean Pmo (% PImax) - 10.2 (1.6) 19.0 (1.9)* 29.1 (2.5)* 39.1 (3.2)* 47.7 (3.0)* 56.5 (4.8)*
mean Pes (cmH20) 3.8 (2.9) -8.8 (5.3) -16.7 (9.0)* -26.8 (12.4)* -37.1 (16.3)* -45.6 (20.7)* -55.8 (19.4)* mean Pga (cmH20) 10.9 (2.9) 16.9 (9.5)* 14.7 (3.8)* 16.2 (5.4)* 15.6 (5.1)* 17.6 (6.6)* 17.0 (9.8)* mean Pdi (cmH20) 14.8 (3.5) 25.8 (11.1)* 31.4 (10.3)* 43.0 (12.6)* 52.7 (16.7)* 63.1 (20.7)* 72.9 (24.8)* mean SMdi (kPa) 0.6 (0.6) 7.3 (6.0)* 9.0 (6.5)* 15.2 (9.7)* 18.7 (9.9)* 25.9 (9.7)* 28.9 (12.6)*
Data are shown as mean (SD). Data from two trials for each condition were averaged. Target (% PImax),
365
targeted pressure expressed as a percentage of maximal voluntary isovolumetric inspiratory pressure with 0% 366
PImax corresponding to measurements during apnea at functional residual capacity ; mean Pmo (% PImax), 367
mean mouth pressure expressed as a percentage of PImax; Pes, esophageal pressure; Pga, gastric pressure; Pdi,
368
transdiaphragmatic pressure, SMdi, diaphragm shear modulus.*significantly different from 0% PImax (p < 369
0.05). 370
20
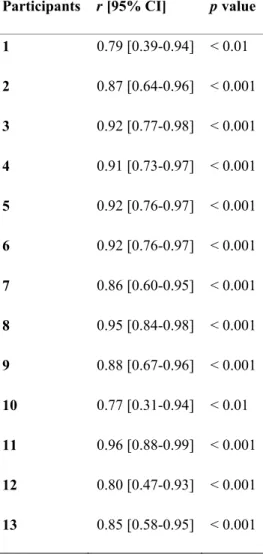
Table 2. Relationship between diaphragm shear modulus during isovolumetric inspiratory efforts against closed
371
airways in all participants. 372
Participants r [95% CI] p value
1 0.79 [0.39-0.94] < 0.01 2 0.87 [0.64-0.96] < 0.001 3 0.92 [0.77-0.98] < 0.001 4 0.91 [0.73-0.97] < 0.001 5 0.92 [0.76-0.97] < 0.001 6 0.92 [0.76-0.97] < 0.001 7 0.86 [0.60-0.95] < 0.001 8 0.95 [0.84-0.98] < 0.001 9 0.88 [0.67-0.96] < 0.001 10 0.77 [0.31-0.94] < 0.01 11 0.96 [0.88-0.99] < 0.001 12 0.80 [0.47-0.93] < 0.001 13 0.85 [0.58-0.95] < 0.001
r [95% CI], Pearson correlation coefficient with lower and higher 95% confidence intervals. 373
21
Table 3. Flow, pressures, and diaphragm shear modulus during unloaded ventilation and ventilation against
374
inspiratory threshold loading. 375
threshold loading (% PImax)
variables 0 10 20 30 40 50 Bf (breaths/min) 12.0 (2.2) 13.3 (2.8) 12.3 (2.8) 12.9 (3.1) 12.3 (3.0) 12.9 (4.2) EE Pes (cmH20) 4.3 (2.8) 2.8 (2.0) 2.4 (2.6) 4.1 (1.8) 6.3 (4.0) 7.1 (3.7)* VT (l) 0.5 (0.7) 0.8 (0.7) 0.8 (0.8) 0.6 (0.7) 0.6 (0.8) 0.5 (0.7) TI (s) 2.1 (0.3) 2.5 (0.5) 2.8 (0.6) 2.8 (0.6) 2.9 (0.8) 3.0 (1.0) VT/TI 0.2 (0.3) 0.4 (0.4) 0.3 (0.3) 0.2 (0.3) 0.2 (0.3) 0.2 (0.3) TI/TT 0.4 (0.0) 0.5 (0.1) 0.6 (0.1) 0.6 (0.1) 0.6 (0.1) 0.6 (0.1) mean Pch (cmH20) 4.1 (1.3) -12.9 (2.7)* -24.4 (5.8)* -36.4 (9.2)* -48.2 (10.8)* -59.2 (14.4)* Δ Pmo (% PImax) 1.7 (0.5) 19.6 (2.6)* 29.6 (3.6)* 39.0 (4.5)* 46.6 (6.6)* 54.2 (9.3)* Δ Pes (cmH20) -8.5 (2.6) -27.2 (9.9) -38.4 (14.6)* -48.2 (16.1)* -60.4 (18.9)* -67.8 (21.5)* Δ Pga (cmH20) 6.3 (2.2) 7.6 (5.2) 9.9 (6.1)* 10.1 (4.7)* 8.8 (2.6)* 8.7 (2.2)* Δ Pdi (cmH20) 10.4 (4.4) 29.8 (13.8)* 42.3 (18.3)* 49.4 (17.9)* 59.1 (20.9)* 63.6 (23.1)* max SMdi (kPa) 6.2 (3.6) 16.0 (8.5)* 24.3 (10.0)* 27.8 (13.8)* 32.5 (13.8)* 35.7 (13.4)*
Data are shown as mean (SD). Data from each cycle for a given loading level were averaged. Threshold loading 376
(% PImax), inspiratory threshold loading expressed as a percentage of maximal voluntary isovolumetric
377
inspiratory pressure with 0% PImax corresponding to unloaded ventilation; Bf, breathing frequency; EE Pes, 378
end-expiratory esophageal pressure; VT, tidal volume; TI, inspiratory time; VT /TI, tidal volume to inspiratory
379
time ratio i.e inspiratory flow; TI/TT, ratio of inspiratory to total time of the respiratory cycle i.e. duty cycle; 380
mean Pch, mean chamber pressure within the inspiratory loading device. Pmo, variation of mouth pressure 381
during inspiratory time; Δ Pmo, variation of mouth pressure during inspiratory time; Δ Pes, variation of 382
esophageal pressure during inspiratory time; Δ Pga, variation of gastric pressure during inspiratory time; Δ Pdi, 383
variation of transdiaphragmatic pressure during inspiratory time; max SMdi, maximal diaphragm shear modulus 384
22
during the inspiratory time. TFdi, diaphragm thickening fraction. *significantly different from unloaded 385
breathing i.e. threshold loading 0 % PImax (p <0.05). 386
23
Table 4. Relationship between diaphragm shear modulus during unloaded ventilation and ventilation against
387
inspiratory threshold loading in all participants. 388
Participants r [95% CI] p value 1 0.73 [0.59-0.83] < 0.001 2 0.85 [0.76-0.90] < 0.001 3 0.90 [0.84-0.94] < 0.001 4 0.90 [0.84-0.94] < 0.001 5 0.40 [0.18-0.59] < 0.001 6 0.79 [0.68-0.86] < 0.001 7 0.86 [0.77-0.91] < 0.001 8 0.87 [0.80-0.92] < 0.001 10 0.55 [0.21-0.78] < 0.01 12 0.44 [0.22-0.61] < 0.001 13 0.67 [0.47-0.80] < 0.001 14 0.82 [0.73-0.89] < 0.001 15 0.76 [0.64-0.85] < 0.001
r [95% CI], Pearson correlation coefficient with lower and higher 95% confidence intervals. 389
24
Figures
390
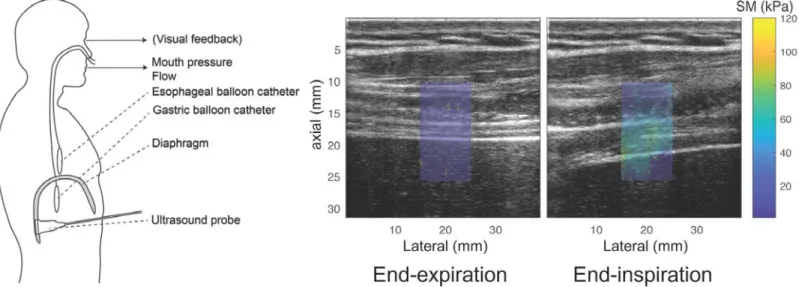
Figure 1. Overview of the experimental setup.
391
392
The left panel shows the experimental setup with respiratory measurements and intercostal diaphragm 393
ultrasound imaging. Visual feedback of generated mouth pressure and guidelines were provided during 394
isovolumetric inspiratory efforts against closed airways. The right panel shows the shear modulus (SM) map in 395
kPa measured using shear wave elastography overlaid with standard B-Mode at expiration and end-396
inspiration during ventilation against inspiratory threshold loading. 397
25
Figure 2. Typical measurements during isovolumetric inspiratory efforts against closed airways in participant
398 #3. 399
400
Pmo, mouth pressure; Pes, esophageal pressure; Pga, gastric pressure; Pdi, transdiaphragmatic pressure, SMdi, 401
diaphragm shear modulus. 402
26
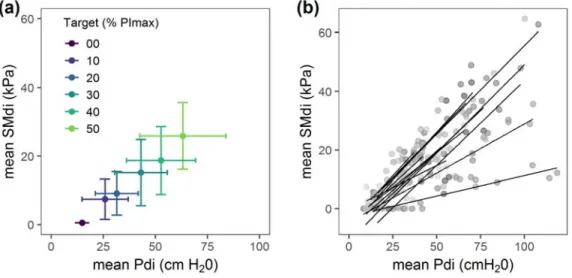
Figure 3. Relationship between transdiaphragmatic pressure and diaphragm shear modulus during submaximal
404
isovolumetric inspiratory efforts against closed airways (n=13). 405
406
Panel (a): average values per condition i.e. apnea at functional residual capacity and submaximal isovolumetric 407
inspiratory efforts at 10, 20, 30, 40, 50 % of maximal inspiratory pressure (PI max). Panel (b): all data points
408
with individual linear regression lines; mean SMdi, mean diaphragm shear modulus; mean Pdi, mean 409
transdiaphragmatic pressure. 410
27
Figure 4. Individual data points illustrating relationship between transdiaphragmatic pressure and diaphragm
411
shear modulus during submaximal isovolumetric inspiratory efforts against closed airways. 412
413 414
28
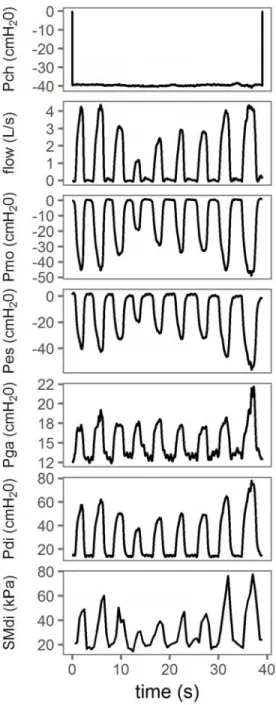
Figure 5. Typical measurements during ventilation against inspiratory threshold loading in participant #1.
415
416
Pch, chamber pressure with the inspiratory threshold loading device; Pmo, mouth pressure; Pes, esophageal 417
pressure; Pga, gastric pressure; Pdi, transdiaphragmatic pressure, SMdi, diaphragm shear modulus. 418
29
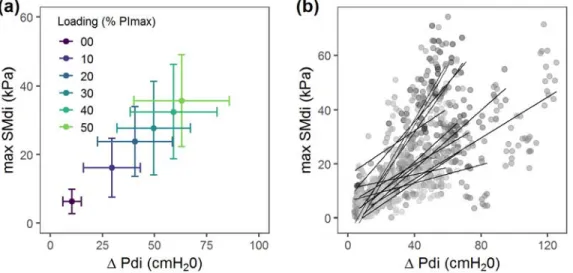
Figure 6. Relationship between transdiaphragmatic pressure and diaphragm shear modulus during unloaded
419
ventilation and ventilation against inspiratory threshold loading (n=15). 420
421
Panel (a): average values per condition i.e. spontaneous ventilation capacity and ventilation against inspiratory 422
threshold loading at 10, 20, 30, 40, 50 % of maximal inspiratory pressure (PI max). Panel (b): all data points
423
with individual linear regression lines. max SMdi, maximal diaphragm shear modulus during the inspiratory 424
time; Δ Pdi, variation (swing) of transdiaphragmatic pressure during the inspiratory time. 425
30
Figure 7. Individual data points illustrating relationship between transdiaphragmatic pressure and diaphragm
426
shear modulus during unloaded ventilation and ventilation against inspiratory threshold loading. 427
428
max SMdi, maximal diaphragm shear modulus during the inspiratory time; Δ Pdi, variation (swing) of 429
transdiaphragmatic pressure during the inspiratory time; loading (% PImax), inspiratory threshold loading
430
expressed as a percentage of maximal inspiratory pressure. 431