HAL Id: hal-00808037
https://hal.inria.fr/hal-00808037
Submitted on 5 Apr 2013
HAL is a multi-disciplinary open access
archive for the deposit and dissemination of
sci-entific research documents, whether they are
pub-lished or not. The documents may come from
teaching and research institutions in France or
L’archive ouverte pluridisciplinaire HAL, est
destinée au dépôt et à la diffusion de documents
scientifiques de niveau recherche, publiés ou non,
émanant des établissements d’enseignement et de
recherche français ou étrangers, des laboratoires
Rakebul Hasan, Fabien Gandon
To cite this version:
Rakebul Hasan, Fabien Gandon. Summarized Explanations from Linked Justifications. [Research
Report] RR-8279, Inria. 2013. �hal-00808037�
0249-6399 ISRN INRIA/RR--8279--FR+ENG
RESEARCH
REPORT
N° 8279
April 2013Explanations from
Linked Justifications
RESEARCH CENTRE
SOPHIA ANTIPOLIS – MÉDITERRANÉE
Rakebul Hasan, Fabien Gandon
Project-Teams Wimmics
Research Report n° 8279 — April 2013 — 23 pages
Abstract: A user of a Semantic Web application may not trust its results because he may not understand how the application produces its results using distributed data and inferential ca-pabilities. Explanation-aware Semantic Web applications provide explanations of their reasoning - explaining why an application has performed a given step or which information it has used to derive a new piece of information. However, providing too much and irrelevant information in explanations may overwhelm the users, especially the non-expert users. In this paper, we discuss an approach to explain reasoning over Linked Data. We introduce a vocabulary to describe justi-fications and we discuss how publishing justijusti-fications as Linked Data enables explaining reasoning over Linked Data. Finally, we discuss how to summarize explanations with relevant information taking into account user specified explanation filtering criterion.
r´esultats, car il peut ne pas comprendre comment l’application produit ses r´esultats `a l’aide de ses capacit´es inf´erentielles et de donn´ees distribu´ees. Les applications Web s´emantique sensibles aux explication fournissent des explications de leurs raisonnements - pour expliquer pourquoi une ´etape a ´et´e effectu´e ou quelles informations ont ´et´e utilis´ees pour cette ´etape. Cependant, fournir trop d’informations parfois non pertinentes dans les explications peut submerger les utilisateurs, en particulier ceux non-experts. Dans cet article, nous discutons d’une approche pour expliquer le raisonnement sur le web des donn´ees li´ees. Nous introduisons un vocabulaire pour d´ecrire les justifications et nous montrons comment publier des justifications en tant que donn´ees li´ees pour expliquer les raisonnements sur le web des donn´ees li´ees. Enfin, nous discutons de la fa¸con de r´esumer les explications par des information pertinente en fonction des crit`eres de filtre d’explication sp´ecifi´es par l’utilisateur.
Mots-cl´es : Explication, justification, r´esum´e, web des donn´ees li´ees, web des justifications li´ees
Contents
1 Introduction 3
2 Motivating Scenarios 4
2.1 Explaining Large-Scale Reasoning over Linked Data . . . 4
2.2 Explaining Smart Applications . . . 4
3 Linked Justifications 5 3.1 Ratio4TA . . . 5
3.2 Explanations from Linked Justifications . . . 7
4 Summarizing Explanations 9 4.1 Ranking . . . 12 4.2 Re-Ranking by Coherence . . . 12 5 Evaluation 13 5.1 Evaluation Context . . . 13 5.2 Evaluation Matrices . . . 14 5.2.1 Cosine Similarity . . . 14 5.2.2 Compression Ratio . . . 14
5.2.3 Normalized Discounted Cumulative Gain . . . 15
5.2.4 Recall, Precision, and F-score . . . 15
5.3 Analysis of Ground Truths . . . 16
5.4 Evaluation of Explanation Summarization Measures . . . 16
5.5 Evaluation of Summaries of Explanation . . . 18
6 Related Work 20
7 Conclusion and Future Work 20
1
Introduction
Semantic Web applications use inferential capabilities and distributed data in their reasoning. Users often find it difficult to understand how these applications produce their results. Hence, users often do not trust the results these applications produce. Explanation-aware Semantic Web applications provide explanations of their reasoning - explaining why an application has preformed a given step or which facts it used to derive a new fact. Explanations enable users to better understand reasoning of these application. Users have more details about how an application produce a given result or why it has performed a step in its reasoning. Explanations help users to decide whether to trust a result or an application.
The emergence of Linked Data enables large-scale reasoning over heterogeneous and dis-tributed data. Explaining reasoning over Linked Data requires explaining how these disdis-tributed data were produced. Publishing also the explanation related metadata as Linked Data enables such explanations. Justifications are metadata about how a given piece datum is obtained. We introduce the concept of Linked Justification in this paper. We present a vocabulary to describe justifications and guidelines to publish these justifications as Linked Data.
The existing explanation-aware Semantic Web applications inherit explanation features from explanation-aware expert systems. These explanations are targeted to expert users, such as knowledge engineers, with detailed information about all the execution steps of reasoners of
these applications. Unlike the expert systems, users of Semantic Web applications have diverse background - from expert knowledge engineers who are interested in every details of the rea-soning, to regular users who do not have any background in rearea-soning, logic, or ontologies. These non-expert users might feel overwhelmed with all the execution details of reasoners. To address this issue, we provide summarized and relevant explanations to users. Users can spec-ify their explanation filtering criterion - types of information they are interested in. We take into consideration the explanation filtering criterion when we present explanations and summa-rize explanations. We use centrality and similarity matrices to summasumma-rize and provide relevant explanations.
This paper is structured as follows: in Section 2, we present two motivating scenarios. We present the concept of Linked Justifications and how to generate explanations from Linked Jus-tifications in Section 3. In Section 4, we present our approach to summarize explanations. In Section 5, we present an evaluation of our explanation summarization approach. Then in Sec-tion 6, we present the related work. Finally, we conclude and discuss the future work in SecSec-tion 7.
2
Motivating Scenarios
In this section, we present explanation scenarios from two perspectives: (i) in subsection 2.1, need for explanations for expert users such as knowledge engineers(ii) in subsection 2.2, need for explanations for non-expert users such as regular end-users.
2.1
Explaining Large-Scale Reasoning over Linked Data
In the recent years, we have seen an increasing growth of publishing Linked Data. We have seen datasets published from community driven efforts, governmental bodies, scientific communities, and corporate bodies [4]. These datasets are interlinked1 and use RDFS/OWL schemata. This
presents opportunities of large-scale data integration and reasoning over cross-domain data. In this scenario, knowledge engineers might need explanations for debugging or understanding on-tologies. In addition, performance related explanations can help knowledge engineers to optimize performance (e.g. identifying most frequent failure point in a query). In such a scenario with large ontologies, a knowledge engineer may want to focus on a specific part of an explanation with a lot of details. A knowledge engineer may want a short explanation to have a quick under-standing. A real world example of this scenario would be FactForge2. FactForge integrates data
from some of the central datasets and materialize the process of storing inferred knowledge -the inferred facts with respect to OWL 2 RL3.
2.2
Explaining Smart Applications
Smart applications such as recommendation systems are potentially effective applications of the Semantic Web for end-users. Such an application can use inference and distributed data to produce its results. A users - without sufficient knowledge of ontology or knowledge engineering - of such a smart application may want to know why the application has produced an output or taken an action. The application should explain to justify its action in this scenario. However, providing explanations with too much details may overwhelm such a user. Smart applications should be able to provide easy to understand and concise explanations.
1See http://richard.cyganiak.de/2007/10/lod/ for a graph of these datasets and their interlinkage.
2http://factforge.net/
3
Linked Justifications
In this section, we first discuss how we can explain in in a distributed settings. We introduce the concept of Linked Justification. We present a vocabulary to publish justifications as Linked Data. Finally, we present an algorithm to generate explanations from Linked Justifications.
McGuinness et al. [14] discuss the importance of distributed and portable justifications, and subsequently present justifications as user-friendly explanations. With the increasing growth of sharing Semantic Web data as part of the Linked Data [3] initiatives, it is important that data publishers can publish their data with explanation related metadata with ease. Explanation infrastructures should be able to accommodate common data publishing principles. Semantic Web explanation infrastructures should also address heterogeneous and distributed nature of the Web. With regard to diversity of different representation, explanation metadata should be published promoting interoperability. The W3C PROV-DM data model [16] can be used as an interchange data model across different systems in this regard. Different systems can define their explanation metadata model as application-specific and domain-specific extensions of PROV-DM. Applications across the Web can then make sense of explanation metadata in a unified manner. Consumers of these explanation metadata can use explanation presentation and visualization tools according to their needs. Our work [9] on applying the Linked Data principles to publish explanation metadata - Linked Justifications - intent to address these issues.
Justifications are metadata about how a given piece of datum is obtained. In Linked Justifica-tions approach, an application can obtain such a piece of datum from other data pieces published as Linked Data. These involved data pieces can be located anywhere in the Web. Publishing justification metadata as Linked Data enables explaining distributed reasoning by following the links between justifications for involved data in a reasoning. We present the Ratio4TA4
vocab-ulary for describing justifications. Data publishers can use Ratio4TA describe metadata about their data and publish this metadata as Linked Data.
3.1
Ratio4TA
Ratio4TA (inter linked justifications for t riple assertions) is an OWL ontology for describing justifications. Ratio4TA allows data publishers to describe metadata about their data. For example, applications can describe their reasoning processes and links between their consumed and produced data using Ratio4TA.
Ratio4TA facilitates explanation of reasoning processes in a Web-scale. Applications can publish their data along with justification related metadata as Linked Data using Ratio4TA. Other applications can consume these data with justification metadata and provide explanations about their consumed data - generated from the justification metadata of the consumed data. In this way, applications can provide explanations of distributed reasoning processes by following the links between justifications.
Ratio4TA extends the W3C PROV Ontology5(specifically, PROV-O Working Draft 03 May
20126). This promotes interoperability by enabling data consumers process justification metadata
according to W3C PROV standards.
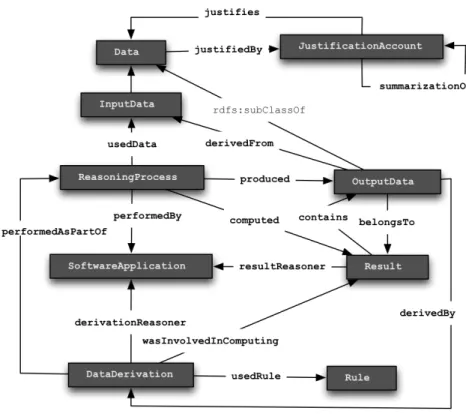
Figure 1 shows the core concepts and relations of Ratio4TA. It allows to describe data, reasoning processes, results, data derivations, rules, and software application. In addition the JustificationAccount class allows to define named graph containers of justification statements. A detailed specification of Ratio4TA with examples is available in its website.
4http://ns.inria.fr/ratio4ta/
5http://www.w3.org/TR/prov-o/
3.2
Explanations from Linked Justifications
We generate explanations from Linked Justifications by recursively following the links between involved justifications in a reasoning. Listing 1 shows an algorithm that recursively collects involved justification in for a derived RDF statement dst.
Algorithm 1 Generating explanation for an RDF statement
1: procedure GenerateExplanation(dst, depth) 2: if (depth > maxDepth) then
3: return 4: end if 5: CJ ST = GetJustificationMetaStatements(dst) 6: CKST = GetRDFKnowledgeStatements(CJST , dst) 7: J ST = J ST ∪ CJ ST 8: KST = KST ∪ CKST
9: for each statement in CKST do
10: GenerateExplanation(statement, depth + 1) 11: end for
12: end procedure
This algorithm crawls through the related justifications and constructs the derivation proof tree for a derived statement. We set a maximum depth limit to traverse by setting the global variable maxDepth. This is to avoid the algorithm falling into loops because of cyclic proof paths, or faulty justification metadata; also to allow generating proof tree with a maximum depth. We initially call procedure GenerateExplanation by setting dst to the derived statement for which we want to generate the proof tree, and by setting depth to 1 to start crawling from the depth one of the proof tree. Also, we initialize the set of justification statements J ST = ∅ and the set of knowledge statements KST = ∅. Justification statements for a RDF statements are the justification metadata statements that justify the RDF statement. Knowledge statements for a RDF statement are the statements from which the RDF statement is derived. After the procedure GenerateExplanation finishes executing, the set of justification statements JST will contain all the justification statements in the proof tree for the initial derived statement dst. Similarly,the set of knowledge statements KST will contain all the knowledge statements in the proof tree for the initial derived statement dst. These two variables J ST and KST are also global variables in our algorithm.
Line 2 checks the condition if the current depth exceeds the maximum depth and line 3 stops executing the current call of the procedure if the condition on line 2 holds. Line 5 collects all the justification statements for the current derived statement dst by calling GetJustification-MetaStatements and assigns the collected justification statements in the set CJ ST . The GetJustificationMetaStatements procedure collects the justification statements by follow-ing the r4ta:justifiedBy link for dst. Please note that GetJustificationMetaStatements should be made aware of where to find the r4ta:justifiedBy link for a derived RDF statement. This is a design decision for data publishers. As a common practice, data publisher for a dataset can specify inside a provenance container named graph which r4ta:JustificationAccount instance justifies which RDF statement and also publish the provenance container as Linked Data. Line 6 collects all the knowledge statements by calling GetRDFKnowledgeStatements and assigns the collected knowledge statements in the set CKST . The GetRDFKnowledgeStatements procedure collects all the knowledge statements from which the statement dst was derived by following the r4ta:derivedFrom links found in the current justification statements CJ ST . Line
7 updates J ST by a set union with already collected justification statements and CJ ST . Line 8 updates KST by a set union with already collected knowledge statements and CKST . Line 9 to 11 call the the GenerateExplanation procedure for each knowledge statement found in CKST (i.e. the current set of knowledge statements) by increasing depth by 1.
We call the derived RDF statement (dst in our algorithm initialization) that we are explaining, the root statement rs. We call the RDF graph formed by the set of knowledge statements union the root statement, the RDF knowledge graph KG:
KG = RDF Graph(KST ∪ rs)
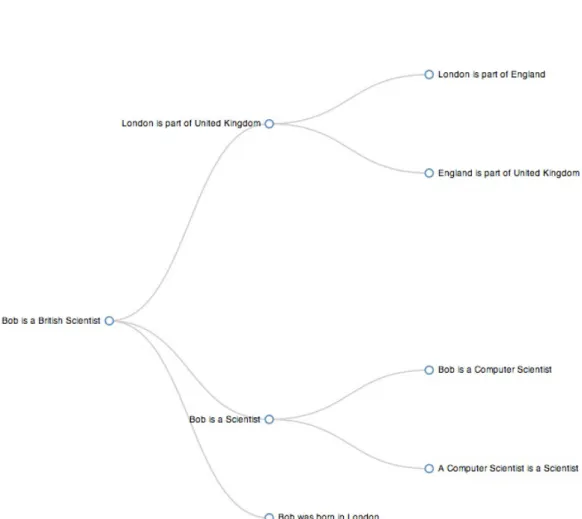
We provide explanations in natural language for the RDF statements in KG. Our expla-nations also include the information of proof tree hierarchy. Figure 2 shows an example of our explanation for a derived statement that “Bob is a British Scientist”. Each node of our expla-nation is an RDF knowledge statement. What we present in each node is a natural language representation of the RDF knowledge statement in that node. A node with children means that the RDF knowledge statement in that node is derived from the RDF knowledge statements of its children nodes.
This approach explains derivations of a given RDF statement with all the derivation steps upto a maximum depth in the derivation proof tree. However, explanations with the details of all the steps in a computation process may not be as useful for non-expert users as they are for expert users [2, 6, 10, 14]. Explanations should contain information with different degrees of detail taking into account the users’ expertise [14]. To address this issue, we propose providing summarized explanations with different size to different types of users. In next section, we discuss our approach to summarize explanations.
4
Summarizing Explanations
The users of Semantic Web applications can have different background, skill level, and knowl-edge level because of the open nature of the Web. Level of user expertise should be taken into account while providing explanations. The presentations of explanations can change according to user expertise or user scenario context. According to [2], explanation-aware applications in the Semantic Web should provide explanations with the features of provision of explanation with different degrees of detail and filtering explanation paths. In this paper, we propose summariz-ing explanations for providsummariz-ing explanations with different degrees of details. Our summarizsummariz-ing approach can also filter information in summarized explanations using filtering criterion. These filtering criterion can be a description of context related information or descriptions of what types of information a user is interested in to consume in explanations. Our explanation sum-marization approach provides a platform for personalized explanations for different contexts, as discussed in [2].
Given a RDF knowledge graph KG = (R, T ), where R is the set of resources and literals and T is the set of RDF statements. In addition, given the root statement rs, where KST = T \ rs, and the justification metadata statements JST. We provide summarized explanations by summarizing RDF statements from KST. We also use the term “oriented graph” to refer to KG throughout the paper. Consumers of our explanations can specify what kind information they are interested in. When we summarize an explanation, we take into consideration five aspect: (i) salience of RDF statements, (ii) similarity of RDF statements with respect to users’ filtering criterion, (iii) abstract statements. (iv) subtree weight in proof tree - weight with respect to the proof tree, (v) coherence. We first describe the first four aspects below and then we describe how we re-rank our explanation statements by coherence.
Salient RDF Statements The salience of an RDF statement indicates the importance of the RDF statement. We use degree centrality to compute salience of RDF statements. Degree centrality, CD, of a vertex in a graph is the number of links the vertex has. We use the
normalized degree centrality when we compute salience of RDF statements. Normalized degree centrality, CDN, is the degree centrality divided by the maximum possible degree
centrality. Given a graph G = (V, E), where V is the set of vertices, E is the set of edges, we compute CD(v) and CDN(v) for a vertex v ∈ V as following:
CD(v) = deg(v)
CDN(v) =
CD(v)
maxCD(V )
Here the graph G = KG with V = R and E = T for computing CD and CDN. For a
vertex v ∈ V , deg(v) is the number of links the vertex has. The value of maxCD(V ) is
the maximum value from the set of all degree centrality values - i.e. from the set {CD(v):
for each v ∈ V }. We compute the salience SSL(i) of an RDF statement i by taking the
weighted average of the normalized degree centrality of the subject of the RDF statement and the normalized degree centrality of the object of the RDF statement in KG. We use equal weights for the weighted average. We compute SSL(i) of an RDF statement i ∈ KST
as below:
SSL(i) = 0.5 × CDN(subjectOf (i)) + 0.5 × CDN(objectOf (i))
Here subjectOf (i) is the subject resource in RDF statement i, and objectOf (i) is the object resource or literal in RDF statement i. The SSL score gives us a collective importance
score of an RDF statement depending on the degree centrality of the nodes, representing the subject and the object, in the oriented graph represented by KG. We did not use the centrality of the predicate of statement while computing SSL because we wanted an
importance score representing the importance of the information in a statement but not the importance of the relation between the information.
Relevant RDF Statements The consumers of our explanations can specify a set of classes, F ilter, as their filtering criterion. Users can select these classes from the union of classes in the schemata used to describe KG. We use SC to refer to this union of all the classes in the used schemata.
F ilter ⊆ SC
When we summarize explanations, we rank the more relevant statements to the concepts given in filtering criterion higher. We use the approximate query solving feature [5] of Corese Semantic Web Factory7 to compute similarity. Corese implements a similarity feature, as a SPARQL extension, to compute conceptual similarity between two classes in a schema based on their semantic distance. For a statement i and a set of classes as user filtering criterion F ilter, we compute similarity SSM(i, F ilter), as following:
SSM(i, F ilter) =
1
3 × similaritynode(subjectOf (i), F ilter) +1
3× similaritynode(predicateOf (i), F ilter) +1
3× similaritynode(objectOf (i), F ilter)
For a statement i, subjectOf (i) returns the subject of the statement, predicateOf (i) re-turns the predicate of the statement, and objectOf (i) rere-turns the object of the statement. We compute similaritynode(j, F ilter) where j ∈ R ∪ SC as following:
similaritynode(j, F ilter) = maxSimilaritytype(j, F ilter) : if j ∈ SC
similaritynode(j, F ilter) = maxSimilaritytype(typesOf (j), F ilter) :
if j /∈ SC but j ∈ R
maxSimilaritytype(T ypes, F ilter) = max(
[
{similaritytype(m, F ilter) :
for each m ∈ T ypes})
similaritytype(m, F ilter) = {similaritycorese(m, n) : for each n ∈ F ilter}
In the above formalism, typesOf (j) for a resource j ∈ R gives us the set of classes T ypes ∈ SC of which j is an instance. For a class m ∈ T ypes and a class n ∈ F ilter, similaritycorese(m, n) computes a similarity score between class m and n ranging from 0.0
to 1.0 where 1.0 represent exact match and 0.0 represents completely not similar. The SSM
score for a statement with respect to F ilter indicates the similarity of the types of informa-tion specified in F ilter. One can also define other similar measures to match a descripinforma-tion of a context with explanation information for providing context-aware explanations. Abstract Statements Our abstraction measure resembles approaches using abstract
informa-tion for summarizing texts [7]. We consider a statement that is close to the root, rs, of the proof tree that J ST represents is more abstract than a statement that is far from the root rs. A node in the proof tree represents an RDF statement in KG. A link in the proof tree represents a r4ta:derivedFrom link. We define the distance of a node in the proof tree from the root node as the level in which the node belongs. The root node belongs to level one in the proof tree. The root node is derived from the nodes in level two. A node in level two is derived from the linked nodes in level three, and so on. For a statement i ∈ KST , we compute the abstraction score, SAB(i), as following:
SAB(i) =
1 level(i)
The function level(i) gives the the level in which the statement i belongs in the proof tree. Subtree Weight in Proof Tree We also consider salience of the statements in KST with respect to their proof tree positions. We take all the subtrees of proof tree with root i ∈ KST . For a subtree with root i, we compute the subtree weight of the statement i by taking the average score of all the statements in that subtree.
SST(i) =
X
j∈subtree((i)
score(j) | subtree((i) |
The subtree(i) function returns the subtree of proof tree with root i. The score(j) for a statement j here can be combinations of SSL(j), SSM(j, F ilter), and SAB(j). We discuss
4.1
Ranking
We rank the statements in KST by different combinations of their computed scores. Taking n statements, where n ≤| KST |, will give a summarized list of n statements which can explain rs. We compute the statement score, score(i) where i ∈ KST , by taking weighted average of different combinations of SSL(i), SSM(i, F ilter), and SAB(i) with equal weights .
For the most salient statements, we compute score(i) as following:
score(i) = SSL(i) (1)
We compute score(i) for the most salient and abstract statements as following:
score(i) = 0.5 × SSL(i) + 0.5 × SAB(i) (2)
For the most salient statements taking the user’s filtering criterion, F ilter, into account, we compute score(i) as following:
score(i) = 0.5 × SSL(i) + 0.5 × SSM(i, F ilter) (3)
We compute score(i) for the most salient and abstract statements taking the user’s filtering criterion, F ilter, into account as following:
score(i) = 1 3 × SSL(i) + 1 3× SAB(i) +1 3× SSM(i, F ilter) (4)
For the most salient statements with respect to the proof tree positions of the statements, we compute score(i) as below:
score(i) = SST(i) (5)
As we showed before, computation of SST(i) requires already computed score(i). This score(i)
values can be again combinations of SSL(i), SSM(i, F ilter), and SAB(i).
4.2
Re-Ranking by Coherence
In text summarization, an ideal summary will include coherent and readable texts [7]. An ideal ontology summary should also be expressed in a coherent way [19]. In our case, a RDF statement a is coherent to a RDF statement b if a is directly derived from b. The authors of [19] discuss that it is not possible to satisfy the coherence requirement during the extraction process of a summary. They suggest re-ranking an ontology summary by coherence measure after the initial extraction process. We follow a similar approach to satisfy our coherence requirement.
Let R is a ranked list of RDF statements by their scores; S is a list of already selected RDF statements in the summary; i is the next RDF statement to be selected. i should satisfy that:
i = arg max
i∈R\S
(0.5 × score(i) + 0.5 × reward(i, S))
In the above formalism, reward(i, S) is the amount of potential contribution value - ranging from 0.0 to 1.0 - of i to the total coherence of the summary of i is added to S. We compute reward(i, S) as following:
reward(i, S) = 1 − coherent(S) coherent(S ∪ i)
In a set of statements S, coherent(S) is the number of coherent statements. We define coher-ence of an RDF statement in KST with respect to the positions of the statements in the proof tree that the statements in J ST represents. The RDF statements a and b are coherent if the following condition hold:
(name(a) r4ta:derivedFrom name(b)) ∈ J ST where a ∈ KST and b ∈ KST
Here name(k) is the name of the statement k. As we discuss earlier, we used named graphs to assign unique names to each statements. (name(a) r4ta:derivedFrom name(b)) represents an RDF statement with name(a) as the subject, r4ta:derivedFrom as the predicate, and name(b) as the object of the statement.
5
Evaluation
Our evaluation methodology builds on ontology summary evaluation [13] and text summary evaluation methodologies [7, 18]. Generally, evaluating summarizing technologies include mea-suring the agreement between human-generated summaries - known as “ground truths” - and automatically generated summaries.
In this section, we present the evaluation of our explanation summarization methodology. We preformed a survey to find ground truth summaries of explanations. We then measured the agreement between the automatically generated summarized explanations by our methodol-ogy and the ground truth summarized explanations using evaluation measures drawn from the information retrieval and summary evaluation literatures.
5.1
Evaluation Context
For the purpose of our study, we selected a subset of geographical locations from GeoNames8and
a subset of artists, events, and places from DBPedia9, then derived new information from these
selected subsets. Our ad-hoc reasoner infers new RDF statements with respect to RDFS type propagation; and owl:sameAs and transitivity of parentFeature property of GeoNames schema. For example, given the statements:
g e o n a m e s : 3 0 1 7 3 8 2 owl : s a m e A s d b p e d i a : F r a n c e .
g e o n a m e s : 2 9 8 5 2 4 4 gno : p a r e n t F e a t u r e g e o n a m e s : 3 0 1 7 3 8 2 .
The reasoner infers the following statement:
g e o n a m e s : 2 9 8 5 2 4 4 gno : p a r e n t F e a t u r e d b p e d i a : F r a n c e .
Assuming the following statements are also given:
g e o n a m e s : 6 4 4 7 1 1 3 gno : p a r e n t F e a t u r e g e o n a m e s : 2 9 8 5 2 4 4 . g e o n a m e s : 6 4 4 7 1 1 3 owl : s a m e A s d b p e d i a : Carry - le - R o u e t .
The reasoner infers:
d b p e d i a : Carry - le - R o u e t gno : p a r e n t F e a t u r e d b p e d i a : F r a n c e .
Now, suppose that DBPedia specifies Nina Simone’s death place as Carry-le-Rouet:
d b p e d i a : N i n a _ S i m o n e dbpedia - owl : d e a t h P l a c e d b p e d i a : Carry - le - R o u e t .
8http://www.geonames.org/
And our reasoner inferred that Carry-le-Rouet is part of France. Therefore, the reasoner can infer that Nina Simone died in France, even though it was not originally specified in our initial data:
d b p e d i a : N i n a _ S i m o n e dbpedia - owl : d e a t h P l a c e d b p e d i a : F r a n c e .
In addition to inferring new statements, our reasoner generates justification for each derivation it performs. We generate explanations in natural language from these justifications by using the labels involved classes, instances, and properties.
In a test case, we give the participants a query and the answer for the query with its ex-planation all in natural language. We ask the participants to rate the effectiveness of each of the statements in the explanation from a range of 1 to 10. As our algorithms can take users’ filtering criterion and provide relevant explanations to the concepts provided in filtering criterion, we give the the same query, answer, and the explanation for the answer but this time with a user’s filtering criteria class taken from the schemata used in the reasoning process. We ask the participants again to rate the effectiveness of each of the statements in the explanation from a range of 1 to 10.
The rankings of the explanation statements produced by their ratings are the ground truths for our study. We used one test case for this study. We surveyed 9 people from different backgrounds: 4 computer scientists, 1 journalist, 1 psychologist, 1 biologist, and 1 business administrator. 44% of the participants were female and 56% of them were male. 56% had knowledge of RDF and 44% did not have any knowledge of RDF. The ages of the participants range from 22 to 31.
5.2
Evaluation Matrices
5.2.1 Cosine Similarity
We use cosine similarity to measure agreements between ratings produced by the survey partic-ipants. Cosine similarity, CSM , between two vectors x and y is defined as:
CSM (x, y) = x · y k x kk y k
The cosine similarity value ranges from -1 to 1. The value -1 means exactly opposite, the value 1 means exactly the same, and the value 0 indicates independence. We consider a participant’s rating scores for all statements in an explanations as a vector. We interpret the cosine similarity between two such rating vectors as the agreement between the two associated ratings.
5.2.2 Compression Ratio
Given an explanation E and the summary S for this explanation. Compression Ration CR is the ratio of the size of the summarized explanation S to the size of original explanation E:
CR = size(S) size(E)
CR represents a normalized size of the summarized explanation. A good summary of an expla-nation will have a low CR and a high rate of important information of the original explaexpla-nation where importance is defined by the users [7]. Below, we discuss a few more measures which allow us to understand this notion of importance with respect to the opinions of users.
5.2.3 Normalized Discounted Cumulative Gain
The discounted cumulative gain (DCG) [11, 15] measures the quality of results of an Information Retrieval (IR) system in a ranked list. DCG assumes that judges have graded each item in a list of results. Using these grades, DCG measures the usefulness, or gain, of a ranked list of results. DCG penalizes high quality results appearing lower in a ranked list of results. Given the grades of items in a list result - reli representing the grade of the result at position i, DCG at rank p
is defined as: DCGp = rel1+ p X i=2 reli log2(i)
Normalized Discounted Cumulative Gain (nDCG) allows to calculate and compare this measure across multiple lists of results where each of the lists might have different length. nDCG at rank p is computed by dividing DCGpby the maximum possible DCG at rank p - also known as Ideal
Discounted Cumulative Gain (IDCG) at rank p: nDCGp=
DCGp
IDCGp
nDCG values are in the interval 0.0 to 1.0. For a ranked list, a nDCGpvalue of 1.0 means that
the ranking is perfect at rank p with respect to the ideal ranking produced by ranking the results based on grades. A nDCGp value of 0.0 means that the ranking is completely imperfect p with
respect to the ideal ranking. In our evaluation, we convert the normalized size of the summary CR for different summaries to p as below:
p = CR ∗ size(E)
This allows us to compare different summaries with different compression ratios - hence with different p - using nDCG.
Our algorithms produce ranked list of explanation statements. We consider the rating scores by the participants as grades. The average of ratings by all the participants for a statement s gives us the ground truth rating for s. For n survey participants, we compute the ground truth rating reli for a statement at position i of a ranked list of explanation statements as below:
reli= n X j=1 rating(i, j) n
In the above formalism, rating(i, j) represents the rating for the statement at position i in a ranked list of explanation statements by survey participant j.
5.2.4 Recall, Precision, and F-score
We measure the performance of our summarization algorithms using Recall and P recision com-posite scores as in text summarization [7]. Recall and Precision quantify how closely the sum-marized explanations generated by algorithms correspond to the human produced sumsum-marized explanations. For each summary, we let correct = the number of statements selected by the algorithm and the human; wrong = the number of statements selected by the algorithm but not by the human; and missed = the number of statements selected by the human but not by the algorithm. We calculate Recall and P recision scores as below:
Recall = correct correct + missed
P1 P2 P3 P4 P5 P6 P7 P8 P9 avg.
Without F ilter 0.6906 0.7782 0.80 0.7866 0.7829 0.7944 0.8181 0.8462 0.8045 0.789 With F ilter 0.7519 0.6876 0.706 0.6696 0.6471 0.5704 0.6772 0.7492 0.718 0.686
Table 1: Agreements between ground truths measured by cosine similarity.
P recision = correct correct + wrong
Recall reflects how many good statements the algorithm missed, and P recision reflects how many of the algorithm’s selected statements are good.
F-score is a composite measure of Recall and P recision. We use the basic F-score discussed in [18]:
F = 2 × P recision × Recall P recision + Recall
5.3
Analysis of Ground Truths
As we discuss before, our ground truths are the rankings of the explanation statements produced by their ratings. We compute the agreement between two ground truths by computing cosine similarity between their ratings. Table 1 shows the agreement among the survey participants for the two scenarios - without F ilter and with F ilter - we evaluate for a test case. Each entry shows the average agreement between a survey participant to the other survey participants. The rightmost column shows the total average agreement for a scenario. The average agreements for both the scenarios are high. However, with F ilter the participants agree less. In the scenario with F ilter, the participants have to also consider the extra factor of similarity to the concepts provided as user filtering criterion. This contributes to the lower agreement when user filtering criterion are given. From these high agreements, we can conclude that the survey participants highly agree on what is effective as an explanation.
5.4
Evaluation of Explanation Summarization Measures
For the two scenarios - without F ilter and with F ilter, we take different combinations of our measures SSL, SST, and SAB. In the case of with F ilter, we do the filtering using SSM, and
therefore SSM is combined with the different combinations of our measures. Finally, we re-rank
by coherence the ranked list of explanation statements produced by the different combinations of measures for both without F ilter and with F ilter scenarios. In the figures, re-rank is shown as SCO.
We compute the gold standard ranking of the statements of an explanation by ranking the statements by their average ratings - i.e. the ground truth ratings. As we have two scenarios (without and with F ilter), we have two gold standard rankings. The gold standard rankings reflect the collective opinions of survey participants.
For the case of without F ilter, we also evaluate sentence graph summarization [19]. As the authors suggest, we use 0.8 as the navigational preference p value. We denote sentence graph summarization as SSG. We do not consider sentence graph summarization for with F ilter
sce-nario because sentence graph summarization does not provide a feature for filtering information based on ontology concepts as filtering criterion.
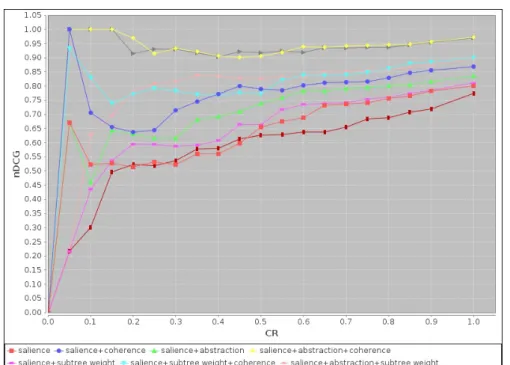
Figure 3 shows the nDCG values of different combinations of our summarization measures, and the sentence graph summarization for summaries with different sizes for the scenario of without F ilter. In the x-axis, we have compression ratio CR. The y-axis represents nDCG.
Figure 3: Quality of rankings produced by various combinations summarization measures without F ilter.
The measures salience + abstraction + coherence (SSL+ SAB+ SCO) and salience +
ab-straction + subtree weigh + coherence (SSL+ SAB+ SST + SCO) gives the best results for the
scenario of without F ilter. This means that the participants consider central (with respect to the oriented graph and the proof tree), abstract, and coherent information as effective infor-mation in explanation summaries. The nDCG values in the CR value interval 0.05 to 0.2 are particularly interesting for these two combinations of measures because we have small summaries with very similar rankings to the gold standard rankings. For the CR value interval 0.05 to 0.15, nDCG values are 1.0 for these two combinations, meaning the rankings are perfect rankings with respect to the gold standard rankings. The nDCG for the rest of the CR values for these two combinations are also close to 1.0. This means that for the rest of the CR values, these two combinations produce similar rankings to the gold standard rankings. The sentence graph summarization algorithm performs poorly for summarizing explanations. For a short summary, CR interval 0.05 to 0.2, the best nDCG value as low as 0.52. This shows that our explana-tion summarizaexplana-tion algorithms perform significantly better than sentence graph summarizaexplana-tion algorithm when there is no filtering criterion.
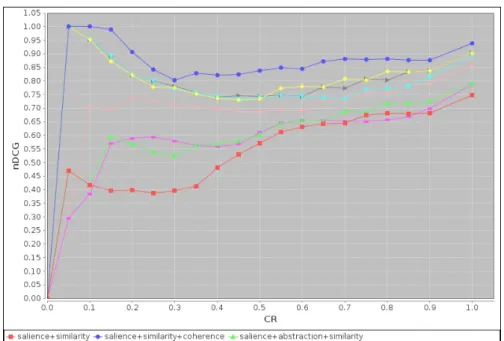
Figure 4 shows the nDCG values of different combinations of our summarization measures with F ilter for summaries with different sizes. We use the SSM measure to filter information
similar to concepts in F ilter. For this reason, all the combinations in this case have SSM measure.
For the scenario of with F ilter, the combination salience + similarity + coherence (SSL+
SSM+SCO) performs best. This means that the survey participants consider central (with respect
to oriented graph), similar (with respect to the concepts in F ilter), and coherent information as effective information in the summarized explanations. The nDCG values in the CR value interval 0.05 to 0.2 are particularly interesting this combination of measures because in this interval we
Figure 4: Quality of rankings produced by various combinations summarization measures with F ilter.
have small summaries with very similar rankings to the gold standard rankings. For the CR values after this interval, the nDCG values are also high, ranging from 0.8 to 0.95. However, the best performance in the scenario of with F ilter is not as good as the best performance in the scenario of without F ilter. This is again due to the fact that the survey participants had to consider the extra factor of similarity. Similarity is a very broad concept and peoples opinions about similarity vary greatly [8, 12]. It is hard to develop algorithms with a common understanding of similarity. Therefore, our algorithms perform a little worse in the scenario when they filter information using similarity than the scenario when there is no filtering using similarity.
5.5
Evaluation of Summaries of Explanation
We evaluate the quality of summarized explanations by comparing them to gold standard sum-marized explanations. We generate the gold standard sumsum-marized explanation for an explanation by taking statements with ground truth ratings greater than or equals to a threshold value th where the ground truth rating for each statement is scaled to 1.0. We set th to 0.6 for our gold standard summarized explanations. This allows us to get the top statements rated by the survey participants for a given explanations.
We use F-score to measure the quality of summarized explanations. F-score reflects accu-racy with respect to the gold standard summary. A desirable situation would a summarized explanation with high F-score value and low CR value. As in the evaluation of measures in sub-section 5.4, we have the same scenarios (without and with F ilter) and the same combinations of measures. We have two gold standard summarized explanations generated with th set to 0.6.
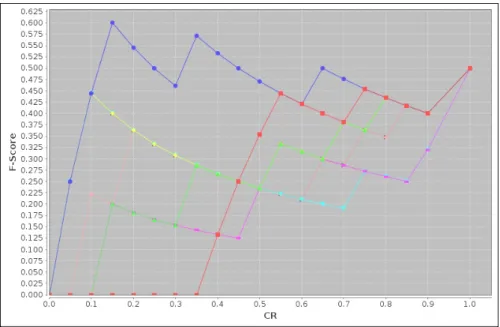
Figure 5 shows compression ratio of summarized explanations against F-score for the scenario without F ilter. Figure 6 shows compression ratio of summarized explanations against F-score for the scenario with F ilter.
Figure 5: Compression ratio (CR) vs F-score without F ilter.
As Figure 5 shows for the scenario without F ilter, we get the best F-score of 0.83 when CR value is 0.35 by the measure combination salience + abstraction + subtree weight (SSL+ SAB+
SST). However, the F-Score values of 0.75 and 0.80 respectively for CR values 0.15 and 0.25 by
the measure combinations salience + abstraction + coherence (SSL+ SAB+ SCO) and salience +
abstraction + subtree weigh + coherence (SSL+ SAB+ SST+ SCO) are more desirable because
the size of the summaries are smaller. This again confirms that the participants consider central (with respect to the oriented graph and the proof tree), abstract, and coherent information as effective information in explanation summaries. The sentence graph summarization again performs worst with a best F-score value of 0.25 in the CR interval 0.1 to 0.3. This shows that our summarized explanations are significantly more accurate than the summarized explanations generated by sentence graph summarization algorithm when there is no filtering criterion.
For the scenario with F ilter, the best F-score value 0.6 is lower than the best F-score value 0.83 for the scenario without F ilter. This is again due to the fact that the survey participants had to consider the extra factor of similarity to filter information in the explanations. The measure combination salience + similarity + coherence (SSL+ SSM + SCO) achieves the F-score value
0.6 when the CR value is 0.15. This is a desirable situation because the size of the summary is small. This again confirms that survey participants consider central (with respect to the oriented graph), similar (with respect to the concepts in F ilter), and coherent information as effective information in the summarized explanations.
Figure 6: Compression ratio (CR) vs F-score with F ilter.
6
Related Work
According to our knowledge, there is no comparable published work on summarizing explanations in the Semantic Web. But researchers have studied ontology summarization. RDF Sentence graph based summarization [19] extracts RDF Sentences based on centrality measures. Our work has a similar approach to sentence graph summarization approach. However, we define new measures for summarizing explanations. Peroni et al. [17] discuss how to identify key concepts in an ontology. They draw summarization criterion from cognitive science (natural categories), network topology (density and coverage), and lexical statistics (term popularity). Alani et al. [1] discuss shrinking an ontology by analyzing the usage of the ontology. Alani et al. analyze the query log against an ontology to understand the important parts of the ontology. The work of Peroni et al. and Alani et al. focus on a concept level summarization of ontologies. In contrast, our focus is on statement level.
7
Conclusion and Future Work
In this paper, we discuss generating explanations from Linked Justifications. We present an approach to summarize these explanations. We presented five different measures to summarize explanations. We compared different combinations of these measures to evaluate our summarized explanations. The evaluation showed that the combinations of salience, abstraction, and coher-ence; salience, abstraction, subtree weigh, and cohercoher-ence; and salience, similarity, and coherence have good performances.
and summarized explanations using different kinds of user interfaces and user interactions. We would like to explore how we can effectively use the summarization rankings while presenting information in personalized and context dependent summarized explanations. In addition, we would are going to evaluate if explanations and summarized explanations are useful for the end-users.
Acknowledgements
The work presented in this paper is supported by the CONTINT program of French National Agency for Research (ANR) under the Kolflow project (ANR-2010-CORD-021-02).
References
[1] Alani, H., Harris, S., O’Neil, B.: Winnowing ontologies based on application use. In: Sure, Y., Domingue, J. (eds.) The Semantic Web: Research and Applications, Lecture Notes in Computer Science, vol. 4011, pp. 185–199. Springer Berlin Heidelberg (2006), http: //dx.doi.org/10.1007/11762256_16
[2] Angele, J., Moench, E., Oppermann, H., Staab, S., Wenke, D.: Ontology-based query and answering in chemistry: Ontonova project halo. In: Fensel, D., Sycara, K., Mylopoulos, J. (eds.) The Semantic Web - ISWC 2003, Lecture Notes in Computer Science, vol. 2870, pp. 913–928. Springer Berlin / Heidelberg (2003)
[3] Berners-Lee, T.: Linked data. W3C Design Issues http://www.w3.org/DesignIssues/ LinkedData.html (2006)
[4] Bonatti, P., Hogan, A., Polleres, A., Sauro, L.: Robust and scalable linked data reasoning incorporating provenance and trust annotations. Web Semantics: Science, Services and Agents on the World Wide Web 9(2), 165–201 (2011)
[5] Corby, O., Dieng-Kuntz, R., Faron-Zucker, C., Gandon, Fabien, L.: Ontology-based Ap-proximate Query Processing for Searching the Semantic Web with Corese. Research Report RR-5621, INRIA (2006), http://hal.inria.fr/inria-00070387
[6] Costabello, L.: DC proposal: PRISSMA, towards mobile adaptive presentation of the web of data. In: Aroyo, L., Welty, C., Alani, H., Taylor, J., Bernstein, A., Kagal, L., Noy, N., Blomqvist, E. (eds.) The Semantic Web – ISWC 2011, Lecture Notes in Computer Science, vol. 7032, pp. 269–276. Springer Berlin / Heidelberg (2011), http://dx.doi.org/10.1007/ 978-3-642-25093-4_18
[7] Eduard, H.: Text summarization. In: Mitkov, R. (ed.) The Oxford Handbook of Computa-tional Linguistics. Oxford University Press (2005)
[8] Euzenat, J., Shvaiko, P.: Ontology matching, vol. 18. Springer Heidelberg (2007)
[9] Hasan, R., Gandon, F.: Linking justifications in the collaborative semantic web applications. In: Proc. of the 21st Int’l Conference Companion on World Wide Web. pp. 1083–1090. WWW ’12 Companion, ACM (2012), http://doi.acm.org/10.1145/2187980.2188245 [10] Hasan, R., Gandon, F.: A Brief Review of Explanation in the Semantic Web. Workshop on
Explanation-aware Computing (ExaCt 2012), European Conference on Artificial Intelligence (ECAI 2012) (2012)
[11] J¨arvelin, K., Kek¨al¨ainen, J.: Cumulated gain-based evaluation of IR techniques. ACM Trans. Inf. Syst. 20(4), 422–446 (Oct 2002), http://doi.acm.org/10.1145/582415.582418 [12] Kiefer, C., Bernstein, A., Stocker, M.: The fundamentals of isparql - a virtual triple approach
for similarity-based semantic web tasks. In: Proceedings of the 6th International Semantic Web Conference (ISWC), pp. 295–309. Lecture Notes in Computer Science, Springer (MAR 2007)
[13] Li, N., Motta, E.: Evaluations of user-driven ontology summarization. In: Cimiano, P., Pinto, H. (eds.) Knowledge Engineering and Management by the Masses, Lecture Notes in Computer Science, vol. 6317, pp. 544–553. Springer Berlin Heidelberg (2010), http: //dx.doi.org/10.1007/978-3-642-16438-5_44
[14] McGuinness, D., Pinheiro da Silva, P.: Explaining answers from the semantic web: the in-ference web approach. Web Semantics: Science, Services and Agents on the World Wide Web 1(4), 397 – 413 (2004), http://www.sciencedirect.com/science/article/pii/ S1570826804000083
[15] McSherry, F., Najork, M.: Computing information retrieval performance measures efficiently in the presence of tied scores. In: Macdonald, C., Ounis, I., Plachouras, V., Ruthven, I., White, R. (eds.) Advances in Information Retrieval, Lecture Notes in Computer Science, vol. 4956, pp. 414–421. Springer Berlin Heidelberg (2008), http://dx.doi.org/10.1007/ 978-3-540-78646-7_38
[16] Moreau, L., Missier, P.: PROV-DM: The PROV data model. World Wide Web Consortium, Fourth Public Working Draft (2012)
[17] Peroni, S., Motta, E., d’Aquin, M.: Identifying key concepts in an ontology, through the integration of cognitive principles with statistical and topological measures. In: Domingue, J., Anutariya, C. (eds.) The Semantic Web, Lecture Notes in Computer Science, vol. 5367, pp. 242–256. Springer Berlin Heidelberg (2008), http://dx.doi.org/10.1007/ 978-3-540-89704-0_17
[18] Steinberger, J., Jezek, K.: Evaluation measures for text summarization. Computing and Informatics 28(2), 251–275 (2009)
[19] Zhang, X., Cheng, G., Qu, Y.: Ontology summarization based on RDF sentence graph. In: Proceedings of the 16th international conference on World Wide Web. pp. 707–716. WWW ’07, ACM, New York, NY, USA (2007), http://doi.acm.org/10.1145/1242572.1242668
2004 route des Lucioles - BP 93 06902 Sophia Antipolis Cedex
BP 105 - 78153 Le Chesnay Cedex inria.fr