READ THESE TERMS AND CONDITIONS CAREFULLY BEFORE USING THIS WEBSITE.
https://nrc-publications.canada.ca/eng/copyright
Vous avez des questions? Nous pouvons vous aider. Pour communiquer directement avec un auteur, consultez la
première page de la revue dans laquelle son article a été publié afin de trouver ses coordonnées. Si vous n’arrivez pas à les repérer, communiquez avec nous à [email protected].
Questions? Contact the NRC Publications Archive team at
[email protected]. If you wish to email the authors directly, please see the first page of the publication for their contact information.
NRC Publications Archive
Archives des publications du CNRC
This publication could be one of several versions: author’s original, accepted manuscript or the publisher’s version. / La version de cette publication peut être l’une des suivantes : la version prépublication de l’auteur, la version acceptée du manuscrit ou la version de l’éditeur.
Access and use of this website and the material on it are subject to the Terms and Conditions set forth at An inside look at ice-crushing induced vibration and lock-in
Gagnon, R.
https://publications-cnrc.canada.ca/fra/droits
L’accès à ce site Web et l’utilisation de son contenu sont assujettis aux conditions présentées dans le site
LISEZ CES CONDITIONS ATTENTIVEMENT AVANT D’UTILISER CE SITE WEB.
NRC Publications Record / Notice d'Archives des publications de CNRC:
https://nrc-publications.canada.ca/eng/view/object/?id=bf0c00c6-a235-489a-86e2-35829a503cc0 https://publications-cnrc.canada.ca/fra/voir/objet/?id=bf0c00c6-a235-489a-86e2-35829a503cc0
POAC11-
AN INSIDE LOOK AT ICE-CRUSHING INDUCED
VIBRATION AND LOCK-IN
R.E. Gagnon
Institute for Ocean Technology, National Research Council of Canada, St. Johns, NL
ABSTRACT
High-speed imaging (up to 30,000 images/s) has been used to observe the behavior of pyramid-shaped polycrystalline freshwater ice samples during crushing at –10oC in the lab. The ice contact zone consisted of an intact high-pressure central area surrounded by pulverized spall debris and partially refrozen melt. A sawtooth pattern was evident in the load record, similar to that observed in other ice crushing and indentation studies. Spalling behavior was responsible for the sequence of load drops in the sawtooth load pattern and has been discussed before. Here we report details of system vibration associated with spalling. Essentially the spalling events serve as impulses that excite resonant vibration in the ice/apparatus system. We furthermore observed that resonant lock-in occurs when the frequency of the spalling events is in the vicinity of the dominant resonant frequencies of the ice-apparatus system. Correlation of load and actuator displacement data and visual observations of spalling and slight flexures of the thick acrylic crushing platen, through which the ice behavior was observed, enabled the identification of resonant modes and lock-in onset. Lock-in was observed at the two apparent dominant resonances in the apparatus, i.e. roughly 350 Hz and 900 Hz. These resonances appear to be associated with the pump/actuator system (350 Hz) and a flexural resonant mode of the acrylic platen (900 Hz). Spalling frequency was generally higher at the beginning of the crushing tests, when the ice was less confined and more susceptible to fracture, and decreased with increasing confinement as the tests progressed. In tests where the nominal actuator speed was 40 mm/s the higher frequency lock-in mode was briefly observed at first, and a short time later lock-in occurred extensively at the lower frequency. These observations are relevant to resonance and lock-in behavior that has been observed in ice-structure interaction at larger scales.
INTRODUCTION
Ice crushing and indentation has been studied intensively over the past few decades. Some characteristics of the ice behavior recur during field and lab studies and at various scales (Gagnon, 1999). High pressures have been observed on so-called ‘hard spots’ of relatively intact ice and the rapid production and flow of melt in these areas has also been documented. Another interesting aspect has been the apparent cyclic sawtooth pattern in load that has been described frequently and attributed to spalling behavior (Gagnon, 1999). A spalling event generally refers
POAC’11
Montréal, Canada
Proceedings of the 21st International Conference on
Port and Ocean Engineering under Arctic Conditions July 10-14, 2011 Montréal, Canada
to what happens when a portion of a hard zone rapidly separates from the main ice contact region and shatters, leading to a sudden drop in load. Aspects of the sawtooth patterns, such as their regularity, have only recently been addressed in detail in the literature (Gagnon, 2008) and explanations for the size of spalls, and the associated magnitude of the load drops, have been offered. These were based on observations of ice crushing behavior from images acquired at very high speed (30,000 images per second). Here we report on further experiments where the analysis focuses on vibrations in the ice/apparatus system induced by spalling events during crushing, and more specifically the relationship between spalling frequency, resonant modes of the system and lock-in.
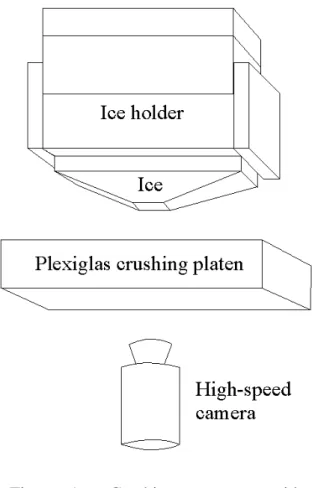
APPARATUS AND TEST PARAMETERS Figure 1 shows the test setup, where the ice, confined in a rigid holder, is pressed against a transparent acrylic (PlexiglasTM) crushing plate (5 cm thickness) in a testing frame as high-speed images are acquired from the opposite side of the plate. The lab-grown freshwater ice samples were polycrystalline with the c-axis of the grains randomly oriented. The specimens were initially
blocks 13 cm x 13 cm x 10 cm with the tops trimmed to the shape of a truncated pyramid with a slope of about 40o. Details of the ice holder and the procedure for preparing the ice specimens and mounting them in the ice holder are similar to that given by Gagnon (1994). The tests were carried out at –10oC and two actuator nominal rates were employed, i.e. 40 mm/s and 20 mm/s. The data from the load cell used in the tests were acquired at 6144 samples per second.
TEST RESULTS AND DISCUSSION
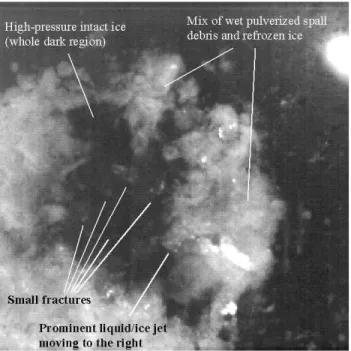
Figure 2 shows an image acquired during an earlier crushing test using a single-crystal ice specimen (Gagnon, 2008). The figure is annotated to illustrate features of the ice behavior to assist the reader in understanding the discussion that follows. The region of the image showing white material surrounding a central dark region corresponds to the area of contact where the top of the pyramid-shaped ice sample is being crushed against the acrylic crushing plate. The load record for the test is shown in Figure 3. The oscillating pattern in the load record between the load drops is elastic resonance in the ice/apparatus system (~ 1 kHz), in this case primarily due to flexure of the acrylic crushing plate. Each of the load drops in the figure results from a spalling event, as was clearly evident in the high-speed imaging record (30,000 images/s) of the test. We note that each spalling event serves as an impulsive force that excites resonant modes of vibration in the ice/apparatus system.
Figure 1. Crushing apparatus with camera for viewing the contact zone during experiments. (From Gagnon (2008))
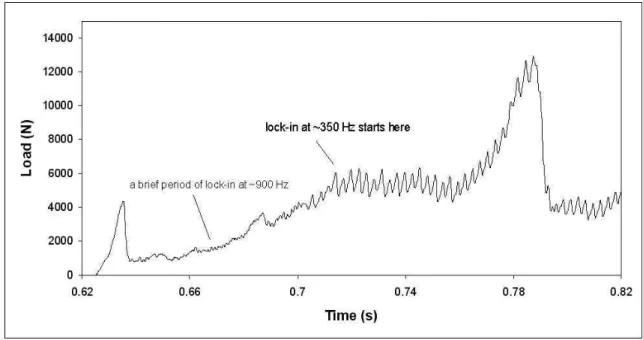
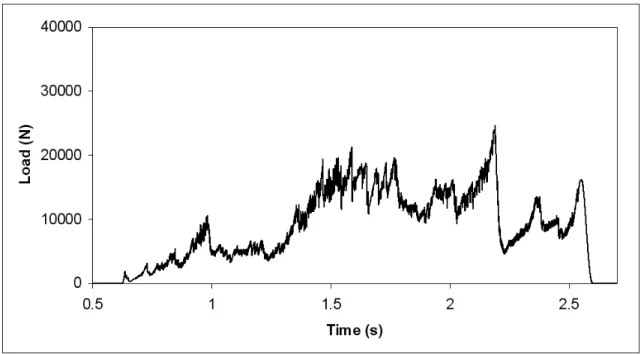
Figure 4 is the load record from one of the present tests on a polycrystalline ice sample. It is necessary to view sections of the load record in detail, along with the corresponding high-speed imaging data to appreciate what is happening. Figure 5 is an expanded view of the first portion of the load record. The first thing to notice is how different the record looks from Figure 3 where spalling events and resonant oscillations were quite obvious and distinct. In contrast the present record shows a relatively quiet section from 0.64 to around 0.7 s. The high-speed imaging record, however, shows tiny spalling events occurring at high rates (roughly 900 Hz) during this period. Only small portions of the hard-zone contact area shatter during each event and therefore the consequent load drops are very small. These are visible as the series of tiny jagged features of the load record. The imaging records shows that for a brief period (0.67 - 0.69 s) the small spalling events had become synchronized with a flexural resonant
mode of the acrylic plate. Slight flexures are evident in the plate because of observable optical distortions of the view due to the plate’s thickness and refractive properties. In this short section of the test the spalling frequency and the resonant frequency of the system are in sync, that is Figure 2. Image from a previous high-speed video record indicating various aspects of the ice behavior. The image is 43 mm wide. (From Gagnon(2008))
Figure 3. Load record for a crushing test on a mono-crystalline ice sample. An image from the test is shown in Figure 2. The oscillating pattern in the load record between the load drops is elastic resonance in the ice/apparatus system. (From Gagnon(2008))
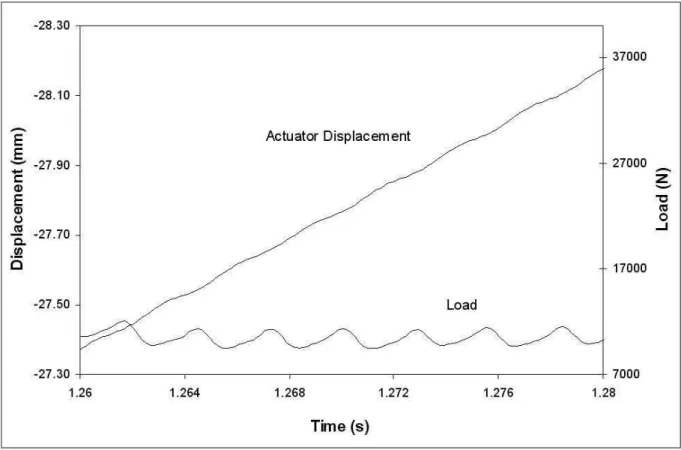
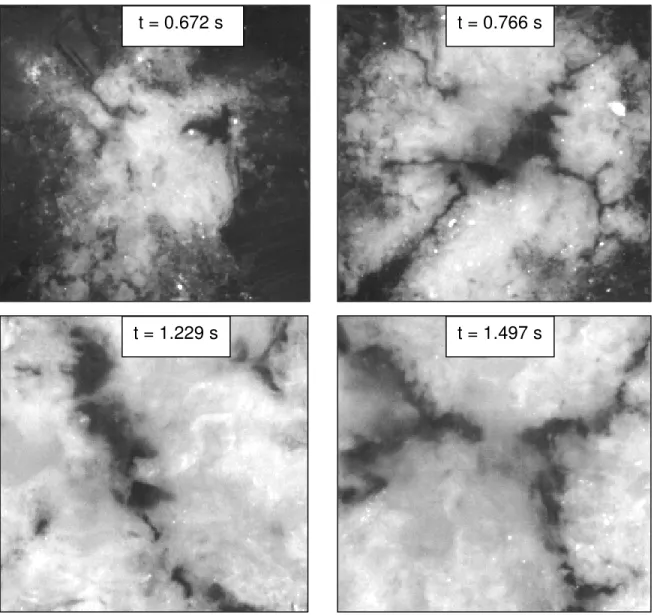
locked in at around ~900 Hz. After this portion of the record there appears to be a brief transition period where spalling and resonance are not in sync until a second resonant mode of the system begins to become prominent at approximately 0.72 s. This mode (~350 Hz) seems to be primarily associated with the actuator/pump system since the oscillations are evident in an expanded segment of the displacement and load record (Figure 6). The oscillations in load cause flexures of the acrylic plate that is apparent in the imaging record as described above. The high-speed imaging record now shows that the spalling frequency has switched to the lower value and that it is locked in to the lower resonant frequency (~350 Hz). The switch from higher to lower frequency lock-in is probably attributable to the fact that the spalling frequency is generally higher in the early stages of ice crushing since the ice is less confined. Images of the ice contact zone at four points in time during the test are shown in Figure 7.
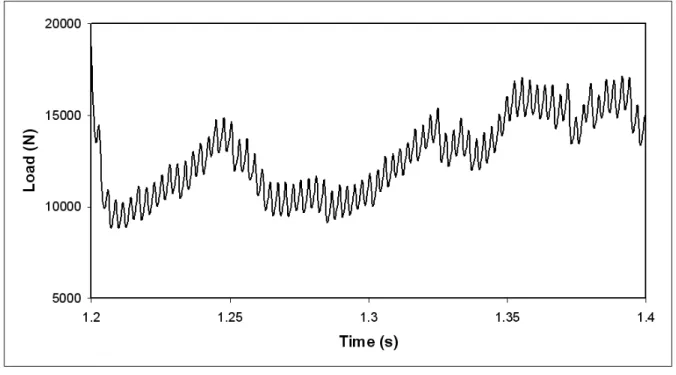
The rest of the load record shows the same resonance at ~350 Hz and the high-speed imaging record confirms that the spalling is synchronized with the oscillations, that is locked in, as is evident in a second portion of the test from 1.2 s to 1.4 s (Figure 8). The earlier test (Figure 3) did not show lock-in behavior because the spalling frequency (at ~100 Hz) was not high enough to coordinate with the apparent dominant resonances in the ice/apparatus system in that case (~350 Hz and ~1000 Hz). The lower spalling rate for the earlier test was due to the monocrystalline nature of the ice. Polycrystalline ice, on the other hand, has many randomly oriented grains and grain boundaries that are susceptible to crack nucleation leading to spalling. Now we consider another test on a polycrystalline sample, but this time the actuator speed is half the rate of the former test, that is, 20 mm/s as opposed to 40 mm/s. The full load record is shown in Figure 9 and an expanded portion of it in Figure 10. In this case, for the most part there is much less coordination of spall events and resonance in the ice/apparatus system (Figure 10). Some resonance at ~ 350 Hz is apparent at the far left of the record but the spalling events are
Figure 4. Load record for a crushing test on a polycrystalline ice sample. The nominal actuator speed was 40 mm/s.
occurring at half or less that rate and therefore no lock-in is apparent. A consequence of this is that the magnitudes of the peaks in the sequence of spalls is greater than when the spalling was locked in at ~350 Hz in the former test. This is simply the result of the ice/apparatus system experiencing more strain in between spalling events in the non locked-in case where the spall events occurred less frequently. Images of the ice contact zone at two times during the test are shown in Figure 11. We note that towards the end of the test a large portion of the intact ice contact region broke up (immediately following the highest peak in the load record) and this dramatically changed the shape of the bulk ice (second image in Figure 11). Consequently a period of lock-in (at ~350 Hz) then ensued and persisted until the end of the test. A portion of this period of lock-in in the load record is shown in Figure 12.
Similar reasoning may explain the difference in amplitude of the lock-in spall/oscillations observed in the test at 40 mm/s (Figure 8) when compared with the lock-in observed near the end of the slower test where the actuator speed was 20 mm/s (Figure 12). We note that even though the lock-in frequency is the same in both cases (~350 Hz) the amplitude of the oscillations in the faster test is approximately double that observed in the slower test. This would be expected since the ice/apparatus system in the faster test experiences double the strain in between spalling events compared to the slower test. A note of caution should be made regarding this analysis since it assumes that the bulk ice shape and contact characteristics are similar in both cases.
These observations and insights point to an important aspect of lock-in. That is, whether lock-in spalling will generate larger load fluctuations than non-lock-in spalling behavior? The answer apparently depends on the particular details of the situation. If a primary resonance in the ice/structure system is higher than the initial non-lock-in spalling frequency, and sufficiently close to it, then the spalling frequency will increase and synchronize with the system resonant frequency. In this scenario since the spalling frequency increased the ice/apparatus system experiences less strain between spalling events. Hence the amplitude of the load
Figure 5. Expanded view of the early portion of the load record for the crushing test shown in Figure 4.
drops/oscillations at lock-in are less than the sawtooth load drop amplitudes before lock-in commenced. On the other hand if the initial non-lock-in spalling frequency was higher than, and sufficiently close to, a primary system resonance then the spalling frequency would decrease to a system resonance at lock-in and we would expect the spalling load drops to increase in amplitude since the ice/apparatus system experiences more strain between spall events.
In the present tests we have seen both phenomenon occur. In the first test on polycrystalline ice there was high-frequency spalling at the beginning of the test that lead to a brief period of lock-in at ~900 Hz, with very low amplitude load drops. As the ice penetration increased, leading to increased confinement, the spalling frequency decreased and slipped out of the lock-in at ~900 Hz until the frequency got sufficiently close to the lower system resonance at ~350 Hz for lock-in to occur agalock-in. We note that when lock-lock-in ensued at the lower frequency the amplitude of the load drops substantially increased.
In the second test we saw non-lock-in spalling in the central region of the load record with frequency lower than the system resonant frequency (~350) and substantially high sawtooth peaks. Then later in the test the spalling rate increased and locked in to the resonant frequency and the amplitude of the load drops consequently dropped.
Vibration of structures due to ice crushing has been discussed by many researchers (e.g. Sodhi, 1988; Sodhi, 1998; Ashby et al., 1986; Yue et al., 2009; Huang, 2010) including
non-Figure 6. A short segment of the actuator displacement and load record for the crushing test shown in Figure 4 showing resonant oscillations at ~350 Hz.
simultaneous failure behavior of the ice. Here we note that large scale ice/structure contact zones can have spalling events at different locations that may be occurring at similar frequencies but not necessarily in phase with each other because of the large extent of the contact zone, i.e. non-simultaneous spalling events. The behavior of ice during crushing has been shown to be invariant over a broad range in scale (Gagnon, 1999). Hence, it is likely that when a resonance of the ice/structure system becomes prominent that the spalling activity at all the locations will adjust their frequencies somewhat to match the dominant resonance of the system, as we saw for the single spalling activity case in the present tests, and will furthermore be locked in phase. The consequence is that the lock-in load oscillations would be much higher than any load drop
Figure 7. Four images from a crushing test on polycrystalline ice where the actuator nominal speed was 40 mm/s. The time signatures correspond to the time scale for the load record shown in Figure 4. The white areas correspond to wet pulverized spall debris and refrozen ice. This comparatively low-pressure material surrounds dark areas consisting of relatively intact high-pressure ice. The images are 50 mm wide.
t = 0.672 s t = 0.766 s
associated with a local spalling event since all the spalling events would occur at the same time in each cycle.
CONCLUSIONS
Lab-scale crushing experiments on polycrystalline freshwater ice samples viewed using high-speed imaging have shown distinct relationships between the spalling behavior of the ice and resonance and lock-in of the ice/apparatus system. The apparatus is relatively small and stiff so the lock-in frequencies observed were understandably high. However the behavior of ice during crushing has been shown to be invariant over three orders of magnitude in scale (Gagnon, 1999) and the present observations are likely relevant to large-scale ice/structure interaction.
REFERENCES
Ashby, M.F., Palmer, A.C., Thouless, M., Goodman, D.J., Howard, M., Hallam, S.D., Murrell, S.A.F., Jones, N., Sanderson, T.J.O. and Ponter, A.R.S., 1986. Nonsimultaneous failure and ice loads on arctic structures. Offshore Technology Conference 1986, 399–404.
Gagnon, R.E., 1994. Melt Layer Thickness Measurements During Crushing Experiments on Freshwater Ice. Journal of Glaciology, Vol. 40, No. 134, 119-124.
Gagnon, R.E., 1999. Consistent Observations of Ice Crushing in Laboratory Tests and Field Experiments Covering Three Orders of Magnitude in Scale. Proc. POAC-99, Helsinki, Finland, 2, 858-869.
Gagnon, R.E., 2008. High-Speed Imaging of Mechanisms Responsible for Sawtooth Cyclic Loading During Ice Crushing. Proc. IAHR-08, Vancouver, Canada, 2, 983-991.
Huang, Y., 2010. Model test study of the nonsimultaneous failure of ice before wide conical structures. Cold Regions Science and Technology, Vol. 63, Issue 3, 87-96.
Figure 8. A segment of the load record for the crushing test shown in Figure 4 illustrating the load oscillations associated with lock-in at ~350 Hz. Each oscillation is associated with a single spalling event.
Sodhi, D.S., 1988. Ice induced vibrations of structures. IAHR'88, Ice Symposium, 625–657. Sodhi, D.S., 1998. Nonsimultaneous crushing during edge indentation of freshwater ice sheets.
Cold Regions Science and Technology, Vol. 27, Issue 3, 179–195.
Yue, Q., Guo, F. and Kärnä, T., 2009. Dynamic ice forces of slender vertical structures due to ice crushing. Cold Regions Science and Technology, Volume 56, Issues 2-3, 77-83.
Figure 9. Load record for a crushing test on a polycrystalline ice sample. The nominal actuator speed was 20 mm/s.
Figure 10. A central segment of the load record for the crushing test shown in Figure 9 illustrating the lack of coordination between spalling events and resonance in the ice/apparatus system when lock-in does not occur.
Figure 12. Another segment of the load record for the crushing test shown in Figure 9 illustrating the load oscillations associated with lock-in at ~350 Hz that set in towards the end of the test following the shattering of a large portion of the ice contact area (the highest peak in the load record).
Figure 11. Two images from a crushing test on polycrystalline ice where the actuator nominal speed was 20 mm/s. The time signatures correspond to the time scale for the load record shown in Figure 9. The white areas correspond to wet pulverized spall debris and refrozen ice. This comparatively low-pressure material surrounds dark areas consisting of relatively intact high-pressure ice. The images are 35 mm wide.