HAL Id: hal-00316443
https://hal.archives-ouvertes.fr/hal-00316443
Submitted on 1 Jan 1998
HAL is a multi-disciplinary open access
archive for the deposit and dissemination of sci-entific research documents, whether they are pub-lished or not. The documents may come from teaching and research institutions in France or abroad, or from public or private research centers.
L’archive ouverte pluridisciplinaire HAL, est destinée au dépôt et à la diffusion de documents scientifiques de niveau recherche, publiés ou non, émanant des établissements d’enseignement et de recherche français ou étrangers, des laboratoires publics ou privés.
variations of F-region and topside auroral upflows
observed by EISCAT between 1984 and 1996
C. Foster, M. Lester, J. A. Davies
To cite this version:
C. Foster, M. Lester, J. A. Davies. A statistical study of diurnal, seasonal and solar cycle varia-tions of F-region and topside auroral upflows observed by EISCAT between 1984 and 1996. Annales Geophysicae, European Geosciences Union, 1998, 16 (10), pp.1144-1158. �hal-00316443�
A statistical study of diurnal, seasonal and solar cycle variations
of F-region and topside auroral up¯ows observed by EISCAT
between 1984 and 1996
C. Foster1, M. Lester and J. A. Davies
Radio and Space Plasma Physics Group, Department of Physics and Astronomy, University of Leicester, University Road, Leicester, LE1 7RH, UK
Received: 19 January 1998 / Revised: 2 June 1998 / Accepted: 3 June 1998
Abstract. A statistical analysis of F-region and topside auroral ion up¯ow events is presented. The study is based on observations from EISCAT Common Pro-grammes (CP) 1 and 2 made between 1984 and 1996, and Common Programme 7 observations taken between 1990 and 1995. The occurrence frequency of ion up¯ow events (IUEs) is examined over the altitude range 200 to 500 km, using ®eld-aligned observations from CP-1 and CP-2. The study is extended in altitude with vertical measurements from CP-7. Ion up¯ow events were identi®ed by consideration of both velocity and ¯ux, with threshold values of 100 m s)1 and 1013 m)2s)1,
respectively. The frequency of occurrence of IUEs is seen to increase with increasing altitude. Further anal-ysis of the ®eld-aligned observations reveals that the number and nature of ion up¯ow events vary diurnally and with season and solar activity. In particular, the diurnal distribution of up¯ows is strongly dependent on solar cycle. Furthermore, events identi®ed by the veloc-ity selection criterion dominate at solar minimum, whilst events identi®ed by the upward ®eld-aligned ¯ux crite-rion dominated at solar maximum. The study also provides a quantitative estimate of the proportion of up¯ows that are associated with enhanced plasma temperature. Between 50 and 60% of up¯ows are simultaneous with enhanced ion temperature, and approximately 80% of events are associated with either increased F-region ion or electron temperatures. Key words. Ionosphere (auroral ionosphere; particle acceleration)
1 Introduction
Over the last two decades, a wealth of radar and satellite observations has revealed that the ionosphere provides a steady and signi®cant source of magnetospheric ions. Among the ®rst radar observations of ®eld-aligned ion up¯ows in the F-region ionosphere were those made by the Chatanika incoherent scatter radar (Bates, 1974); they were later observed by the EISCAT radar (Winser et al., 1986). Several workers, including Williams and Jain (1986), Jones et al. (1988), Winser et al. (1989), Wahlund and Opgenoorth (1989) and Wahlund et al. (1992), have since presented observations of ion up¯ows in the F-region and topside ionosphere, with ion veloc-ities ranging from around 100 m s)1 to as much as
1500 m s)1. Corresponding ion ¯uxes of up to
1014m)2s)1 have been detected, values that are one or
two orders of magnitude greater than the classical polar wind ¯ux.
A number of acceleration mechanisms, primarily associated with disturbed ionospheric conditions, have been proposed to account for ion out¯ows. At high altitudes, transverse acceleration of ions resulting from heating by, for example, ion cyclotron or lower hybrid waves generates out¯ows with con®ned pitch angle distributions, so-called ion conics (Ungstrup et al., 1979; Lockwood, 1982). Rocket and satellite observations indicate that ion conics are typically generated above about 1000 km altitude, often above auroral arcs (Arnoldy et al., 1992). Also, within regions of electron precipitation, ®eld-aligned currents can induce low-frequency plasma turbulence, which can lead to in-creased resistivity and hence enhancements in both the electron temperature and the ®eld-parallel electric ®eld. Each eect can induce signi®cant ion acceleration parallel to the geomagnetic ®eld (e.g. Wahlund et al., 1993; Forme et al., 1993; Blelly et al., 1996). Again, such acceleration mechanisms are generally considered to be eective at altitudes above about 1000 km.
Correspondence to: C. Foster
1Present address: Computer Centre, University of Leicester,
At lower altitudes, other acceleration mechanisms become important. F-region up¯ows are typically driven by a combination of neutral wind, thermal expansion of the neutral atmosphere resulting from Joule heating, and enhanced diusion arising from increased F-region ion and/or electron temperatures (Winser et al., 1988; Wahlund et al., 1992; Rodger et al., 1992). Many ion up¯ow events in the high-latitude F-region ionosphere can be characterised as either ``type 1'' or ``type 2'' features, as described by Wahlund et al. (1992). Type 1 events are associated with strong perpendicular electric ®elds, increased ion temperature resulting from ion frictional heating, and little or no electron precipitation, and may be explained in terms of thermal plasma expansion. Type 2 up¯ows occur above auroral arcs and are associated with increased electron temperature and ®eld-parallel electric ®elds.
Keating et al. (1990) presented a statistical study of large F-region ®eld-parallel ¯ows. These authors ana-lysed EISCAT Common Programme 1 data collected between 1985 and 1987 and derived seasonal and diurnal distributions of the occurrence of large ®eld-aligned ¯ows for a range of altitudes between 200 and 500 km. An up¯ow (or down¯ow) ``event'' was deemed to have occurred if either the ®eld-aligned ion velocity exceeded 100 m s)1or the ¯ux was greater than 1013m)2s)1. The
maximum frequency of occurrence of upward ®eld-aligned ¯ows was found to occur at 2100 UT, with roughly 50% of up¯ows occurring during intervals of enhanced ion temperatures. A greater occurrence of out¯ows was observed in conjunction with simulta-neously enhanced ion and electron temperatures.
Statistical studies based on observations from single instruments, such as the EISCAT radar, can suer because of the limited latitudinal extent that may be covered. However, the large data bases that are accu-mulated and the excellent temporal resolution achieved do allow for informative studies of ion up¯ow events, such as that presented by Keating et al. (1990). Since that particular survey, EISCAT observations have been made over several more years, including topside mea-surements up to about 1000 km altitude. Thus it is pertinent to extend the work of Keating and co-authors, in terms of both temporal and altitudinal coverage, to document longer-term variations of ion up¯ow events. Furthermore, a larger data set should also provide more statistically valid distributions, less aected by ``anom-alous'' observing periods.
This paper presents a statistical study of F-region and topside ion up¯ow events observed by the EISCAT radar between 1984 and 1996. The occurrence frequen-cy of ion up¯ow events (IUEs) is studied over the altitude range 200 to 500 km, employing ®eld-aligned observations from Common Programmes One and Two. The study is extended in altitude with measure-ments from Common Programme Seven obtained between 1990 and 1995. Diurnal and seasonal up¯ow distributions are ®rst presented and discussed brie¯y with regard to the ®ndings of Keating et al. (1990). Then, the high-altitude CP-7 observations are consid-ered, followed by an investigation of the occurrence
frequency of IUEs as a function of the phase of the solar cycle. Finally, a quantitative study of the rela-tionship between IUEs and enhanced ion and electron temperatures is presented.
2 Data sets
For this study, data were collated from EISCAT Common Programmes One, Two and Seven (CP-1, CP-2 and CP-7). CP-1 is a UHF radar experiment in which the beam from the transmitter at Tromsù is aligned approximately along the local geomagnetic ®eld direction. The remote site radars at Kiruna and SodankylaÈ intersect the Tromsù beam at approximate-ly 300 km altitude, permitting the measurement of the ion vector velocity within the intersection volume. Some versions of CP-1 also provided such tristatic measurements in the E-region, which are not used in the present study. For the current investigation, long-pulse observations from a total of 94 runs of CP-1, taken between January 1984 and February 1996, were employed. In addition to CP-1 measurements, obser-vations from the ®eld-aligned position of 47 runs of CP-2, from May 1984 to March 1996, have been included. In CP-2, the transmitter at Tromsù performs a four-position scan, one of which is vertical and another ®eld-aligned. The dwell-time at each position is 1.5 min, resulting in a cycle time of 6 min. As with CP-1, the remote-site receivers intersect the transmitter beam in the F-region at approximately 300 km alti-tude. Only long-pulse measurements were employed in the present study. The length of the long-pulse for both CP-1 and CP-2 experiments is 350 ls, yielding a range resolution of approximately 52 km for observa-tions between 150 and 600 km altitude. The CP-2 data were post-integrated over the dwell-time at the ®eld-aligned position, whilst the majority of the CP-1 Tromsù data were post-integrated at 5 minutes. Although the study incorporates data from seven versions of CP-1 and four versions of CP-2, together they provide a consistent set of observations suitable for statistical analyses.
It is noted that, due to the curvature of the geomagnetic ®eld-lines, a transmitter beam said to be ``®eld-aligned'' is only so over a limited altitude range. The transmitter elevation angles for Common Pro-grammes 1 and 2 are such that the beam is intended to be ®eld-aligned at approximately 300 km altitude; with increasing distance away from this height, the transmit-ter beam is only up to about 0.5° away from the ®eld-line.
Around 5 y of CP-7 data, obtained from 26 runs between April 1990 and September 1995, were collected to provide vertical observations at F-region and topside altitudes. CP-7 is a monostatic experiment in which the VHF radar, pointing vertically, transmits long-pulses of 750 ls, yielding a range resolution of approximately 110 km. Under favourable conditions, CP-7 can provide measurements from around 300 km to perhaps 1500 km altitude. For the present investigation, it was found that
observations were obtained consistently for nine range gates between 300 and 800 km altitude.
3 Selection criteria for identi®cation of ion up¯ow events
Identical criteria to those adopted by Keating et al. (1990) have been used in the present study to de®ne ``events'' of ion up¯ow. Thus an up¯ow was de®ned as an upward ®eld-aligned ¯ux of greater than 1013 m)2s)1
and/or an upward ®eld-aligned velocity in excess of 100 m s)1. Keating and co-workers (1990) based these
threshold values on experience with EISCAT observa-tions of ®eld-aligned ¯ows in the high-latitude iono-sphere, which indicate that up¯ows normally exceed these values only during limited intervals. Keating and co-authors cited observations reported by Jones et al. (1988) and Winser et al. (1989) as examples of such events; more recent observations further justify these selection criteria (e.g. Wahlund et al., 1992). The velocity threshold is greater than values that might be expected due to neutral winds and plasma pressure gradients under quiet conditions, typically a few tens of m s)1(Winser et al., 1986; Jones et al., 1988), whilst the
¯ux threshold is an order of magnitude greater than the typical polar wind out¯ow (Chappell, 1988).
In the present study, for various altitude and time bins the total number of up¯ow events within each bin was found. These totals were then expressed as a fraction of the total number of observations within each bin, giving a frequency occurrence of up¯ows as a function of time and height. An ``observation'' was de®ned as a single interval of post-integrated data for which estimates of the standard incoherent scatter derived parameters, Ne, Te, Ti and Vi, were obtained.
In addition, the signal-to-noise ratio was required to be greater than 2%. Using the uncertainty approximations of Du Castel and Vasseur (1972), a signal-to-noise ratio of 2% yields an uncertainty of around 25% in the ion and electron temperature values derived from CP-1 Tromsù observations. The generally poorer signal qual-ity received from the farther range gates therefore resulted in fewer observations at higher altitudes. This selection technique diers from that used by Keating et al. (1990). These authors de®ned an observation simply as a single post-integration period, thus obtain-ing the same number of observations regardless of altitude.
4 Results and discussion
The initial study examined 12 y of EISCAT ®eld-aligned measurements derived from Common Programmes One and Two. Observations from six altitude ranges were binned at hourly intervals, the range gates being centred approximately at 200, 250, 300, 350, 400 and 500 km altitude. These ranges match those employed by Keating et al. (1990), and thus aord a direct comparison of results. Times throughout are given in Universal Time
(UT), which at the location of the EISCAT transmitter is approximately two hours behind magnetic local time (MLT).
4.1 Diurnal variation of up¯ows: 200 to 500 km
Figure 1 illustrates the diurnal distributions of ion up¯ow events as a function of UT and altitude for six range gates between 200 and 500 km. The histograms indicate the percentage occurrence of up¯ow events within hourly bins, scaled according to the left-hand axes. In addition, each bar is subdivided into three sections. The white (lower) portion of each represents the proportion of events where the upward ®eld-aligned ¯ux exceeded 1013m)2s)1 but where the upward
velocity was less than 100 m s)1. Similarly, the
propor-tion of events selected only according to the velocity threshold is represented by the light grey (middle) portion. Events which satis®ed both the velocity and ¯ux selection criteria are represented by the dark grey (upper) portion. Finally, the solid lines indicate the total number of observations in each bin at each altitude, scaled according to the right-hand axes. Thus not only is the variation of up¯ow occurrence frequency with UT and altitude demonstrated, but also the relative propor-tions of the dierent ``types'' of event and the depen-dence on height of the number of observations obtained. Note that when referring to events of dierent ``types'' there is no intended implication that they are generated by dierent processes; an event of a particular type merely indicates by which of the three selection criteria it was identi®ed.
Figure 1 illustrates how the type of up¯ow event varies with height. Up to 300 km altitude, the majority of all events exhibit ¯uxes above the speci®ed threshold value but with upward velocities of less than 100 m s)1.
However, beyond 350 km altitude the occurrence of large velocities increases steadily, indicated by the light grey portion of each bar. The percentage occurrence of ¯ux-only events peaks around 2100 UT at 400 km and is then slightly reduced in the highest range gate. However, greater numbers of large ¯uxes are observed with increasing altitude if those which are also accompanied by velocities above the threshold value are considered, as revealed by the dark grey portion of each bar.
Figure 1 demonstrates that the number of up¯ows tends to increase monotonically with altitude, reaching a maximum of approximately 23% around 2200 UT (or about midnight MLT) at 500 km. Upward veloc-ities in excess of 100 m s)1 are uncommon below 350
km altitude, but become increasingly likely with increasing height. Large ®eld-aligned velocities are detected by the EISCAT radar up to approximately 12% of the time at 500 km altitude, either alone or in conjunction with large upward ¯uxes. Upward ®eld-aligned ¯uxes of greater than 1013 m)2s)1 occur less
than 5% of the time below 250 km, but the occurrence frequency of such events increases with altitude, reach-ing a maximum of 15% at 500 km. Finally, up¯ows are in general observed by EISCAT between 15% and 20%
Fig. 1a±f . Diurnal variations of ®eld-aligned up¯ow occurrence frequen cies between 200 and 600 km, derived from EISCAT U HF observations from 1984 to 1996. The histogram bars are subdivided to illustr ate the occ urrence fre quencie so fe vents exceeding the ¯ux threshold only, the velocity thre shold only, and both. The so lid lin e indicat es the total number of observations within each hourly bin
of the time in the pre-midnight sector between 400 and 500 km altitude.
The measurements contributing to Fig. 1 were all obtained from a single geomagnetic latitude. Previous statistical analyses of satellite data (e.g. Ghielmetti et al., 1978; Loranc et al., 1991) have revealed that the spatial distribution of up¯ows is auroral oval-like. A statistical study of transversely accelerated ions (TAIs), and subsequent ion up¯ow, by Klumpar (1979) revealed a similar distribution of events, although the author reported ion ¯uxes that were one to two orders of magnitude less than those observed in the present study. Other statistical analyses of satellite data indicate that up¯ows occur mostly in the cusp region (Yau et al., 1984; Abe et al., 1993). Hence, the variation evident in Fig. 1 would be unexpected if the radar observed within the auroral oval at all times. However, on the day-side the auroral oval is typically positioned at higher geographical latitudes than the EISCAT transmitter (beyond around 70°N between about 0600 to 1800 UT) whilst on the night-side the auroral oval typically extends to below 69°N and the EISCAT facility is then within a region where higher up¯ow occurrence is expected. Therefore, the observed UT variation may re¯ect a spatial rather than a temporal variation. On the other hand, Klumpar (1979) concluded that out¯ows were a predominantly night-side phenomenon at auroral zone latitudes, hence there is probably both a local time and latitudinal variation in the distribution of up¯ows, both of which in¯uence the distributions of Fig. 1. Combined temporal and spatial eects are dicult to resolve from single-point measurements such as those derived from EISCAT radar observations.
These ®ndings are in broad agreement with the results of a similar analysis by Keating et al. (1990) of three years of EISCAT data. These authors noted an increase in up¯ow occurrence with height, but found that the up¯ow occurrence maximised between 400 and 500 km altitude, reaching about 16% between 2100 and 2200 UT. In addition, the UT variation in occurrence frequency was less well de®ned than in the present study, particularly above the 300 km range gate. These dier-ences are likely due to the dierent descriptions of an ``observation'' adopted in the two studies. The de®nition used in the present case results in the number of observations decreasing with altitude. Keating and co-authors (1990) also obtained maximum up¯ow frequen-cies that were smaller at all heights than observed in the present study. This dierence is a real eect of the extended data set used in this study, since the data used by Keating and co-authors were representative of solar minimum conditions.
4.2 Seasonal variation of up¯ows: 200 to 500 km Seasonal distributions of ion up¯ow events in the same six altitude bins are presented in Fig. 2. There is considerable variation over the year in the number of observations at each altitude, with up to 6000 measure-ments around March and September and fewer than
1000 in December at the highest altitude. The total number of observations in the 200 km range gate approached 60 000, some four times that available for the study of Keating et al. (1990).
A seasonal variation in up¯ow occurrence frequency, at least at 350 and 400 km altitude, is seen in Fig. 2. Up¯ows were detected in slightly more than 10% of observations in January and December, that ®gure falling to about 3% in June and July at 400 km. There is no clear evidence of such a seasonal dependence at the lower ranges. However, there is some evidence of a winter increase in the 500 km range gate, although this is less pronounced than at 400 km due to higher up¯ow occurrence in the summer months. The 500 km distri-bution is further marked by a high occurrence of up¯ows in October. The 400 km distribution also re¯ects a relatively large October value, suggesting that there is a real increase in the number of up¯ows detected during that month.
Considering the occurrences of the dierent types of event, similar conclusions can be drawn as from Fig. 1. Throughout the year, the number of ¯ux events tends to increase steadily with altitude, maximising in the 400 and 500 km range gates. Below 350 km altitude, the frequency of ¯ux events exhibits little seasonal variation. The occurrence frequency of large upward ®eld-aligned velocities is small up to 300 km; above that height these events are progressively common with increasing alti-tude.
Keating et al. (1990) also examined the variation of up¯ow occurrence as a function of season and altitude. Figure 2 reveals distributions similar to those of Keating et al. (1990) up to the 300 km range gate. At 350 km, however, the present study reveals a higher up¯ow occurrence frequency in December, January and Feb-ruary, maximising at around 7%. The seasonal variation in up¯ow occurrence was observed by Keating and co-authors, but was perhaps less pronounced than in the present study. At 500 km altitude there was no apparent winter increase in up¯ow occurrence in the Keating study; rather, maxima of up to 16% were observed in March, August and September, with the January occurrence down to less than 2%. Keating et al. (1990) indicated that the small number of winter observations may have rendered these data less statistically signi®-cant, but concluded that there was a fairly clear winter dependence. These authors also noted an occurrence maximum in the July bin at 400 km, which was attributed to a particularly large number of up¯ow events detected during July of 1987. The larger data set available for the present investigation further demon-strates the anomalous nature of those particular results of Keating and co-workers and the need for a detailed extended study.
It is noted that there was little observed variation in the UT distributions of the total number of observations as a function of month (not illustrated). Therefore, the observed seasonal variations in up¯ow occurrence frequency are not a consequence of data sampling bias. In general, up¯ow occurrence frequency is greater with increasing altitude. Upward ®eld-aligned velocities
Fig .2 a±f. Same as Fig. 1 but showing annual variations with data binned according to m onth
in excess of 100 m s)1are typically only detected above
300 km, but ¯ux events are observed at all heights. More up¯ows were detected during the winter months above 300 km, an observation which is in agreement with the studies of Klumpar (1979) and Keating et al. (1990). 4.3 Diurnal variation of up¯ows: 300 to 800 km
The results thus far indicate that the frequency of ion up¯ow events tends to increase monotonically with height, at least between 200 and 500 km. The higher altitude is eectively an upper range limit for the analysis, since the EISCAT radar experiments CP-1 and CP-2 seldom provide reliable ®eld-aligned observa-tions above this altitude. However, higher altitude vertical observations are available from the VHF radar experiment CP-7. Around ®ve years of CP-7 data, obtained between April 1990 and September 1995, were analysed to generate occurrence distributions of up¯ows as a function of UT and altitude. In this case, six range gates spaced at 100 km intervals between 300 and 800 km were considered.
As before, an up¯ow event was de®ned as an upward velocity in excess of 100 m s)1or an upward ¯ux greater
than 1013m)2s)1. However, it should be emphasised
that parameters obtained from CP-7 are derived from vertical observations, not ®eld-aligned. Hence the dis-tributions illustrated in Fig. 3 represent the frequency occurrence of vertical up¯ow events.
The distributions for 300, 400 and 500 km altitude in Fig. 3 dier from those for the same ranges derived from the CP-1 and CP-2 observations, illustrated in Fig. 1. A greater occurrence of up¯ows is evident in the CP-7 data, which also exhibit more day-side events. Furthermore, the occurrence maxima lie between 0000 and 0200 UT, as opposed to the pre-midnight maxima noted previously. It is noted that there is no signi®cant dierence in the UT distributions of the total number of observations for CP-1/2 and for CP-7, represented by the solid lines in Figs. 1 and 3, respectively. Hence the dierences in the CP-1/2 and CP-7 up¯ow occurrence distributions are not a consequence of data sampling bias.
To examine the extent to which the vertical pointing direction could account for these dierences, the anal-ysis was also performed on the vertical observations from the CP-2 experiment. It was ®rst established that the CP-2 ®eld-aligned observations are a representative subset of the data set. Subsequently, diurnal distribu-tions of up¯ows were derived from CP-2 vertical observations. It was found that these vertical up¯ow distributions were more akin to those derived from the CP-7 data (Fig. 3) than from the ®eld-aligned observa-tions (Fig. 1). The CP-2 vertical distribuobserva-tions exhibited up¯ow occurrence maxima around or after midnight, as seen with the CP-7 observations, rather than pre-midnight as with the ®eld-aligned observations. Thus it is concluded that the distributions derived from the CP-7 data are indeed characteristic of the vertical pointing direction employed in the experiment.
There are components of the ®eld-perpendicular zonal (V^E), meridional (V^N) and ®eld-aligned (Vk)
ion velocities in the vertical direction. The vertical component of V^Eis typically small, perhaps only a few
m s)1, since the geomagnetic declination is near to zero
degrees. Thus the vertical velocity, Vi, may be
approx-imated by the expression
Vi Vkcos I V?Nsin I 0:98Vk 0:2V?N 1
where I, the magnetic dip angle at the altitude of the measurements, is approximately 12°. Hence if the meridional component of velocity, V^N, is small with
respect to the ®eld-aligned component, Vk, the measured
vertical velocity is indeed representative of that in the ®eld-aligned direction. However, comparing the up¯ow distributions for V and Vi(Figs. 1 and 3, respectively) it
is clear that the ®eld-aligned and vertical velocities are dissimilar, and therefore that the vertical component of V^N is typically non-negligible during plasma up¯ow.
The present analysis has therefore revealed that, in general, ®eld-aligned velocities cannot be inferred from vertical observations.
EISCAT CP-1 and CP-2 provide tristatic measure-ments of ion velocity at the intersection altitude of the three receiver beams, from which the components of velocity parallel and perpendicular to the geomagnetic ®eld may be derived. If all available measurements of V^N, from approximately 300 km altitude, are collated
and binned at hourly intervals there is a clear diurnal variation in the median meridional component of ion velocity, with typically southward values between 1200 and 2300 UT and northward values at other times (not illustrated). The maximum (median) southward velocity of nearly 100 m s)1occurs around 2000 UT; at this time
more than 75% of all calculated velocities are south-ward. Subsequently, velocities become increasingly northward with the median value peaking at about 50 m s)1around 0200 UT.
A southward meridional velocity will act to reduce the observed vertical velocity, whilst a northward ¯ow will have the opposite eect. Thus, in general, the vertical velocity will be reduced between about 1200 and 2300 UT and enhanced at other times. This eect may account for the reduced detection of vertical up¯ows before midnight and the shift of the maximum occur-rence to post-midnight. This is at least true at 300 km, the altitude for which tristatic measurements were available.
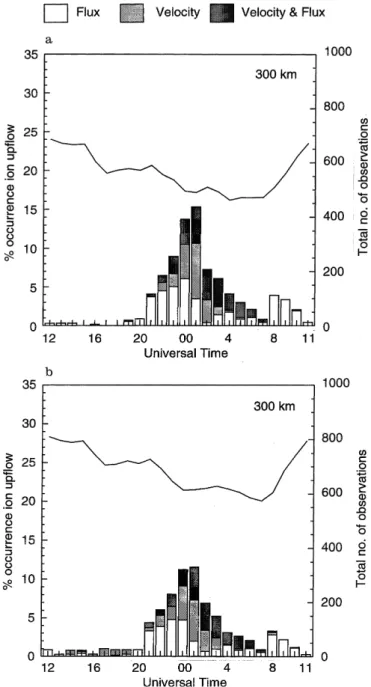
The in¯uence of V^Non the observed vertical velocity
was examined quantitatively for the tristatic 300 km range gate. Initially, vertical velocities were derived from the ®eld-parallel and meridional velocity components for all ®eld-aligned CP-2 data. Then, a frequency distribution of up¯ows, based on the calculated vertical velocities, was derived as before, and is presented in Fig. 4a. For comparison, the distribution obtained from the CP-2 observed vertical velocities is included in Fig. 4b. Although the peak values in Fig. 4a, b dier (16% compared to 12%, respectively), the similarity in shape between the two distributions indicates that the vertical observations are signi®cantly aected by the
Fig. 3a±f. Diurnal variat ions of vertical up¯ow occurrence frequen cies betw een 300 and 800 km, derived fr om EISCAT V HF observations from 1990 to 1995. Histogram bars are subdivided as for Fig. 1
meridional velocity component, suggesting also that this is the sole cause of the dierent distributions obtained from ®eld-aligned and vertical observations. It is sup-posed that the vertical observations at higher altitudes are similarly aected, although this cannot be tested since measurements of the velocity components are only available at the F-region tristatic altitude of around 300 km. Hence the eect of V^N on the vertical
observations accounts for the shift of the peak of the vertical up¯ow distribution to post-midnight. However, the distributions of Fig. 3 also indicate an increased occurrence of day-side events above 300 km altitude,
between about 0900 and 1500 UT. Since V^Nat 300 km
is typically between only +20 and )30 m s)1during this
interval, and there are few day-side events at that height, it might be concluded that the meridional component of velocity attains greater values at higher altitudes. Since the E ´ B drift is approximately constant along the geomagnetic ®eld line over the range of altitudes considered, this could only occur if there were a latitudinal gradient in V^N, which would result in
dierent meridional velocities being observed at dier-ent altitudes along the vertical line-of-sight.
It is concluded that, if the vertical observations could be corrected to account for the eect of v^N, then the
up¯ow occurrences derived from the CP-7 data would exhibit a similar diurnal variation to those for lower altitudes. It is not clear, though, why a greater occur-rence of up¯ows is detected in CP-7 data than is observed in CP-2 observations at similar heights. Not-withstanding the problems associated with vertical observations, the CP-7 data reveal progressively greater frequency occurrences of up¯ow events with increasing altitude.
4.4 Variation of up¯ows over one solar cycle
The current data set of CP-1 and CP-2 observations extend over an interval in excess of 12 y, permitting an examination of the relationship between up¯ow occur-rence and solar cycle. The data have been binned according to altitude and year, and percentage occur-rences of up¯ow events calculated for each bin, as described in Sect. 2. It is noted that there is little variation in the diurnal distribution of the total number of observations as a function of year, as illustrated by the solid lines in Fig. 6. Therefore, there is no sample bias in the up¯ow occurrence distributions presented in Figs. 5 and 6.
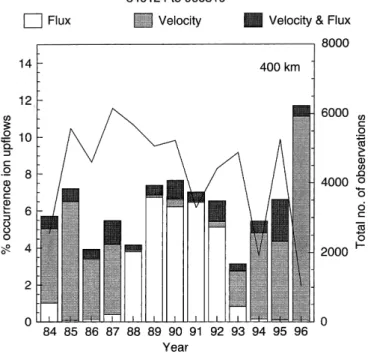
Figure 5 illustrates the variation by year of up¯ow occurrence at 400 km altitude for the period between January 1984 and March 1996. This range-gate was selected since up¯ows are observed relatively frequently at this altitude, whilst the total number of observations is not reduced signi®cantly. Although 13 one-year bins are included in Fig. 5, that for 1996 was derived from data from only two experiments and is therefore less representative of the year than the other bins. The ®gure reveals a clear dependence on year of the type of up¯ow event observed. Between 1988 and 1992 the majority of events exhibited ¯uxes above the threshold value, whilst during this period there were very few velocity events, and only a small proportion of the up¯ows exhibited both large ¯uxes and velocities. However, the opposite situation is apparent for the remaining intervals, namely 1984 to 1987 and 1993 to 1996, when few events exhibited ¯uxes above the threshold value and most of the events were selected since they exceeded the velocity criterion. It was noted that a similar distribution (not illustrated), albeit with reduced up¯ow frequencies, was obtained when the ¯ux and velocity threshold values were increased to 2 ´ 1013 m)2s)1 and 200 m s)1,
Fig. 4. a Diurnal distribution of vertical up¯ows derived from vertical velocities calculated from CP-2 tristatic measurements of v?Nand v .
b Diurnal distribution of up¯ows derived from CP-2 vertical observations
respectively, demonstrating that the clear variation in the type of event is not a consequence of an arbitrary selection criteria.
The period from around late 1987 to the middle of 1993 corresponded to the more active period of solar cycle 22, ``active'' here signifying a sunspot number (Rz)
of greater than about 50. The remaining intervals covered by the present data set, however, fell within the less active periods of solar cycles 21 and 22. These loosely-de®ned intervals of high and low solar activity correspond well to the changes in up¯ow characteristics documented already, with ¯ux events predominant during generally active solar conditions and velocity events prevalent at other times.
Previous studies have demonstrated that the magni-tude and composition of ionospheric out¯ows are dependent on solar cycle. For example, Yau et al. (1985) presented a statistical analysis of auroral and polar ion out¯ows in the energy range 10 eV to 17 keV, as detected by the DE-1 satellite. The study examined the interval from September 1981 to May 1984, coinci-dent with the descending phase of solar cycle 21. Yau and co-authors concluded that the O+out¯ow rate for
the period of greater solar activity between 1981 and 1982 was a factor of two larger than the out¯ow rate between 1983 and 1984. It was also noted that variations in H+ out¯ow rate were not statistically signi®cant.
Fig. 5. Frequency occurrence of up¯ows as a function of year between 1984 and 1986 at 400-km altitude. Histogram bars are subdivided as for Fig. 1
Fig. 6a±d. Same as Fig. 1 but with observations further divided into four three-year bins, illustrating the variation in the diurnal up¯ow occurrence distribution over one solar cycle
Hence, typically greater out¯ow ¯uxes, consisting pri-marily of <1 keV ions, were observed during active solar conditions.
The dependence of IUEs on solar cycle is also evident in the diurnal distributions of up¯ows when observa-tions at a single altitude are sub-divided into three-year bins, as illustrated by Fig. 6. This ®gure simply presents the data from Fig. 1e, but with the data divided into four bins of three years. Note that the last panel also includes data from 1996, for which year there are only a few hours of data. It is evident from Fig. 6 that there is indeed a signi®cant variation with solar phase on both the type of up¯ow detected and on the diurnal distribu-tions of the events. During more active solar condidistribu-tions, represented by Fig. 6b, c, the majority of events exceed the ¯ux threshold only. There are more up¯ows in general during these periods, reaching a 30% occurrence frequency for the period 1990 to 1992, compared with about 15% between 1984 and 1986. Furthermore, broader distributions are observed during quieter solar conditions, as illustrated by Fig. 6a, d. Indeed, the familiar diurnal variation of up¯ows is scarcely evident from the observations made between 1993 and 1996.
In conclusion, both the distributions of up¯ows and the type of event exhibit a strong dependence on solar cycle. The diurnal distributions presented by Keating et al. (1990) were derived from observations taken between 1985 and 1987, and are therefore representative of the ascending phase of solar cycle 22. However, as indicated by Fig. 6, markedly dierent distributions could have been obtained from a dierent sample data set.
Keating et al. (1990) suggested that many supposed up¯ow events detected at altitudes above 400 km were, in fact, due to large scatter in derived velocity and ¯ux values, arising from reduced signal-to-noise ratios high altitudes. It is possible, then, that some of the ``velocity'' up¯ows identi®ed during less active solar conditions may have resulted from greater errors in the derived parameters, since during such times the SNR is adverse-ly aected by relativeadverse-ly low electron densities. As remarked by Keating et al. (1990), quantifying an appropriate SNR threshold is problematical. The value of 2% employed in the present study was arrived at after examination of a number of samples from the entire data set. A similar SNR limit was adopted by Davies et al. (1997, 1998) to eliminate ``unreliable'' estimates of ion velocity derived from CP-1 and CP-2 observations. Re-examination of the data presented in Fig. 6 indicated that SNR thresholds of up to 10% resulted in a decrease in the proportion of velocity events detected, but had little eect on the observed frequency of ¯ux events, as might be expected since the electron density is likely to be greater in the latter case. Importantly, though, sucient numbers of events of both types remained such that the variation with solar phase was still apparent.
The predominance of ¯ux events during more active solar conditions is likely due to the higher ambient electron densities prevalent at these times (e.g. Davies, 1990), since the calculated ¯ux is simply the product of
the observed electron density and ®eld-aligned ion velocity. However, it is not obvious why there is also a decrease in the occurrence frequency of large upward ®eld-aligned velocities during such times. Essentially, an increase in the electron density is accompanied by a reduction in the upward plasma velocity. Variations in the electron density aect the pressure gradient, gravity and frictional forces in the ®eld-parallel ion momentum balance equation. The ®eld-aligned pressure pro®le is also a function of both ion and electron temperatures, which also vary with solar activity. Hence the degree of solar activity will have a complex eect on the ®eld-aligned ion momentum and the precise causes for the variation in type of event are not immediately apparent. However, it is evident that the nature and occurrence of up¯ows are indeed dependent on solar cycle. These observations were only made possible by considering separately the selection criteria adopted for the identi-®cation of up¯ow events, and through the study of the large database of EISCAT observations.
We conclude that during the more active phase of the solar cycle the majority of up¯ow events are character-ised by enhanced aligned ¯uxes and modest ®eld-aligned velocities. Conversely, during quieter solar conditions, large upward ®eld-aligned ¯uxes are rarely observed and intervals of enhanced ®eld-aligned veloc-ities are more common. Furthermore, up¯ow events in general are more frequently observed during solar maximum than solar minimum.
4.5 Up¯ow occurrence and ion frictional heating
A number of studies, for example Heelis et al. (1993), Wilson (1994), Wahlund et al. (1992) and Liu et al. (1995), have demonstrated that F-region ion frictional heating may contribute to the production of upward plasma ¯ows. At high-latitudes, enhanced convection electric ®elds, which often exceed 100 mV m)1, can drive the ions at large velocities relative to the neutral atmosphere, resulting in heating of the ions through frictional contact with the neutrals. Increased ion-neutral coupling below about 120 km altitude tends to inhibit large ion-neutral relative velocities. The response of the ion temperature is almost instantaneous and ®eld-aligned ion acceleration can result as a consequence of the modi®ed plasma pressure gradient. Ion frictional heating has been described by, for example, Rees and Walker (1968), St.-Maurice and Schunk (1979).
Figure 7 illustrates the occurrence distributions of up¯ows which are simultaneous with ion frictional heating at 300 km (Fig. 7a) and 400 km altitude Fig. 7b. ``Simultaneous'' here means that the interval of ion heating and the up¯ow occurred within the same post-integration. An event of ion frictional heating was identi®ed as an enhancement in the ®eld-parallel ion temperature of more than 100 K above its ambient value. This criterion is based on the work of McCrea et al. (1991) and Davies et al. (1997). The ambient ion temperature is simply the modal value at each altitude over each experiment run, an appropriate de®nition
since the ion temperature varies little over time scales of the order of days (Davies et al., 1997).
A crude comparison of Fig. 7a, b with Figs. 1c, e, included as Fig. 7c, d, suggests that perhaps 50% of up¯ows occur during intervals of enhanced ion temper-ature. Furthermore, the proportions of the dierent event types are unchanged, indicating that the presence, or not, of enhanced ion temperature has no bearing on the type of up¯ow, as de®ned by the selection criteria.
At 400 km altitude the total number of observations was precisely 55 719, from which 3322 up¯ow events were identi®ed. Of these, 60% were simultaneous with an enhanced ion temperature. Similarly, at 300 km altitude approximately 50% of up¯ows occurred simul-taneously with elevated ®eld-parallel ion temperatures. Numerical studies of ®eld-aligned subauroral ion drift events (SAIDs) indicate that the response of the ®eld-aligned ion drift velocity to an increase in the F-region ion temperature is near-instantaneous, the ®eld-aligned ¯ow acting to redistribute the plasma to attain a new equilibrium scale height (Heelis et al., 1993). Thus we might expect to detect ion heating and ®eld-aligned ion ¯ow within the same post-integration period.
In summary, some 50% to 60% of up¯ows are associated with intervals of ion heating, which results primarily from frictional contact with the neutral atmosphere. This observation is true at least between 300 and 400 km altitude, where events of ion heating
can be readily identi®ed. This observation is in general agreement with the estimation of Keating et al. (1990), namely, that about half of the up¯ows identi®ed by them when the ion temperature was enhanced. Further-more, the implication is that perhaps 40% to 50% of F-region ion up¯ows are not associated with ion heating. 4.6 Up¯ows and electron temperature
Several authors have demonstrated that an enhanced electron temperature may act in concert with a high ion temperature to generate up¯ows (e.g. Winser et al., 1989), whereas others (e.g. Wahlund et al., 1992; Foster and Lester, 1996) have indicated that up¯ows can sometimes be attributed to enhanced electron tempera-tures alone. A number of mechanisms can lead to heating of the electron population, for example EUV energization, E-region electron turbulent heating, parti-cle precipitation and high-altitude ion-acoustic instabil-ities. These processes can lead to upward ion accelera-tion through thermal expansion or ®eld-aligned electric ®elds.
To examine the statistical relationship between enhanced electron temperatures and ion up¯ows, an appropriate base value against which to identify elevat-ed temperatures is requirelevat-ed. It is inappropriate to derive an ``average'' electron temperature for a single
experi-Fig. 7a±d. Diurnal distributions of up¯ow simultaneous with ion frictional heating events at a 300 and b 400 km. c same as experi-Fig. 1c, d same as Fig. 1e
ment run, as was done for ion temperature, since the electron temperature is primarily dependent on solar ¯ux and hence exhibits large diurnal ¯uctuations. Instead, median values of electron temperature, derived from distributions categorised according to altitude, UT, season and solar cycle, were calculated and used as a basis against which to measure electron temperature enhancements.
Diurnal up¯ow distributions were then derived for events where the electron temperature enhancement exceeded a speci®ed threshold. An arbitrary value of 100 K was adopted; to a crude approximation, an electron temperature increase of 100 K would have a similar eect on the plasma pressure as an increase in ion temperature of the same magnitude.
Figure 8 illustrates the diurnal distribution of up-¯ows at 400 km altitude that were concurrent with either an elevated electron or ion temperature, or both. The form of the distribution is clearly comparable with that of Fig. 1e, with similar proportions of the dierent event types evident. Hence the events represented in Fig. 8 are a characteristic subset of all observed up¯ows. A quantitative examination of the data revealed that about 80% of all up¯ows detected at 400 km altitude occurred during intervals when either or both the ion or electron temperature was enhanced.
These results are consistent with the more qualitative conclusions of Keating et al. (1990), where they exam-ined the relationship between large upward ®eld-aligned ¯uxes at 400 km and ion temperature at 200 km, the observations being further categorised according to electron temperature at the lower altitude. These authors concluded that more up¯ow events occurred when both ion and electron temperatures at lower
altitudes were higher than normally observed. Further-more, measured upward ¯uxes were typically greater at such times. Although Keating et al. (1990) considered large upward ¯uxes as a function of electron tempera-ture at a lower altitude, there was no suggestion that up¯ows should not be associated with ion or electron heating at the same altitude. Indeed, case studies have revealed that up¯ows and enhanced plasma tempera-tures occur simultaneously at the same height (Jones et al., 1988; Wahlund et al., 1992; Foster and Lester, 1996).
However, there are problems inherent in determining ambient electron temperatures against which to measure enhancements. Changes in electron temperature were measured according to dierences between observed and median values, the latter based on EISCAT CP-1 and CP-2 observations between 1984 and 1996. There-fore, local enhancements in electron temperature would not be detected if the current ``ambient'' temperature was suciently greater than the median value. An example of such was apparent in CP-1 observations from October 27, 1988 (not illustrated). During this experiment, transient electron temperature enhance-ments of well over 100 K were detected at a time when upward ¯uxes exceeded 1013m)2s)1. However, the
``typical'' value of electron temperature at 400 km altitude for this time, as used in the previous investiga-tion, was greater than 2100 K. Hence the local electron temperature enhancements would not have been detect-ed. Furthermore, the study was restricted to search for up¯ow and heating events which occurred at the same altitude. Keating et al. (1990) indicated that enhanced ion and electron temperatures at the lower altitude of 200 km can aect the number of up¯ows at 400 km. Moreover, acoustic turbulence at high altitudes can greatly increase the electron temperature, leading to upward ion acceleration by enhanced electric ®elds (Swift, 1965; Papadopoulos, 1977; Forme et al., 1993; Wahlund et al., 1993). Upward ¯ow at lower altitudes may result from a modi®ed pressure gradient. Given these possibilities, and the results of the present study, it is surmised that the majority of up¯ows are associated with intervals of enhanced ion or electron temperature, although not necessarily at the altitude where the up¯ow is observed.
5 Summary and conclusions
The results of a statistical study of events of enhanced ion up¯ow have been presented. The study employed F-region observations from EISCAT CP-1 and CP-2, covering a period of more than twelve years, and over ®ve years of CP-7 topside measurements. The investi-gation has followed on from and extended the analysis performed by Keating et al. (1990), collating data from a far greater period of time and covering a wider range of altitudes. Initial results indicated a higher occurrence frequency of large ®eld-aligned plasma ¯ows in the evening sector, in agreement with the work of Keating et al. (1990). However, the inclusion of vertical
obser-Fig. 8. Diurnal distribution of up¯ows (400 km) simultaneous with either an enhanced ion or electron temperature
vations up to 800 km altitude revealed that the frequen-cy of up¯ows increases steadily with height, whereas the study of Keating and co-workers suggested that the peak occurrence maximised between 400 and 500 km altitude. The present analysis also established that vertical observations are, in general, aected by the meridional component of ion velocity, which itself exhibits a strong diurnal variation.
The current study also revealed a pronounced seasonal dependence of up¯ow occurrence, with a greater frequency of IUEs during the winter months at 350 and 400 km altitude. It was also remarked that the large data set employed in the present study reduced the in¯uence of ``anomalous' intervals such as the July 1987 period noted by Keating et al. (1990).
The large data set, comprising EISCAT observations from more than 12 y, allowed the variation of up¯ow occurrence to be examined over a complete solar cycle. It was demonstrated that more events were observed during greater solar activity. Furthermore, the shape of the up¯ow distributions varied markedly with solar cycle. During solar minimum, the diurnal distributions tended to be much ¯atter, with less pronounced night-side maxima and more day-night-side events. Hence it is apparent that the three-year data set considered by Keating et al. (1990) would have introduced selection eects into the study. Moreover, it was revealed that the type of up¯ow likely to be detected is dependent on solar cycle; during active solar conditions, the majority of events exceeded the speci®ed ¯ux threshold only, whilst during quiet solar conditions only the velocity threshold was exceeded.
Finally, the dependence of up¯ows at 400 km altitude and enhancements in ion and electron temperatures was considered. It was demonstrated that between 50% and 60% of up¯ows occurred during intervals of enhanced ion temperature, and perhaps 80% were simultaneous with an elevated ion or electron temperature.
A number of ion acceleration mechanisms have been described which operate in the auroral ionosphere, as reviewed by, for example, Rodger et al. (1990) and Foster (1997). These processes generally pertain to heating of the plasma, and subsequent thermal expan-sion, during active auroral conditions. Large perpendic-ular electric ®elds can lead to frictional heating of the ions (e.g. Rees and Walker, 1968; St.-Maurice and Schunk, 1979; Davies, 1996), as well as turbulent electron heating in the E-region (e.g. Schlegel and St.-Maurice, 1981; Robinson, 1992) and Joule heating of the neutral atmosphere (e.g. Cole, 1962; Jones et al., 1988). Bulk electron heating may also result from particle precipitation, both through collisions (Whitt-eker, 1977) and enhanced ``anomalous'' resistivity in the presence of ®eld-aligned-current-induced instabilities (Wahlund et al., 1992; Blelly et al., 1996). Low-frequency plasma instabilities can be generated by a number of processes, including sheared convection ¯ows (Ganguli et al., 1994), and may heat the ions transverse to the geomagnetic ®eld direction, leading to outward acceleration by the magnetic mirror force (Suvanto et al., 1989).
The auroral ionosphere is a consistent and signi®cant source of ions for the magnetosphere. Field-aligned ion up¯ows, consisting primarily of O+, are commonly
detected, with ¯uxes of order 1013 to 1014 m)2s)1 and
velocities from tens of m s)1to a few km s)1. The
occurrence distributions of these up¯ows suggest that the acceleration mechanisms that drive them are pri-marily associated with disturbed auroral conditions.
Acknowledgements. We thank the Director and sta of EISCAT for providing the data used in this paper. EISCAT is an international facility supported by the national science councils of Finland, France, Germany, Japan, Norway, Sweden and the United Kingdom. C. Foster was supported by a studentship from the Particle Physics and Astronomy Research Council of the United Kingdom.
Topical Editor D. Alcayde thanks A. Yau and S. Watanabe for their help in evaluating this paper.
References
Abe, T., B. A. Whalen, A. W. Yau, R. E. Horita, S. Watanabe, and E. Sagawa, EXOS D (Akebono) suprathermal mass spectrom-eter observations of the polar wind, J. Geophys. Res., 98, 11 191, 1993.
Arnoldy, R. L., K. A. Lynch, P. M. Kintner, J. Vago, S. Chesney, T. E. Moore, and C. J. Pollock, Bursts of transverse ion acceler-ation at rocket altitudes, Geophys. Res. Lett., 19, 413, 1992. Bates, H. F., Atmospheric expansion from Joule heating, Planet.
Space Sci., 22, 925, 1974.
Blelly, P.-L., A. Robineau, and D. AlcaydeÂ, Numerical modelling of intermittent ion out¯ow events above EISCAT, J. Atmos. Terr. Phys., 58, 273, 1996.
Chappell, C. R., The terrestrial plasma source: A new perspective in solar-terrestrial processes from Dynamics Explorer, Rev. Geo-phys., 26, 229, 1988.
Cole, K. D., Joule heating of the upper atmosphere, Aust. J. Phys., 15, 223, 1962.
Davies, J. A., Ion frictional heating in the high-latitude ionosphere, PhD Thesis, University of Leicester, UK, 1996.
Davies, J. A., M. Lester, and I. W. McCrea, A statistical study of ion frictional heating observed by EISCAT, Ann. Geophysicae, 15, 1399, 1997.
Davies, J. A., M. Lester, and I. W. McCrea, Correction to ``A statistical study of ion frictional heating observed by EISCAT'', Ann. Geophysicae, 16, 477, 1998.
Davies, K., Ionospheric Radio, Peter Peregrinus Ltd., London, 1990.
Du Castel, F., and G. Vasseur, Evaluation des performances d'un sondeur ionespheÂrique a diusion incoheÂrent, Ann. Telecom-mun., 27, 239, 1972.
Forme, F. R. E., J.-E. Wahlund, H. J. Opgenoorth, M. A. L. Persson, and E. V. Mishin, Eects of current driven instabilities on the ion and electron temperatures in the topside ionosphere, J. Atmos. Terr. Phys., 55, 647, 1993.
Foster, C., Auroral ion up¯ows in the F-region and topside ionosphere, PhD Thesis, University of Leicester, UK, 1997. Foster, C., and M. Lester, Observations of nightside auroral plasma
up¯ows in the F-region and topside ionosphere, Ann. Geophys-icae, 14, 1274, 1996.
Ganguli, G., M. J. Keskinen, H. Romero, R. Heelis, T. Moore, and C. Pollock, Coupling of microprocesses and macroprocesses due to velocity shear: an application to the low-altitude ionosphere, J. Geophys. Res., 99, 8873, 1994.
Ghielmetti, A. G., R. G. Johnson, R. D. Sharp, and E. G. Bailey, The latitudinal, diurnal and altitudinal distributions of upward ¯owing energetic ions of ionospheric origin, Geophys. Res. Lett., 5, 59, 1978.
Heelis, R. A., G. J. Bailey, R. Sellek, R. J. Moett, and B. Jenkins, Field-aligned drifts in subauroral ion drift events, J. Geophys. Res., 98, 21493, 1993.
Jones, G. O. L., P. J. S. Williams, K. J. Winser, M. Lockwood, and K. Suvanto, Large plasma velocities along the magnetic ®eld line in the auroral zone, Nature, 336, 231, 1988.
Keating, J. G., F. J. Mulligan, D. B. Doyle, K. J. Winser, and M. Lockwood, A statistical study of large ®eld-aligned ¯ows of thermal ions at high latitudes, Planet. Space Sci., 9, 1187, 1990. Klumpar, D. M., Transversely accelerated ions: An ionospheric source of hot magnetospheric ions, J. Geophys. Res., 84, 4229, 1979.
Liu, C., J. L. Horwitz, and P. J. Richards, Eects of frictional ion heating and soft-electron precipitation on high-latitude F-region up¯ows, Geophys. Res. Lett., 22, 2713, 1995.
Lockwood, M., Thermal ion ¯ows in the topside auroral ionosphere and the eects of low-altitude, transverse acceleration, Planet. Space Sci., 30, 595, 1982.
Loranc, M., W. B. Hanson, R. A. Heelis, and J.-P. St.-Maurice, A morphological study of vertical ionospheric ¯ows in the high-latitude F-region, J. Geophys. Res., 96, 3627, 1991.
McCrea, I. W., M. Lester, T. R. Robinson, N. M. Wade, and T. B. Jones, On the identi®cation and occurrence of ion frictional heating events in the high-latitude ionosphere, J. Atmos. Terr. Phys., 53, 587, 1991.
Papadopoulos, K., A review of anomalous resistivity for the ionosphere, Rev. Geophys. Space Phys., 15, 113, 1977. Rees, M. H., and J. C. G. Walker, Ion and electron heating by
auroral electric ®elds, Ann. Geophyscae, 24, 293, 1968. Robinson, T. R., The eects of the resonance broadening of
Farley-Buneman waves in electrodynamics and heating in the auroral E-region, J. Atmos. Terr. Phys., 54, 749, 1992.
Rodger, A. S., R. J. Moet, and S. Quegan, Review paper: the role of ion drift in the formation of ionization troughs in the mid-and high-latitude ionosphere ± a review, J. Atmos. Terr. Phys., 54, 1, 1992.
St.-Maurice J.-P. and R. W. Schunk, Ion velocity distributions in the high-latitude ionosphere, Rev. Geophys. Space Phys., 17, 243, 1979.
Schlegel, K., and J.-P. St.-Maurice, Anomalous heating of the polar ionosphere by unstable plasma waves: 1. Observations, J. Geophys. Res., 86, 1447, 1981.
Suvanto, K., M. Lockwood, and T. J. Fuller-Rowell, The in¯uence of anisotropic F-region ion velocity distributions on ionospheric
ion out¯ows into the magnetosphere, J. Geophys. Res., 94, 1347, 1989.
Swift, D. W., A mechanism for energizing electrons in the magnetosphere, J. Geophys. Res., 70, 3061, 1965.
Ungstrup, E., D. M. Klumpar, and W. J. Heikkila, Heating of ions to superthermal energies in the topside ionosphere by electro-static ion cyclotron waves, J. Geophys. Res., 84, 4289, 1979. Wahlund, J.-E., and H. Opgenoorth, EISCAT observations of
strong ion out¯ows from the F-region ionosphere during auroral activity: preliminary results, Geophys. Res. Lett., 16, 727, 1989.
Wahlund, J.-E., H. J. Opgenoorth, I. HaÈggstroÈm, K. J. Winser and G. O. L. Jones, EISCAT Observations of topside ionospheric ion out¯ows during auroral activity: revisited, J. Geophys. Res., 97, 3019, 1992.
Wahlund, J.-E., H. J. Opgenoorth, F. R. E. Forme, M. A. L. Persson, I. HaÈggstroÈm, and J. Lilensten, Electron energization in the topside auroral ionosphere: on the importance of ion-acoustic turbulence, J. Atmos. Terr. Phys., 55, 623, 1993. Whitteker, J. H., The transient response of the topside ionosphere
to precipitation, Planet. Space Sci., 25, 773, 1977.
Williams, P. J. S., and A. R. Jain, Observations of the high-latitude trough using EISCAT, J. Atmos. Terr. Phys., 48, 423, 1986. Wilson, G. R., Kinetic modelling of O+up¯ows resulting from ExB
convection heating in the high-latitude F-region ionosphere, J. Geophys. Res., 99, 17453, 1994.
Winser, K. J., G. O. L. Jones, and P. J. S. Williams, A quantitative study of the high latitude ionospheric trough using EISCAT's common programmes, J. Atmos. Terr. Phys., 48, 893, 1986. Winser, K. J., A. Farmer, D. Rees, and A. Aruliah, Ion neutral
dynamics in the high-latitude ionosphere ± 1st results from the INDI experiment, J. Atmos. Terr. Phys., 50, 369, 1988. Winser, K. J., G. O. L. Jones, P. J. S. Williams, and M. Lockwood,
Observations of large ®eld-aligned ¯ows of thermal plasma in the auroral ionosphere, Adv. Space. Res., 9, 57, 1989.
Yau, A. W., B. A. Whalen, W. K. Petersen, and E. G. Shelley, Distribution of up¯owing ionospheric ions in the high-latitude polar cap and auroral ionosphere, J. Geophys. Res., 89, 5507, 1984.
Yau, A. W., E. G. Shelley, W. K. Peterson, and L. Lenchyshyn, Energetic auroral and polar ion out¯ow at DE-1 altitudes: magnitude, composition, magnetic activity dependence, and long-term variations, J. Geophys. Res., 90, 8417, 1985.