HAL Id: insu-03190095
https://hal-insu.archives-ouvertes.fr/insu-03190095
Submitted on 6 Apr 2021
HAL is a multi-disciplinary open access
archive for the deposit and dissemination of
sci-entific research documents, whether they are
pub-lished or not. The documents may come from
teaching and research institutions in France or
abroad, or from public or private research centers.
L’archive ouverte pluridisciplinaire HAL, est
destinée au dépôt et à la diffusion de documents
scientifiques de niveau recherche, publiés ou non,
émanant des établissements d’enseignement et de
recherche français ou étrangers, des laboratoires
publics ou privés.
Distributed under a Creative Commons Attribution - NoDerivatives| 4.0 International
License
The characteristics of particulate absorption, scattering
and attenuation coefficients in the surface ocean;
Contribution of the Tara Oceans expedition
Emmanuel Boss, Marc Picheral, Thomas Leeuw, Alison Chase, Eric Karsenti,
Gabriel Gorsky, Lisa Taylor, Wayne Slade, Josephine Ras, Hervé Claustre
To cite this version:
Emmanuel Boss, Marc Picheral, Thomas Leeuw, Alison Chase, Eric Karsenti, et al.. The
charac-teristics of particulate absorption, scattering and attenuation coefficients in the surface ocean;
Con-tribution of the Tara Oceans expedition. Methods in Oceanography, Elsevier, 2013, 7, pp.52-62.
�10.1016/j.mio.2013.11.002�. �insu-03190095�
Contents lists available atScienceDirect
Methods in Oceanography
journal homepage:www.elsevier.com/locate/mio
Full length article
The characteristics of particulate absorption,
scattering and attenuation coefficients in the
surface ocean; Contribution of the Tara
Oceans expedition
Emmanuel Boss
a,∗, Marc Picheral
b,e, Thomas Leeuw
a,
Alison Chase
a, Eric Karsenti
c, Gabriel Gorsky
b,e, Lisa Taylor
a,
Wayne Slade
d, Josephine Ras
b,e, Herve Claustre
b,eaSchool of Marine Sciences, University of Maine, 458 Aubert Hall, Orono, ME 04401, USA bCNRS, UMR 7093, LOV, Observatoire océanologique, 06230 Villefranche/mer, France cEMBL Heidelberg, Meyerhofstraße 1, 69117 Heidelberg, Germany
dSequoia Scientific, Inc., 2700 Richards Road, Suite 107, Bellevue, WA 98005, USA
eUPMC Univ Paris 06, UMR 7093, LOV, Observatoire océanologique, 06230 Villefranche/mer, France
a r t i c l e i n f o
Article history:
Available online 15 December 2013 Keywords:
Bio-optics
Particle absorption coefficient Particle scattering coefficient Particle attenuation coefficient
a b s t r a c t
A dataset consisting of AC-S measurements of (hyper-) spectral particulate absorption, scattering and attenuation coefficients were obtained from measurements performed on the flow-through system of the R/V Tara during its 2.5-year long expedition.
The AC-S instruments were robust, working continuously with weekly maintenance for about 3 months at a time, and provided absorption (attenuation) data for 454 (375) days, or 90% (75%) of total possible days during the expedition.
This dataset has been mapped to 1 km × 1 km bins to avoid over emphasizing redundant data, and to match the spatial scale of typical ocean color satellite sensors. It consists of nearly 70,000 particulate absorption spectra and about 60,000 particulate scattering and attenuation spectra. These data are found to be consistent with chlorophyll extraction and with the published average shapes of particulate absorption and scattering spectra and bio-optical relationships. This dataset is richer than previous ones
∗Corresponding author. Tel.: +1 207 745 3061; fax: +1 207 581 4388.
E-mail address:[email protected](E. Boss).
http://dx.doi.org/10.1016/j.mio.2013.11.002
in the data from open-ocean (oligotrophic) environments making it more representative of global distributions and of utility for global algorithm development.
© 2013 The Authors. Published by Elsevier B.V.
1. Introduction
The Tara Oceans expedition, a 2.5-year long and 57,000 mile long course (Fig. 1), was conceived to provide a snapshot of the distribution of planktonic organisms in the world ocean, providing ‘‘A global-scale study of morphological, genetic, and functional biodiversity of plankton organisms in relation to the changing physico-chemical parameters of the oceans’’ (Karsenti et al., 2011).
As part of this expedition, we installed an AC-S hyper-spectral spectrophotometer (WET Labs, Inc., Philomath, OR) on R/V Tara’s flow-through seawater system, measuring both absorption and attenuation coefficients. The flow-through seawater was supplied by a diaphragm pump plumbed to the bow intake. By alternating sampling with water passing through a 0.2-
µ
m membrane filter cartridge, we obtained the particulate attenuation and absorption coefficients. While this method has been evaluated previously (e.g.,Dall’Olmo et al.,2009;Slade et al.,2010;Westberry et al.,2010), it has never been used to this extent.In this manuscript we analyze the robustness of the AC-S, present the salient features of the absorption and attenuation data set obtained, and highlight some of the biogeochemical parameters that can be derived from it. In particular, we compare our hyper-spectral data with the multi-spectral data (measured with WET Labs AC-9 instruments) presented inBarnard et al.(1998) andBabin et al. (2003), the most extensive datasets of particulate IOPs published to date.
2. Methods
The in-line sampling system (including a photo) and the data processing methodology have been described in detail inSlade et al.(2010). In short, water from the ship’s flow-through system (pumped from
∼
2 m below surface) was passed through a debubbler and then through a WET Labs AC-S. The AC-S sensor was operated constantly (lamps on) except when in port or once per week for weekly instrument cleaning and filter cartridge replacement. Periodic switching of a custom valve passed 0.
2µ
m filtered seawater through the sensor for 10 min of every hour, or 5 min of every half-hour in coastal waters (the automated valve system has been recently commercialized by Sequoia Scientific, Inc., Bellevue, WA). Interpolating between the readings of filtered water to the time when measurements of the unfiltered water are made (and their subtraction from the measurements without filter) provided the particulate absorption and attenuation values. Absorption data are then corrected for scattering and residual temperature (Slade et al., 2010). The only exception to the protocol inSlade et al.(2010) was for cases when we had absorption data but no attenuation measurements (due to the failure of the c-side of the AC-S (∼
10% of the sampling days)). In that case we processed the data in two ways: (1) assume scattering to be spectrally flat when scatter-correcting the data, as typically done with bench-top spectrophotometers; (2) use the bio-optical relations derived in this paper to obtain a chlorophyll-based attenuation spectra, and use these attenuation spectra to scatter correct the absorption (see below).In series with the AC-S, a SBE45 MicroTSG (Sea-Bird Electronics, Inc., Bellevue, WA) unit was installed in the flow-through system. Note that due to the subtraction of the dissolved spectra and the residual temperature correction, the SBE45 temperature and salinity measurements were not necessary for the processing of the flow-through AC-S measurements.
Data were first averaged to 1-min time bins (to average high frequency system noise, e.g. due to particles which are observed differently by the a- and c-sides of the instrument). These 1 min data were submitted to databases (SeaBASS and PANGAEA) as merged files (using time as the common
Fig. 1. The locations along the Tara Oceans expedition track where AC-S data are available (blue dots) and where HPLC pigment
data were collected (squares).
reference) of the time (synced with GPS), position (GPS), temperature, salinity (TSG) and particulate absorption and attenuation (AC-S).
Second, we further spatially median binned the data into 1 km
×
1 km bins to provide similar scales to those associated with ocean color satellites. Spatial binning avoided over-weighing relatively large datasets collected over nearly two days during Tara Oceans stations conducted near one location while the in-line system was on. The 1 km×
1 km global grid was generated using the SeaWiFS equal area gridding scheme (Campbell et al., 2013). In the analysis requiring uncertainties we only use 1 km2bins where at least three 1 min spectra were located, and their standard deviation is used as the measure of uncertainty.Seawater was collected near the surface (depth
<
5.
1 m) for HPLC pigment analysis at 85 locations where we had AC-S measurements along the cruise track of the R/V Tara. For each sample, we vacuum-filtered 2 L of water through 25 mm (in some cases, 47 mm) diameter Whatman GF/F glass filters with 0.
7µ
m capacity. Filters were frozen in liquid nitrogen and shipped back at the end of up to three legs for extraction and HPLC analysis at the Laboratoire d’Oceanographie de Villefranche. The filters were extracted in 100% methanol (3 mL for 25-mm filters, 6 mL for 47-mm filters) for 2 h, disrupted by sonication, and then clarified by filtration (Whatman GF/F). HPLC analysis was carried out within 24 h after extraction, according to the method described byRas et al.(2008) adapted fromVan Heukelem and Thomas(2001). Here we use only the Total Chlorophyll a value (=
‘‘true’’ Chlorophyll a+
Divinyl-Chlorophyll a+
Chlorophyllide a) in order to calibrate the chlorophyll a pigment product derived from the AC-S.To compute averaged spectra for different trophic regions, we divided the dataset into those with chlorophyll a (as determined by AC-S absorption, see below) concentration below 0
.
1 mg m−3(oligotrophic), those with chlorophyll a concentration between 0.1 and 1 mg m−3(mesotrophic) and
those with chlorophyll a concentration greater than 1 mg m−3(eutrophic). We then computed a weighted-average spectra using, as weight, the inverse of the standard deviation of all the spectra wavelengths taken within a 1 km
×
1 km bin, using only spatial bins with at least three 1-min spectra. Finally we also normalized the spectra by area as inBabin et al.(2003), for the ease of spectral-shape comparison.2.1. Derived biochemical parameters
Using the hyperspectral particulate absorption and attenuation spectra three biogeochemical parameters were derived:
1. a particle size index (
γ
,Boss et al., 2001), by non-linearly fitting a power-law to the particulate beam attenuation spectra (γ
is the negative of the power-law exponent). This parameter is negativelycorrelated with the mean particle size for small particles less than approximately 20
µ
m; the smaller this parameter is the larger the mean particle size. If the size distribution can be assumed to obey a power-law distribution as a function of size (e.g. Junge-type distribution), the exponent of the particle number size distribution(ξ)
is related to(γ )
byξ = γ +
3−
0.
5 exp(−
6γ )
(Boss et al., 2001).We similarly compute the power-law exponent of particulate scattering
(γ
b)
. Theγ
’s are obtained by non-linear least-square fit of the power-law function to the particulate attenuation or scattering spectra using the uncertainty at each wavelength as a weight (thus weighing less wavelengths where the uncertainty in the attenuation or scattering is large). Note that whileγ
is independent of the scattering correction scheme used to obtain the particulate absorption,γ
bcould be affected by it (as scattering is computed as the difference between attenuation and absorption);2. a total chlorophyll a concentration product
(
Ca-Tot)
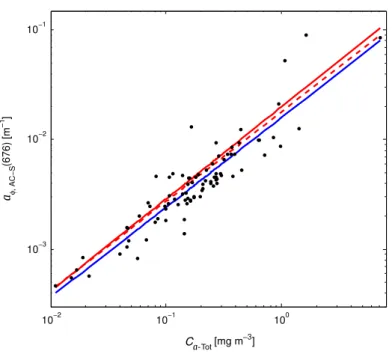
is derived, inspired byBricaud et al.(1995). We compute the absorption line height at 676 nm as in Boss et al.(2007) to approximate the phytoplankton absorption at this wavelength:aφ
(
676) = [
ap(
676) −
39/
65ap(
650) −
26/
65ap(
715)] (
m−1).
For this comparison we averaged the 1-min binned data taken within
+
/−
30 min of HPLC sampling. Ca-Totranged from 0.011 to 7.
27 mg m−3.We linearly regressed (type-I) log
(
aφ(
676))
against log(
Ca-Tot)
using all the HPLC data within 5.1 m from the surface (N=
85,
7.
27≥
Ca-Tot≥
0.
011 mg m−3,Fig. 2) and obtained the following relationship (with 95% confidence interval in brackets):log
(
aφ(
676)) =
0.
82(+/−
0.
08)
log(
Ca-Tot) −
4.
14(+/−
0.
16),
equivalent to: aφ(
676) =
0.
016(+/−
0.
003)
Ca-Tot0.82+/−0.08(
m−1),
which is inverted to obtain a proxy for chlorophyll a from aφ(
676)
:Ca,AC-S
=
157aφ(
676)
1.22(
mg m −3).
The correlation coefficient between the logarithms of Ca-Totand aφ(676) is 0.96 and the RMS relative error in predicting Ca-Totfrom aφ(676) is 38%.
Note that in the cases where no attenuation data were available we obtained this parameter only using the spectrally flat scattering correction, as chlorophyll is a needed input for the alternative one (see below). This is unlikely to result in significant error as the calculation of Ca,AC-Sis based on
wavelengths where the difference between the scattering correction methods is minimal (it is most significant in blue wavelengths);
3. a particulate organic carbon (POC) estimate (using Global relationship from Gardner et al. (2006)).
POC
=
380cp(
660) (
mg C m−3
).
Given the difference from other published relations (e.g.Cetinić et al.(2012) and references therein, taking into account variations in instruments and wavelength), the uncertainty in POC is likely in the order of
+
/−
50%.2.2. Scattering correction in cases where no attenuation was available
In such cases we applied two scattering corrections: (1) assuming spectrally flat scattering spectra as used with bench-top spectrophotometers; and (2) computing the attenuation spectra based on the bio-optical relations derived here:
cp
(
488) =
0.
377Ca0,.53AC-S(
m −1).
γ =
1(
Ca,AC-S<
0.
17)
orγ =
0.
7−
0.
17∗
log(
Ca,AC-S)(
Ca,AC-S≥
0.
17)
cp
(λ) =
cp(
488){λ/
488}
−γ.
This spectra was then used, as inSlade et al.(2010), to scatter correct the particulate absorption spectra. In all cases we assumed the particulate absorption spectra to have a zero average for wavelengths between 726–730 nm.
Fig. 2. AC-S derived absorption line-height at 676 nm vs. total chlorophyll a concentration as determined by HPLC. Blue line
is the regression obtained here while the red line is based onBricaud et al.(1995) and dashed red line is based onBricaud et al.
(1998). The correlation coefficient between the logarithms of Ca-Totand aφ,AC-Sis 0.96 and the rms relative error is 38%. N=85.
(For interpretation of the references to colour in this figure legend, the reader is referred to the web version of this article.)
Table 1
Number of available 1 km2measurements of particulate absorption, scattering and attenuation at specific wavelengths and
their respective statistics. ap∗denotes the particulate absorption for which we used the chlorophyll based scattering correction
when the attenuation was not available (see Section2).
IOP at representativeλ N Mean Median 0.5% 2.5% 97.5% 99.5% ap(440)(m−1) 69,944 0.022 0.015 0.003 0.004 0.098 0.216
ap∗(440)(m−1) 69,944 0.022 0.014 0.003 0.003 0.097 0.221
bp(550)(m−1) 55,883 0.128 0.085 0.029 0.033 0.609 1.280
cp(660)(m−1) 57,188 0.111 0.072 0.025 0.029 0.530 1.196 The resulting difference in ap(440) between the two corrections (flat-proportional) varied from 0.001 to 0
.
009 m−1at the 2.5% and 97.5%, respectively, with a median of 0.
004 m−1. The relative difference in ap(440) between the two corrections{
2|
flat-proportional|
/(
flat+
proportional)}
varied from 1.6% to 67% at the 2.5% and 97.5% level, respectively, with a median of 25%. For the full data set, however, the statistics (Table 1) and statistical relations were not significantly different and we therefore display only the ones with the spectrally flat correction.3. Results and discussion
3.1. Instrumental considerations
The vessel flow-through system was operational a total of 552 days. We lost 51 days of AC-S data in the Mediterranean due to a problem with the data backup system, resulting in 501 potential sampling days. Of these we have AC-S data for 454 days (90%) of which 73 days are only with absorption (failure of the lamp on c-side) and 6 with only attenuation (failure of the lamp on a-side). We had the full set of particulate properties for 375 days (75%). There were two cases where AC-S malfunctions were fixed by the resident engineer on the vessel (in consultation with WETLabs).
Fig. 3. Frequency distributions of selected IOPs and parameters derived from the AC-S spectra. Statistics associated with these
distributions are inTables 1and2.
We used 5 different AC-S sensors belonging to four different labs (serial numbers S/N 007, 043, 057, 082, 091) operating for nine different periods through the 2.5 years of the expedition (average of 3.3 months per sensor, approximately 3 cruise legs, with typical break of
∼
1 week between legs). After each deployment the AC-S lamps were replaced at WET Labs and the sensor was recalibrated.Given that the tables for temperature corrections were created for the S/N 007 sensor (Sullivan et al., 2006), it was not evident that they would apply for other sensors. However, the lack of obvious spectral features in the range of 700–750 nm (see below) suggests using those tables for other sensors (or the same sensor after it had been rebuilt) is sensible.
We obtained a little more than 310,000 1 min averaged particulate absorption spectra and nearly 70,000 1 km2averaged spectra. For comparison, the ‘global’ data set inBarnard et al.(1998) had a total
over 1000 profiles (unique locations), which were reduced to 89 ‘representative’ vertical profiles that included 1914 depth-binned spectra.
3.2. Distributions of values
The distributions of IOPs and biogeochemical variables obtained are within the range reported in the literature (Fig. 3,Tables 1and2). Ca,AC-S spans three orders of magnitude while POC spans
nearly two. The distributions are skewed and do not conform to a parametric log-normal distribution, which is often assumed for bio-optical variables (e.g.Campbell, 1995). This may reflect the fact that these distributions are the sum of different particles (each kind possibly log-normally distributed) of different composition and optical properties.
This data set is particularly rich in oligotrophic data, compared to databases designed for remote sensing applications (Werdell and Bailey, 2005). The value of the spectral exponent of cpis relatively constant and has an average spectral shape proportional to
λ
−1 (Fig. 4). Note, however, that theexponent of the power-law fit to particulate scattering (which is the same as that of backscattering if the particulate ratio is constant spectrally, e.g.Whitmire et al.(2007)) is significantly lower (due to the
Table 2
Number of available 1 km2estimates of total chlorophyll a, Particulate organic carbon (POC), the exponent of the power-law
fit to the particulate attenuation spectra(γ ), the exponent of the power-law fit to the particulate scattering spectra(γb), and
their respective statistics.
Derived parameter N Mean Median 0.5% 2.5% 97.5% 99.5% Chlorophyll a(mg m−3) 69,943 0.26 0.12 0.01 0.013 1.55 4.75
POC(mg m−3) 57,188 42.2 27.2 9.5 11.1 201 358
γ 57,188 0.94 0.95 0.23 0.51 1.25 1.39
γb 55,883 0.73 0.75 −0.08 0.23 1.03 1.18
Fig. 4. Averaged particulate absorption (left), scattering (middle) and attenuation (right) spectra for Ca,AC-S < 0.1 (blue),
0.1<Ca,AC-S <1 (green) and 1<Ca,AC-S(red) (top panel) and their normalized shapes (bottom panels). Black solid lines
are the normalized spectra for the ‘‘global’’ dataset ofBarnard et al.(1998), and the yellow line is fromBabin et al.(2003). Black dashed line is the normalizedλ−1curve while the red dashed line is the normalizedλ−0.75curve, whereλdenotes
the wavelength in vacuum. N represents the number of spectra that were uncertainty-weight-averaged to provide the one displayed. (For interpretation of the references to colour in this figure legend, the reader is referred to the web version of this article.)
effect of absorption). In addition, the beam attenuation spectrum seems to deviate from the power-law spectrum near the 676 nm absorption peak and at wavelengths of highly varied absorption near 440 nm. Such a response to absorption has not been resolved previously with AC-9 measurements, and is consistent with anomalous dispersion (van de Hulst, 1957).
3.3. Comparison to published bio-optical relationships and databases
The derived relationship between absorption line height and chlorophyll (aφ
(
676) =
0.
016(+/−
0.
003)
Ca-Tot0.82+/−0.08, see Section2) is similar toBricaud et al.(1995), who found aφ(
676) =
0.
02C0.841Table 3
Number of available 1 km2estimates of measurements of particulate absorption, scattering and attenuation at specific
wavelengths used to derive a relationship with AC-S estimated total chlorophyll a compared with the relationship provided in
Morel(2009). Correlation coefficient(ρ)and root-mean-square relative error apply to the equation derived for the Tara dataset. 95% confidence intervals of regression parameters are smaller or equal to the uncertainties implied in the rounding of these parameters. Note that using the two different scattering correction for the cases where attenuation was not available (see text) resulted in regressions for ap(490) vs. chlorophyll that were not significantly different.
IOP regressed with Ca,AC-S N Equation here Morel(2009) ρ RMSE%
ap(490)(m−1) 69,943 0.041 Ca0,.61AC-S 0.034 Ca-Tot0.62 0.97 27
bp(550)(m−1) 55,883 0.30 Ca0,.53AC-S 0.30 Ca-Tot0.62 0.95 30
cp(488)(m−1) 55,883 0.345 Ca0,.52AC-S 0.377 Ca-Tot0.53 0.95 28
Fig. 5. Particulate absorption, scattering and attenuation at selected wavelengths compared to AC-S derived Total Chlorophyll
a. Relationship derived in this paper (blue) while in red the relationships provided inMorel(2009). Fit equations and their statistics are inTable 3. (For interpretation of the references to colour in this figure legend, the reader is referred to the web version of this article.)
spectrophotometer (Fig. 2), as well asClaustre et al.(2000) who found aφ
(
676) =
0.
019C0.806a-Tot using an AC-9, providing an additional validation for the AC-S line-height method to obtain Ca-Tot(Fig. 2).
Following Morel (2009) and references therein we regressed the logarithms of particulate absorption, scattering and attenuation at selected wavelengths vs. Ca,AC-S (Table 3). Relationships
are similar to those inMorel(2009) for all parameters (Fig. 5). We note that at very low Ca,AC-S
the scattering and attenuation coefficient seem to reach a relatively constant value. Such a behavior was observed in Ocean Color inversion of particulate backscattering and may represent the optical properties of ‘‘background’’ non-algal particles (Behrenfeld et al., 2005).
3.4. Relation between particulate attenuation and scattering power-law fit exponents
The spectrum of particulate attenuation and scattering do not have the same goodness of fit to a power-law function and their spectral slope is different (Fig. 4). However, recent algorithms for Ocean Color inversion have attempted to obtain the power-law exponent of the particulate backscattering coefficient (Loisel et al.,2006;Kostadinov et al.,2009), which should be the same exponent as that for particulate scattering, if the particulate backscattering ratio is spectrally independent (an assumption that is consistent with measurements, e.g.Whitmire et al.(2007)).
Comparing the power-law exponents for particulate attenuation and scattering (Fig. 6) we found both to be highly correlated
(
r=
0.
95)
and with a type-II regression relationship (using E. Peltzer’s sqfitma.m,http://www.mbari.org/staff/etp3/regress/index.htm) of:γ =
0.
9886(+/−
0.
002)γ
b+
0.
215(+/−
0.
002)
where the terms in parentheses are twice the standard deviation (e.g. 95% confidence interval). The RMSE of this regression is 0.06. In addition, the range of
γ
andγ
bobserved (Table 2) is significantly more restricted than that obtained from remote sensing inversions (e.g. Fig. 4 inLoisel et al.(2006) and Fig. 6 inKostadinov et al.(2009)).Fig. 6. Exponent of the power-law fit to the particulate scattering spectra(γb)as a function of the exponent of the power-law
fit to the particulate attenuation spectra (γ, left) and the frequency distribution ofγb(right). Black line denotes the type II
least-squares fit (details in text).
4. Conclusions
The data collected on board the R/V Tara demonstrate that it is possible, using minimal maintenance (weekly cleaning and filter replacement), to obtain high quality particulate absorption and attenuation at resolutions
<
0.
001 m−1.The AC-S provided highly resolved optical properties and biogeochemical proxies throughout the expedition, on time scales of several months, the time scale of a typical oceanic expedition. Our results (flat absorption spectra for
λ >
700 following residual temperature correction) support the use of Sullivan et al. correction tables (Sullivan et al., 2006) for all AC-Ss to account for the effects of temperature (though more testing is needed as, given our method, only small temperature corrections needed to be applied).The Tara expedition has collected the most ‘global’ and self-consistent set of particulate absorption, scattering and attenuation spectra to date consisting of nearly 70,000 (60,000) spectra of absorption (attenuation and scattering). This dataset differs significantly from previous ones (Barnard et al.,1998; Babin et al.,2003) in that it contains significantly more data in oligotrophic waters (e.g.Fig. 4) and agrees well with the more globally representative dataset used in the previous Case 1 studies (Morel, 2009). As with the older datasets, we expect this new dataset to be useful for parameterization of IOPs in radiative transfer modeling of the ocean. In addition, it provides a wide range of conditions to be used for the validation of remote sensing algorithms (see companion paper byWerdell et al.(2013)). Frequency distributions of particulate IOPs and derived variables are not consistent with a log-normal distribution, in contrast to often-used parameterizations (e.g.Campbell(1995) but seeWhitmire et al. (2007)).
The data collected are consistent with the previous observations for waters with similar values of chlorophyll (Barnard et al.,1998; Babin et al., 2003) as well as for waters with a wide range of chlorophyll concentrations (Bricaud et al.,1995,1998;Claustre et al.,2000;Morel,2009). The spectrum of beam attenuation, while well represented over most of the samples by a power-law spectrum with an exponent near
−
1 is, none-the-less, perturbed from the power-law shape where absorption peaks are significant (anomalous dispersion).The scattering spectra are not well represented by such a shape over a wider range of wavelength (which is still the most prevalent model, e.g.IOCCG(2006)). However, when fitting such a power-law shape for particulate scattering, its value is highly correlated with that of the spectral particulate attenuation and its exponent is offset by
−
0.21 (RMSE of+
/−
0.06). This suggests that the particulate backscattering spectra, if retrievable from the Ocean Color, could, indeed, provide information about size tendencies (yet validation of this concept on oceanic scales is lacking).The consistency between the bio-optical relationship within the Tara dataset and those obtained previously (Morel, 2009) using widely different instrumentation and processing, suggests that the
Tara dataset can be used for remote-sensing validation activities. Indeed,Werdell et al.(2013) find them to be consistent with the previous validation data.
Acknowledgments
The AC-S instrument, used here, would not exist without Ron Zaneveld’s vision and energy. Thanks to J. Loftin for taking care of logistics associated with the AC-S, to S. Searson for taking great care of the AC-S on board Tara, to H. Le Goff for assistance with the installation of the system on board Tara, to S. Kandels for logistical support throughout the Tara Oceans adventure and to World Courier for diligently shipping sensors across the world. Additional thanks to A. Bricaud for discussions of this work and to M. Babin for providing data from his 2003 manuscript. Comments by J. Sullivan, S. Ackleson and an anonymous reviewer have helped to improve this manuscript.
We are keen to thank the commitment of the people and the following institutions and sponsors who made this singular expedition possible: CNRS, EMBL, Genoscope/CEA, UPMC VIB, Stazione Zoologica Anton Dohrn, UNIMIB, ANR, FWO, BIO5, Biosphere 2, agnès b., the Veolia Environment Foundation, Region Bretagne, World Courier, Cap L’Orient, the Foundation EDF Diversiterre, FRB, the Prince Albert II de Monaco Foundation, Etienne Bourgois, the Tara Foundation teams and crew. Tara Oceans would not exist without the continuous support of the participating institutes (seehttp://dx.doi.org/10.1371/journal.pbio.1001177). This is contribution no. 11 of the Tara Oceans Expedition 2009–2012. Funding for the collection and processing of the AC-S data set was provided by NASA Ocean Biology and Biogeochemistry program under grants NNX11AQ14G and NNX09AU43G to the University of Maine.
References
Babin, M., Morel, A., Fournier-Sicre, V., Fell, F., Stramski, D.,2003. Light scattering properties of marine particles in coastal and oceanic waters as related to the particle mass concentration. Limnol. Oceanogr. 48, 843–859.
Barnard, A.H., Pegau, W.S., Zaneveld, J.R.V.,1998. Global relationships in the inherent optical properties of the oceans. J. Geophys. Res. 103, 24955–24968.
Behrenfeld, M.J., Boss, E., Siegel, D.A., Shea, D.M., 2005. Carbon-based ocean productivity and phytoplankton physiology from space. Glob. Biogeochem. Cyc. 19, GB1006.http://dx.doi.org/10.1029/2004GB002299.
Boss, E.S., Collier, R., Larson, G., Fennel, K., Pegau, W.S.,2007. Measurements of spectral optical properties and their relation to biogeochemical variables and processes in Crater Lake, Crater Lake National Park, OR. Hydrobiol. 574, 149–159.
Boss, E., Twardowski, M.S., Herring, S.,2001. Shape of the particulate beam attenuation spectrum and its relation to the size distribution of oceanic particles. App. Opt. 40, 4885–4893.
Bricaud, A., Babin, M., Morel, A., Claustre, H.,1995. Variability in the chlorophyll-specific absorption coefficient of natural phytoplankton: analysis and parametrization. J. Geophys. Res. 100, 13321–13332.
Bricaud, A., Morel, A., Babin, M., Allali, K., Claustre, H.,1998. Variations of light absorption by suspended particles with chlorophyll a concentration in oceanic (case 1) waters: analysis and implications for bio-optical models. J. Geophys. Res. 103, 31033–31044.
Campbell, J.W.,1995. The lognormal distribution as a model for bio-optical variability in the sea. J. Geophys. Res. 100, 13237–13254.
Campbell, J.W., Blaisdell, J.M., Darzi, M.,2013. Level-3 SeaWiFS data products: spatial and temporal binning algorithms. In: SeaWiFS Technical Report Series, NASA Memorandum 104566, vol. 32. Goddard Space Flight Center, Greenbelt.
Cetinić, I., Perry, M.J., Briggs, N.T., Kallin, E., D’Asaro, E.A., Lee, C.M.,2012. Particulate organic carbon and inherent optical properties during 2008 North Atlantic Bloom Experiment. J. Geophys. Res. Oceans 117 (C6), C06028.
Claustre, H., Fell, F., Oubelkheir, K., Prieur, L., Sciandra, A., Gentili, B., Babin, M.,2000. Continuous monitoring of surface optical properties across a geostrophic front: biogeochemical inferences. Limnol. Oceanog. 45, 309–321.
Dall’Olmo, G., Westberry, T.K., Behrenfeld, M.J., Boss, E., Slade, W.H.,2009. Significant contribution of large particles to optical backscattering in the open ocean. Biogeosciences 6, 947–967.
Gardner, W.D., Mishonov, A., Richardson, M.J.,2006. Global POC concentrations from in-situ and satellite data. Deep Sea Res. II 53, 718–740.
IOCCG, 2006. Remote sensing 461 of inherent optical properties: fundamentals, tests of algorithms, and applications. Reports of the International Ocean Colour Coordinating Group No. 5. p. 126.
Karsenti, E., Acinas, S.G., Bork, P., Bowler, C., De Vargas, C., Raes, J., et al., 2011. A holistic approach to marine eco-systems biology. PLoS Biol. 9, e1001177.http://dx.doi.org/10.1371/journal.pbio.1001177.
Kostadinov, T.S., Siegel, D.A., Maritorena, S.,2009. Retrieval of the particle size distribution from satellite ocean color observations. J. Geophys. Res. 114, C09015.
Loisel, H., Nicolas, J-M., Sciandra, A., Stramski, D., Poteau, A., 2006. Spectral dependency of optical backscattering by marine particles from satellite remote sensing of the global ocean. J. Geophys. Res. 111,http://dx.doi.org/10.1029/2005JC003367. Morel, A.,2009. Are the empirical relationships describing the bio-optical properties of case 1 waters consistent and internally
Ras, J., Uitz, J., Claustre, H.,2008. Spatial variability of phytoplankton pigment distribution in the Subtropical South Pacific Ocean: comparison between in situ and modelled data. Biogeosciences 5, 353–369.
Slade, W.H., Boss, E., Dall’Olmo, G., Langner, M.R., Loftin, J., Behrenfeld, M.J., Roesler, C., Westberry, T.K.,2010. Underway and moored methods for improving accuracy in measurement of spectral particulate absorption and attenuation. J. Atmos. Ocean. Tech. 27, 1733–1746.
Sullivan, J.M., Twardowski, M.S., Zaneveld, J.R.V., Moore, C., Barnard, A., Donaghay, P., Rhoades, B.,2006. The hyperspectral temperature and salinity dependencies of absorption by water and heavy water in the 400–750 nm spectral range. Appl. Opt. 45, 5294–5309.
van de Hulst, H.,1957. Light Scattering by Small Particles. Wiley, New York.
Van Heukelem, L., Thomas, C.S.,2001. Computer-assisted high-performance liquid chromatography method development with applications to the isolation and analysis of phytoplankton pigments. J. Chromatog. A 910, 31–49.
Werdell, P.J., Bailey, S.W.,2005. An improved in-situ bio-optical data set for ocean color algorithm development and satellite data product validation. Rem. Sens. Environ. 98, 122–140.
Werdell, J.P., Proctor, W., Boss, E., Leeuw, T., Ouhssain, M.,2013. Underway sampling of marine inherent optical properties on the Tara Oceans expedition as a novel resource for ocean color satellite data product validation. Methods Oceanogr. 7, 40–51.
Westberry, T.K., Dall’Olmo, G., Boss, E., Behrenfeld, M.J., Moutin, T.,2010. Coherence of particulate beam attenuation and backscattering coefficients in diverse open ocean environments. Opt. Express 18, 15419–15425.
Whitmire, A.L., Boss, E., Cowles, T.J., Pegau, W.S.,2007. Spectral variability of the particulate backscattering ratio. Opt. Express 15, 7019–7031.