HAL Id: hal-00301450
https://hal.archives-ouvertes.fr/hal-00301450
Submitted on 6 Oct 2004HAL is a multi-disciplinary open access
archive for the deposit and dissemination of sci-entific research documents, whether they are pub-lished or not. The documents may come from teaching and research institutions in France or abroad, or from public or private research centers.
L’archive ouverte pluridisciplinaire HAL, est destinée au dépôt et à la diffusion de documents scientifiques de niveau recherche, publiés ou non, émanant des établissements d’enseignement et de recherche français ou étrangers, des laboratoires publics ou privés.
The effects of lightning-produced NOx and its vertical
distribution on atmospheric chemistry: sensitivity
simulations with MATCH-MPIC
L. J. Labrador, R. von Kuhlmann, M. G. Lawrence
To cite this version:
L. J. Labrador, R. von Kuhlmann, M. G. Lawrence. The effects of lightning-produced NOx and its vertical distribution on atmospheric chemistry: sensitivity simulations with MATCH-MPIC. Atmo-spheric Chemistry and Physics Discussions, European Geosciences Union, 2004, 4 (5), pp.6239-6281. �hal-00301450�
ACPD
4, 6239–6281, 2004 Effects of lightning-NOxon tropospheric chemistry L. Labrador et al. Title Page Abstract Introduction Conclusions References Tables Figures J I J I Back CloseFull Screen / Esc
Print Version Interactive Discussion
© EGU 2004
Atmos. Chem. Phys. Discuss., 4, 6239–6281, 2004 www.atmos-chem-phys.org/acpd/4/6239/
SRef-ID: 1680-7375/acpd/2004-4-6239 © European Geosciences Union 2004
Atmospheric Chemistry and Physics Discussions
The e
ffects of lightning-produced NO
x
and
its vertical distribution on atmospheric
chemistry: sensitivity simulations with
MATCH-MPIC
L. J. Labrador, R. von Kuhlmann, and M. G. Lawrence
Max-Planck Institute for Chemistry, Mainz, Germany
Received: 6 July 2004 – Accepted: 13 August 2004 – Published: 6 October 2004 Correspondence to: L. Labrador (lorenzo@mpch-mainz.mpg.de)
ACPD
4, 6239–6281, 2004 Effects of lightning-NOxon tropospheric chemistry L. Labrador et al. Title Page Abstract Introduction Conclusions References Tables Figures J I J I Back CloseFull Screen / Esc
Print Version Interactive Discussion
© EGU 2004
Abstract
The impact of different assumptions concerning the source magnitude as well as the vertical placement of lightning-produced nitrogen oxides is studied using the global chemistry transport model MATCH-MPIC. The responses of NOx, O3, OH, HNO3and peroxyacetyl-nitrate (PAN) are investigated. A marked sensitivity to both parameters
5
was found. NOx burdens globally can be enhanced up to 100% depending on the ver-tical placement and source magnitude strength. In all cases, the largest enhancements occur in the tropical upper troposphere, where lifetimes of most trace gases are longer and where they thus become more susceptible to long-range transport by long-range circulation patterns. Comparison with observations indicate that the 0 and 20 Tg/yr(N)
10
production rates of NOxfrom lightning are too low and too high a source magnitude, re-spectively. However, no single intermediate production rate or vertical distribution can be singled out as best fitting the observations due to the large scatter in the datasets. This underscores the need for further measurement campaigns in key regions. The vertical profiles ofPickering et al.(1998) have been implemented in MATCH-MPIC for
15
this study.
1. Introduction
Nitrogen oxides (NOx=NO+NO2) play an important role in tropospheric chemistry. They are catalytic precursors of ozone (O3) and also have a strong influence on the hydroxyl radical (OH) concentration. Lightning-produced nitrogen oxides constitute an
20
important part of the total NOxbudget and are one of the sources with the largest un-certainty, with estimates ranging from 1–20 Tg(N)/yr (Lawrence et al.,1995;Price et al.,
1997a). Produced mostly in and around active thunderstorms, lightning-produced NOx (ltNOxhereafter) is readily carried to the upper levels of the troposphere by convection, where its lifetime is considerably longer than in the lower troposphere (LT). The link
25
ACPD
4, 6239–6281, 2004 Effects of lightning-NOxon tropospheric chemistry L. Labrador et al. Title Page Abstract Introduction Conclusions References Tables Figures J I J I Back CloseFull Screen / Esc
Print Version Interactive Discussion
© EGU 2004
Liebig (von Liebig,1827), although it was not until the 1970s that further studies started to be conducted to determine its role in the photochemistry of the LT, primarily in con-trolling ozone concentrations. LtNOx is also closely linked with OH radical production and hence has the potential to affect the atmosphere’s oxidizing efficiency (Labrador
et al.,2004). In order to determine an accurate budget for tropospheric ozone, it is
5
crucial to determine an accurate budget for LtNOx. The large uncertainty in LtNOx pro-duction estimates is reflected in Table 1. From early estimates of the propro-duction range exceeding 100 Tg(N)/yr, only in the last decade do we see the estimates in different studies settling within the 1–20 Tg(N) range. The reasons for these uncertainties are many-fold; among them, on the one hand, the relatively poorly understood aspects of
10
the lightning phenomenon itself, including the charge separation process, the amount of energy deposited per flash, the partitioning among cloud-to-ground, intracloud and intercloud flashes, and on the other hand, those aspects related to the production of NOx, such as the amount of NO molecules produced per flash or per unit energy. While a number of laboratory studies have been carried out to determine these parameters,
15
issues such as the similarity of simulated sparks to real flashes and the scalability of laboratory measurements to the characteristic dimensions of the atmosphere may be a source of error. The global distribution of lightning, and the total global flash rate con-tinue to be a source of uncertainty, although this has been improved substantially by the recent advent of dedicated space-borne observation platforms such as the Optical
20
Transient Detector (OTD) and Lightning Imaging Sensor (LIS) (Christian et al.,2003). Airborne observation campaigns provide critically-needed data to help validate model results. As will be discussed later, there is a definite need for further measurements of NOxenhancements in storm areas, particularly in the tropics.
3-D global chemistry transport models also constitute useful and powerful tools to
25
study the production of LtNOx and its potential effects on atmospheric chemistry. In this paper, we study the sensitivity of tropospheric chemistry to various assumptions concerning the vertical placement and source magnitude of LtNOx using a 3-D chem-istry transport model. Given the uncertainties mentioned above, it is currently difficult
ACPD
4, 6239–6281, 2004 Effects of lightning-NOxon tropospheric chemistry L. Labrador et al. Title Page Abstract Introduction Conclusions References Tables Figures J I J I Back CloseFull Screen / Esc
Print Version Interactive Discussion
© EGU 2004
to arrive at definitive conclusions on the effects of these two parameters on the overall lightning NOx issue. In the light of this, our main objective with this study is to add to the groundwork of knowledge on the issue of lightning-produced NOx with the help of a modeling tool.
This study is broken down as follows; in Sect. 2 a brief description of our modeling
5
tool, as well as our approach to modeling the vertical distribution of LtNOx, is laid out. In Sect. 3, the results of model runs with 3 different assumptions concerning the ver-tical placement of LtNOx and 5 different total amounts are considered. In Sect. 4 the sensitivity of a number of tropospheric trace gases to different LtNOx source magni-tudes is discussed. In Sect. 5 the results of our different runs are compared with a set
10
of observations for NOx. Section 6 gives our conclusions.
2. Approach to modeling LtNOx
The model used for this study is the Model of Atmospheric Transport and Chemistry, Max-Planck Institute for Chemistry version, or MATCH-MPIC, an off-line chemistry and transport model based on the NCAR CCM (Community Climate Model) that consists of
15
two main parts, a meteorology module and a chemistry module. The chemistry mod-ule comprises a suite of 140 gas phase reactions plus one heterogeneous reaction, including the major known sources and sinks of ozone and its associated chemistry as described in detail in von Kuhlmann et al. (2003a). MATCH-MPIC is an off-line model, and therefore needs basic meteorological data as input (temperature, zonal
20
and meridional winds, surface pressure, latent and sensible heat fluxes) to calculate the remaining meteorological parameters, namely vertical wind velocity, convective mass fluxes, cloud fraction and precipitation and vertical turbulence. Two schemes are used to parameterize moist convection; the penetrative deep convection scheme byZhang
and McFarlane (1995), plus the convective adjustment scheme byHack (1994). The
25
runs for this study were done with input data from the NCEP/NCAR reanalysis at a reduced horizontal resolution of T21 (approximately 5.6◦×5.6◦) and an unchanged
ver-ACPD
4, 6239–6281, 2004 Effects of lightning-NOxon tropospheric chemistry L. Labrador et al. Title Page Abstract Introduction Conclusions References Tables Figures J I J I Back CloseFull Screen / Esc
Print Version Interactive Discussion
© EGU 2004
tical resolution which comprises 28 levels, from the surface to 0.2 hPa, in sigma co-ordinates. The runs were carried out for the year 1997 with a spin-up time of four months, and a timestep of 30 min was used. Further details on MATCH-MPIC are in
von Kuhlmann et al.(2003a),Lawrence et al. (1999,2003a),Rasch et al.(1997) and references therein.
5
2.1. Lightning parameterization
The parameterization for the horizontal distribution of lightning used in MATCH-MPIC is based onPrice and Rind(1992)(PR92 hereafter). PR92 developed a simple lightning parameterization based on cloud top height as a predictor of lightning activity. It has been shown that efficient charge buildup and separation processes are strongly
depen-10
dent on updraft velocity. Cloud top height has in turn been shown to correlate positively with updraft velocity. This, plus the possibility to readily determine cloud top height from direct satellite measurements, was the basis for choosing it as a first suitable predic-tor of lightning activity. The parameterized relationship between cloud top height and flash frequency is: F=3.44×10⁵H4.9for continental convective clouds, and F=6.4×10⁴
15
H1.73for marine clouds, where F is the flash frequency (in flashes/min/8◦×10◦box) and H is the modeled cloud top height (in km). Figure 1 shows the averaged global light-ning distribution using PR92 in MATCH-MPIC for the year 1997 and as observed by the OTD and LIS for the the period from mid 1997 to early 2003. The model captures the main features and the general pattern of the observed flash distribution well. The
20
flash activity over the South Eastern United States is well reproduced, as is the overall pattern over India and South East Asia. However, an overestimation of the flash activ-ity is apparent over the tropics, particularly over northern and central South America, Central America, South-East Asia, eastern India, eastern Borneo, Papua-New Guinea and northern Australia. On the other hand, flash activity is underestimated mostly
25
over the extratropics, particularly over the Western and South Western United States, the Mediterranean basin, parts of central Europe and the Caucasus range, the Mid-dle East, Central and South-Central Asia, north-eastern China and southern Australia.
ACPD
4, 6239–6281, 2004 Effects of lightning-NOxon tropospheric chemistry L. Labrador et al. Title Page Abstract Introduction Conclusions References Tables Figures J I J I Back CloseFull Screen / Esc
Print Version Interactive Discussion
© EGU 2004
Most of the activity over Indonesia is underestimated, except for easternmost Borneo. The strong signal over the congo basin is well reproduced except for some underes-timation at the center of the feature. Coastal lightning is mostly underestimated by the model as is marine lightning, particulalrly over the North and South Atlantic and the north-western Pacific. While these discrepancies might be a result of the
param-5
eterization itself, other factors, such as the convection parameterization used and the model’s failure to reproduce off-shore transport of lightning-active convective clouds, may also play a role. In the last few years, other lightning parameterizations have been proposed, particularly focusing on using convective mass fluxes (Allen and Pickering,
2002); the use of these in MATCH-MPIC is being examined in a parallel study.
10
2.2. Vertical distribution of LtNOxin MATCH-MPIC
In previous versions of MATCH-MPIC, LtNOx was input as a uniform volume mixing ratio throughout the vertical convective column. This was chosen based on three assumptions; first, intracloud flashes are much more frequent than cloud to ground flashes (Price and Rind,1994). Second, cloud to ground discharges are much more
15
energetic than intracloud discharges (Turman,1978;Kowalczyk and Bauer,1982) and third, NOxproduction by lightning apparently exhibits a strong dependence on the am-bient air density, being less for lower densities (Goldenbaum and Dickerson, 1993). The first two can be regarded as canceling each other out to an extent. The third assumption results in a an approximately even mixing ratio (i.e. density-weighted)
dis-20
tribution of the emissions in the vertical. While these assumption are hard to prove or disprove, there is recent evidence that the vertical distribution of LtNOx in deep-convective clouds is likely to be quite different than an even mixing ratio in the vertical.
Pickering et al.(1998) (subsequently P98) used a cloud-resolving model to develop a set of profiles to typify the vertical distribution of LtNOx after a convective storm for
25
use in specifying the effective lightning NOx source in global and regional chemistry models. Profiles were computed for three different regimes: tropical continental, ma-rine continental and mid-latitude continental. We have implemented all three profiles
ACPD
4, 6239–6281, 2004 Effects of lightning-NOxon tropospheric chemistry L. Labrador et al. Title Page Abstract Introduction Conclusions References Tables Figures J I J I Back CloseFull Screen / Esc
Print Version Interactive Discussion
© EGU 2004
from P98 in MATCH-MPIC and, since a midlatitude marine profile was not developed in P98, we adopted the midlatitude continental profile for all midlatitude areas, marine areas included. The profiles were scaled (stretched or squeezed in the vertical) to fit the depth of convection in each model column.
A recent study byZhang et al.(2003) has shown that simulations of different storms
5
can lead to qualitatively similar but quantitatively different profiles from P98. Thus, more work is needed to determine the most appropriate assumptions for use in global models. Here we examine the basic sensitivity of the simulated tropospheric chemistry to various assumed profiles of LtNOx, which provides an indication of the degree of importance of refining the knowledge and parameterizations of its vertical placement.
10
2.3. Sensitivity studies
In order to assess the impact of LtNOxand its vertical placement on tropospheric chem-istry, a set of sensitivity runs was carried out where a number of different assumptions concerning the source strength and the vertical distribution of the lightning NOxsource were implemented, as summarized in Table 2.
15
First, a run in which the lightning NOx source was turned off (NoLtNOx run) was carried out. Although a zero ltNOx production rate is not realistic, this run serves as a “Gedankenexperiment” against which to compare other runs, in order to be able to assess the net impact of the lightning NOx source on the model’s NOxdistribution and budget.
20
Second, a series of runs with various LtNOxsource magnitudes was done with 3 ver-tical distributions: 1) a density-weighted distribution as in previous versions of MATCH-MPIC, from cloud top to ground (or cloud bottom over the oceans), which we will refer to as the EVEN distribution; 2) the distribution according to the vertical profiles de-veloped by Pickering et al. (1998), hereafter referred to as the PICK distribution; 3)
25
a distribution in which all of the LtNOx is deposited in the five top-most layers of the convective column, intended to represent the upper limit of upward transport of LtNOx by convective updrafts which we will call the ANVIL distribution.
ACPD
4, 6239–6281, 2004 Effects of lightning-NOxon tropospheric chemistry L. Labrador et al. Title Page Abstract Introduction Conclusions References Tables Figures J I J I Back CloseFull Screen / Esc
Print Version Interactive Discussion
© EGU 2004
The mean vertical profiles of the lightning NOx source in MATCH-MPIC based on these three assumptions are plotted in Fig. 2. The EVEN distribution simulates an even-mixing ratio profile in the vertical, which means decreasing fluxes with altitude, as plotted in all 3 cases. The PICK midlatitude continental distribution deposits the largest amount of LtNOxin the LT, more than 100% greater than the EVEN distribution.
5
Interestingly, in this profile, the maximum fluxes at the surface are nearly twice as large as those at high altitude. In the tropical continental and tropical marine cases, while the PICK distribution still simulates relatively large fluxes at the lower levels, those are ∼15% and ∼60% lower, respectively, than those of the EVEN distribution at the same levels. The ANVIL distribution simulates, as expected, little or no fluxes at the lower
10
levels and peaks at ∼400 hPa in all three cases. Due to this and the large fluxes of the PICK continental distributions in the LT, the ANVIL distribution values are higher, by over 10%, than the PICK values at high altitudes in these two cases.
Different LtNOxsource magnitudes, spanning the currently accepted range of uncer-tainties in the source, were used for these distributions. A series of runs with a 2, 5, and
15
10 Tg(N)/yr LtNOx production rate using the EVEN distribution were carried out (here-after EVEN2, EVEN5 and EVEN10). Similarly, runs with a 2, 5, 10 and 20 Tg(N)/yr LtNOx production rate using the PICK distribution (hereafter PICK2, PICK5, PICK10 and PICK 20 runs) and a 2 and 5 Tg(N)/yr production rate using the ANVIL distribution (ANVIL2 and ANVIL5 runs) were made. The largest source (20 Tg(N)/yr), which we
20
consider to be relatively unlikely, was only examined for the “best” vertical distribution (i.e. PICK20). In this study, we will analyze the effects of these different vertical distri-butions and source magnitudes on NOx, O3, OH, HNO3and peroxyacetyl nitrate (PAN, hereafter). We will focus our discussion on the PICK5 run, since it best reflects the cur-rently accepted estimate for LtNOx and the most physically-based vertical distribution
25
ACPD
4, 6239–6281, 2004 Effects of lightning-NOxon tropospheric chemistry L. Labrador et al. Title Page Abstract Introduction Conclusions References Tables Figures J I J I Back CloseFull Screen / Esc
Print Version Interactive Discussion
© EGU 2004
3. Significance of LtNOx for tropospheric NOxconcentrations
In this section, we will analyze the significance of the source of NOxfrom lightning on total NOx concentrations. To that end, we will compare the results of the PICK5 run (i.e. our reference run) against the NoLtNOxrun. Figure 3a and b depict the ratio of the annual zonal means of the the PICK5 vs NoLtNOxruns, and the ratio of the horizontal
5
NOx distributions at 300 hPa, respectively. Most of the enhancement due to LtNOx takes place in the tropical mid- and upper troposphere, mainly between 40◦north and south latitude and between 800 and 200 hPa. A 20% enhancement in the zonal mean mid- and upper troposphere is evident at 700 hPa, peaking at approximately 300 hPa over the equator, where a factor of 3.4 more NOx is present compared to the NoLtNOx
10
run. The largest enhancements in the tropical upper troposphere (UT) are consistent with lightning activity, which is predominant over the tropics and continental regions (Christian et al.,2003), especially over equatorial South America, central Africa, and Indonesia. However, based on the preliminary evaluation discussed above, compar-isons with OTD data indicate that the enhancements in NOx might be biased high
15
due to a tendency of the lightning parameterization to overestimate flash activity in the tropics. We see that, despite the fact that the PICK5 vertical distribution of LtNOx prescribes around 20% of the total LtNOx to be released in the first 2 km above the continental landmasses, the enhancement there is relatively small. This is mainly due to the fact that, at surface levels, LtNOx must compete against other surface sources,
20
such as soils, biomass burning and urban and industrial fossil fuel burning emissions. Interestingly, the addition of LtNOx causes surface total NOx mixing ratios to de-crease by ∼5%, particularly over the extratropical LT (Fig. 4a). Stockwell et al.(1999) found the same result, particularly over Europe and North America, and attributed it to increases in OH due to the general increase in O3 when lightning is included in
25
their model simulations. There are two mechanisms to account for the computed NOx losses, namely the reaction of OH with NO2to form HNO3and the conversion of N2O5 into HNO3via hydrolysis on aerosols. Figure 4b shows the annual mean surface ratio of
ACPD
4, 6239–6281, 2004 Effects of lightning-NOxon tropospheric chemistry L. Labrador et al. Title Page Abstract Introduction Conclusions References Tables Figures J I J I Back CloseFull Screen / Esc
Print Version Interactive Discussion
© EGU 2004
OH for the PICK5 and the NoLtNOxruns. A general decrease of ∼2% in surface OH is simulated over most midlatitude and some tropical landmasses when LtNOxis included in our simulations, mainly between 50◦north and 40◦south, rendering the firts mechan-sism unsuitable to explain the loss (NO2 levels do increase slightly but not enough to compensate for the decrease in OH).Stockwell et al.(1999)’s explanation can be used
5
to interpret our results outside of that latitude range where, in our simulations, surface OH increases when adding LtNOx. However, wherever there is a decrease in surface OH, the negative NOx feedback can only be explained by an increase in the NOxloss rate via the second loss reaction. This mechanism depends partly on O3levels, which control the formation of NO3and therefore N2O5. We compute an increase in surface
10
O3 concentration of ∼ 3% for the midlatitude continental areas (not shown), largely due to downward convective mixing of O3 produced by LtNOx aloft (Lawrence et al.,
2003b). This enhances the loss of NOy via hydrolysis of N2O5, and ultimately leads to the computed reduction in NOxlevels.
4. Effects of the different assumptions of vertical placement of ltNOx on the
15
vertical distribution of different trace gases
What is the impact of the different assumed vertical distributions of LtNOx on atmo-spheric chemistry? In order to answer this question, we compare the effects of the three main vertical distributions tested in this study for the 5 Tg(N)/yr source, i.e. EVEN5, PICK5, and ANVIL5, against the NoLtNOx. We consider NOx as well as O3, OH,
20
HNO3 and PAN. Common to all three distributions is that the largest enhancement in all of these species occurs in the tropical UT, between approximately 500 and 300 hPa, with the main differences being in the magnitude and the vertical extent of the enhance-ment.
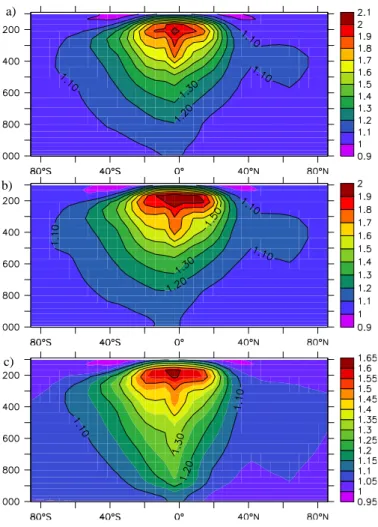
The EVEN5 distribution (Fig. 5b) results in a gradual enhancement in NOx with
alti-25
tude, consistent with a density-weighted distribution, reaching a maximum of a factor of 2 higher than the NoLtNOxrun between approximately 300 and 400 hPa above the
ACPD
4, 6239–6281, 2004 Effects of lightning-NOxon tropospheric chemistry L. Labrador et al. Title Page Abstract Introduction Conclusions References Tables Figures J I J I Back CloseFull Screen / Esc
Print Version Interactive Discussion
© EGU 2004
equator. This is quite different than the PICK5 and ANVIL5 runs (Figs. 3a and 5a, respectively), which simulate very similar enhancements to each other, although the ANVIL5 run, more weighted toward the UT, simulates a reduction below 900 hPa at all latitudes and no evident enhancement below 800 hPa. The maximum enhancement in these two runs is about a factor of 3 higher than the mixing ratio of the NoLtNOx run
5
at 300–400 hPa and represents a 100% larger enhancement than computed for the EVEN5 distribution. Considering that all three runs were done with the same 5 Tg(N)/yr LtNOx production rate, this is a significant result, since accounting for the uplifting by convection in the PICK5 and ANVIL5 runs results in twice the enhancement of NOx in the UT compared to the EVEN distribution. In all three runs, decreases in total NOx
10
are computed at the surface in the extratropics and even in the tropics in the ANVIL5 run. As discussed before, this is mainly due to downward transport of ozone produced by enhanced NOxin the UT, reducing the near-surface NOxlifetime
Much like with NOx, a gradual vertical enhancement of O3is simulated in the EVEN5 run (Fig. 6c), with the largest enhancements occurring at the tropical latitudes. Surface
15
enhancements range from 12% within the tropics to ∼4% at high latitudes. The peak enhancement is approximately 30% between 200 and 700 hPa in the tropics. Again, the PICK5 and ANVIL5 runs (Figs. 6a and b, respectively) simulate very similar profiles except at the surface, where the PICK5 run results in an enhancement of up to 15% close to the equator and ∼10% in the tropical regions, compared to a maximum zonal
20
mean surface layer enhancement of 10% in the ANVIL5 run for most of the tropics. The largest enhancements in both runs are simulated between 200 and 400 hPa over the tropics with 45% more O3compared to the NoLtNOx run. The general differences in tropospheric O3 as a result of the different vertical placements emphasize the role of NOx in controlling the O3 budget, and underscores the need not only to determine
25
an accurate estimates of the LtNOx source magnitude, but also to correctly assess its post-storm vertical distribution.
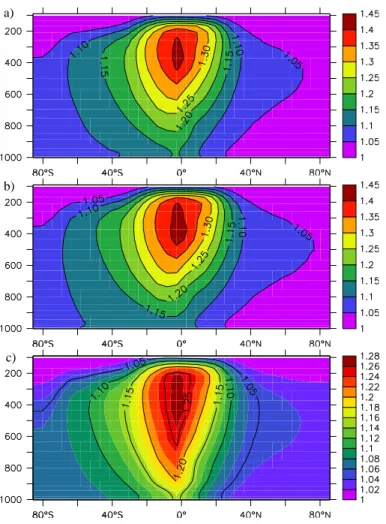
There is a significant impact on OH by LtNOx. In the EVEN5 run (Fig. 7c), enhance-ments of up to 60% with respect to the NoLtNOx run are simulated in the tropical UT,
ACPD
4, 6239–6281, 2004 Effects of lightning-NOxon tropospheric chemistry L. Labrador et al. Title Page Abstract Introduction Conclusions References Tables Figures J I J I Back CloseFull Screen / Esc
Print Version Interactive Discussion
© EGU 2004
mainly in the altitude band between 300 and 100 hPa. Again the PICK5 and ANVIL5 runs (Figs. 7a and b, respectively) show very similar profiles for OH, with enhance-ments of approximately 100% between 100 and 200 hPa. All three runs also simulate enhancements of about 10% near surface levels in the tropics. The enhancements in the cold and dry tropical UT are because there production of OH via O(1D)+H2O
5
is slow, while secondary sources, such as enhancements in HOx recycling efficiency due to NOx increases, take on a more important role. Despite the strong temperature dependency of the oxidation reactions of long-lived trace gas such as methane and methylchloroform, this result has an important effect on the oxidizing efficiency of the troposphere, and increases in the source magnitude of LtNOxcan lead to a substantial
10
reduction in the computed lifetimes of these trace gases (Labrador et al.,2004). There is a very sensitive response of nitric acid, one of the main reservoirs through which reactive nitrogen is lost (via dry and wet deposition), to LtNOx. All three distri-butions simulate enhancements greater than a factor of 2 with respect to the NoLtNOx run, as can be seen in Figs. 8 a, b and c. The particularly sensitive response is due
15
to the fact that, on adding LtNOx, a direct precursor of nitric acid, another precursor, OH, is also enhanced. From all three distributions, it can be observed that, compared to most other trace gases discussed, the maximum enhancements in nitric acid occur at a somewhat lower altitude i.e. between 400 and 500 hPa. Two main reasons could account for this fact: first, while the largest relative increase in OH by adding LtNOx
oc-20
curs in the UT, the largest absolute enhancement occurs at a lower altitude (Labrador
et al.,2004), coinciding with the maximum enhancement in nitric acid. Furthermore, in the UT, there is a buffering effect of PAN, which is enhanced at the expense of nitric acid. The PICK5 and ANVIL5 runs (Figs. 8a and b, respectively) are very similar, al-though the enhancement in the UT at higher latitudes is greater in the ANVIL5 run and
25
the PICK5 run simulates larger enhancements than the ANVIL5 run in the lowermost levels.
The importance of the NOx reservoir species peroxyacetyl nitrate (PAN) lies in its high stability at low temperatures. Once produced, it can be transported long
dis-ACPD
4, 6239–6281, 2004 Effects of lightning-NOxon tropospheric chemistry L. Labrador et al. Title Page Abstract Introduction Conclusions References Tables Figures J I J I Back CloseFull Screen / Esc
Print Version Interactive Discussion
© EGU 2004
tances and, through thermal degradation, it can introduce NOx into remote regions, where background levels are generally low. As shown in Figure 9a, the burden of PAN is doubled in the tropical UT by assuming the PICK5 lightning NOx vertical distribu-tion. The EVEN5 run (Fig. 9c) simulates increases of over 50% from 500 hPa up to tropopause level over the tropics, where values peak at a factor of 1.6 larger than the
5
NoLtNOxrun. The PICK5 and ANVIL5 runs (Figs. 9a and b, respectively) show again a very similar pattern. Maximum enhancements are of the order of 100% between ∼300 and 200 hPa in both distributions, with enhancements decreasing rapidly outside of the tropical latitudes. All three distribution simulate enhancements in PAN in the UT, as a result of increases in total NOx in the same region. The ANVIL5 run simulates no
10
notable enhancement at the surface, whereas the PICK5 run shows a 10% enhance-ment, consistent with the placement of NOx by the PICK98 profiles in the lowermost troposphere.
5. Sensitivity of tropospheric trace gas burdens to the increase in the source of NOxfrom lightning
15
In this section, we analyze the responses of NOx, as well as O3, OH, HNO3and PAN to increases in the source magnitude of LtNOx. We calculated the burdens of these trace gases for the whole globe (90◦north to 90◦south), the tropics (between 25◦north and south), and the extratropics (90◦ to 25◦ north and 25◦ south to 90◦ south), for the EVEN2, 5 and 10 and PICK2, 5, 10 and 20 runs. Since the PICK and ANVIL runs
20
produce mostly similar results, we will limit our comparison to the EVEN and PICK set of runs.
Fig. 10a–e show the burdens for the EVEN and PICK runs as a function of the LtNOx source magnitude. A consistent tendency was for the PICK runs to result in higher burdens for all trace gases than the EVEN runs, due to their lifetimes generally being
25
longer in the UT, where most of the NOxin the PICK runs is released.
ACPD
4, 6239–6281, 2004 Effects of lightning-NOxon tropospheric chemistry L. Labrador et al. Title Page Abstract Introduction Conclusions References Tables Figures J I J I Back CloseFull Screen / Esc
Print Version Interactive Discussion
© EGU 2004
2 Tg(N)/yr–5 Tg(N)/yr and which becomes very clear in the 20 Tg(N)/yr production rate. The response of the EVEN set of runs is similar to the PICK runs, although the mag-nitude of the absolute increase in total NOxis not as marked as that of the PICK runs. Interestingly, the difference in the total NOxburden for equivalent production rates be-tween the PICK and EVEN runs increases with increasing LtNOx: relative to the NO
5
LtNOx run, the PICK2 run simulates a total NOx burden 2.5% larger than the EVEN2 run. For the 5 and 10 Tg(N)/yr production rates, these differences are 4.3 and 5.3%, re-spectively. This is as a consequence of the weighting of the PICK distribution towards the higher altitudes, as opposed to the even (density-weighted) EVEN distribution.
The tropical regions simulate a more sensitive response, due in large part to the
10
fact that most of the lightning activity in the model is concentrated there (Fig. 1) and because the other competing sources (especially fossil-fuel burning) tend to be smaller in the tropics than in the extratropics. Though the same non-linear response as in the whole globe is also present, increases in total NOx are larger. The differences in burden growth with respect to the NoLtNOxrun between the PICK and EVEN runs are
15
also larger than in the whole globe: 4%, 6.7% and 7.9% for the 2, 5 and 10 Tg(N)/yr production rates, respectively.
As with NOx, O3shows a non-linear response to increases in LtNOx, tending towards saturation at the highest end of the range in both sets of runs. The PICK runs simulate larger enhancements throughout the entire production range, particularly in the tropical
20
regions (Fig. 10b and Table 3). Globally, the PICK20 run simulates increases of up to 30% with respect to the NoLtNOx run, while in the tropics O3 is enhanced by 45% for the same run. These enhancements are all the more important considering that they take place in the UT, where longer lifetimes and the Hadley circulation can transport this ozone to higher latitudes and because O3is more efficient as a greenhouse gas at
25
higher altitudes. This increase of O3at higher altitudes is responsible for the reduction of surface NOxlevels simulated at high latitudes in Figs 2a and 4a.
Figure 10c shows that the relative change in global enhancement of the OH burden is greater than that of O3and is close to that of NOx. Table 4 shows the regional annual
ACPD
4, 6239–6281, 2004 Effects of lightning-NOxon tropospheric chemistry L. Labrador et al. Title Page Abstract Introduction Conclusions References Tables Figures J I J I Back CloseFull Screen / Esc
Print Version Interactive Discussion
© EGU 2004
mass-weighted OH mean concentrations, as suggested byLawrence et al.(2001), for the different vertical distributions with a 5 Tg(N)/yr LtNOxproduction rate, as well as the relative increases of the two vertical distributions versus the NoLtNOxrun. The largest OH increases in all three distributions are in the southern hemisphere, despite the lightning activity being dominant over the northern hemisphere (Christian et al.,2003).
5
For instance, in the EVEN5 distribution, the enhancements in the 90◦S–30◦S domains at all altitudes are about a factor of two larger than those in the equivalent domains in the northern hemisphere, whereas in the in the 30◦S–0◦ domains, they are about 50% larger than in the 0◦–30◦N ones. In the PICK distribution the enhancements in the 90◦S–30◦S regions below 750 hPa are a factor of three larger, and in the 750–500 hPa
10
and 500–250 hPa domains approximately a factor of two larger than the equivalent northern hemisphere domains. In the 30◦S–0◦ domains, the enhancements are about 50% larger than in the 0◦–30◦N domains. This marked sensitivity of the southern hemisphere to LtNOx is a result of smaller total NOx emissions from other sources, which makes OH more sensitive to increases in NOx there. The PICK distribution
15
simulates larger relative increases vs. the NoLtNOxrun in the uppermost domains than the EVEN distribution, particularly in the tropics, consistent with the larger amounts of LtNOxdeposited in the upper levels by the former.
Nitric acid (HNO3) (Fig. 10d) shows a marked sensitivity to increases in LtNOxwhich is different from the other gases. There is more than a doubling in its burden between
20
the 2 and 5 Tg(N)/yr runs in both the PICK and EVEN distributions over the whole globe as well as in the tropics. For higher production rates, the approximately linear response continues without abatement until the top of the production range for both sets of runs, with enhancements of over 100% and 200% over the whole globe and tropics, respectively, in the PICK20 run. This sensitivity increases with the magnitude
25
of the source of NOx from lightning (Table 3) and is due to the increase in its two main precursors, NO2 and OH. From Fig. 10d, it is readily apparent that the burdens for the tropical and extratropical regions are very approximately the same; this is in part accounted for by the fact that the OH radical is more abundant in the tropics (see
ACPD
4, 6239–6281, 2004 Effects of lightning-NOxon tropospheric chemistry L. Labrador et al. Title Page Abstract Introduction Conclusions References Tables Figures J I J I Back CloseFull Screen / Esc
Print Version Interactive Discussion
© EGU 2004
Table 4), while NO2is more abundant in the extratropics.
Figure 10e shows that the burden of PAN can be doubled versus the NoLtNOx run in the tropical UT by assuming the PICK vertical distribution. For every 5 Tg(N)/yr of NOxfrom lightning, PAN is enhanced by almost 52% between the NoLtNOxand PICK5 runs, or about 14% more than NOx (Table 3). Then, for every additional 5 Tg(N)/yr,
5
PAN is enhanced by 17% between the PICK10 and 20 runs, or about half the increase in NOxfor the same range; thus, the tendency towards saturation is much stronger for PAN than for other trace gases. The strong response at the lower end of the LtNOx production range in the tropics can be accounted for by the very strong emissions of isoprene in MATCH-MPIC runs in the tropics (von Kuhlmann et al., 2004). The
10
formation of PAN depends, among other factors, on the availability of the peroxyacetyl radical, the dominant producer of which in our runs in the tropical regions is isoprene. As LtNOx is further increased, however, one moves into a hydrocarbon-limited PAN formation regime. While NOx is increased through LtNOx, isoprene emissions, and other PAN precursors are kept constant in our runs, leading to the rapid saturation
15
signal.
6. Comparisons with observations
In this section we compare the model output from the sensitivity runs with the com-posites of airborne field campaign observations ofEmmons et al.(2000). Table 5 and Fig. 11 show the selected set of observation campaign regions for comparison with our
20
model results. Six regions were selected for their location within the tropics, which are representative of both maritime (regions 2, 8 and 9 in Fig. 11), continental (regions 1 and 4) as well as coastal areas (region 3). Regions 2 and 3 are of particular impor-tance since they are located downwind of NOx sources such as LtNOx and biomass burning from the African continent. Four regions were selected in the extratropics, of
25
which two in coastal areas (region 5 and 10), and two in continental areas (region 6 and 7). It bears keeping in mind that the years of the campaigns generally do not
co-ACPD
4, 6239–6281, 2004 Effects of lightning-NOxon tropospheric chemistry L. Labrador et al. Title Page Abstract Introduction Conclusions References Tables Figures J I J I Back CloseFull Screen / Esc
Print Version Interactive Discussion
© EGU 2004
incide with the year of our simulation; this introduces a further element of uncertainty which may need to be assessed in the future in the light of interannual variability of lightning. Figure 12 shows the vertical profiles of NOx for the measurements of each campaign region plotted (box-whiskers plots) as well as those of the model output for the NoLtNOx, EVEN5, PICK5 and PICK20 runs for the selected regions.
5
In all but one case, the PICK20 run overestimates the observed NOxprofiles, partic-ularly over the tropical sites. In the case of regions 3 and 4, the modeled concentrations can be up to a factor of 3 higher than those of the observations at the higher altitudes. While the trend is not as strong over the tropical marine sites (regions 8 and 9), it is still evident. Over the midlatitudes, where measurements were available (region 10),
10
the same tendency is again observed, with the PICK20 modeled concentrations about 50% higher than observed ones. Although more observations are needed, our results give a strong indication that the 20 Tg(N)/yr production of NOxfrom lightning is too high a source magnitude.
Other than with for PICK20 run, it is difficult to discern any particular trend of
over-15
or underestimation of the model results, even when dividing the comparison between tropics and extratropics. Over the tropical continental landmasses, there is generally good agreement between modeled results and observations in the first 4 km for all 4 areas (regions 1, 3, 4 and 5) considered. However, there is also little difference be-tween the different model profiles up to that height, which underscores the fact that
20
the largest differences in NOx mixing ratios are found in the UT (see Fig. 2a). The runs start to exhibit larger differences among them above about 4 km. In region 4, the PICK20 run shows a clear tendency to overestimate above ∼3 km as do, to a much lesser extent, the two runs with 5 Tg(N)/yr production rate. In South Africa (region 1), the model results tend to underestimate NOxin the LT, probably as result of
underesti-25
mated biomass-burning emissions in the model, but there is a slightly better agreement in the free and upper troposphere. The overall low mixing ratios in the UT for both mea-surements and model results indicate low lightning activity over the campaign region at that time. Even then, the PICK20 run clearly overestimates NOx in the UT. NOx
mea-ACPD
4, 6239–6281, 2004 Effects of lightning-NOxon tropospheric chemistry L. Labrador et al. Title Page Abstract Introduction Conclusions References Tables Figures J I J I Back CloseFull Screen / Esc
Print Version Interactive Discussion
© EGU 2004
surement above Natal, Brazil (region 3) were only made for the first 5 km and, up to that height, the PICK5 run shows the best agreement with the observations. Over the two maritime regions in the tropical Pacific Ocean (regions 8 and 9), all 4 runs plotted tend to clearly overestimate NOx mixing ratios in the first 4–6 km, probably as a result of excessive downward transport of NOx-rich air into the lower reaches of the marine
5
troposphere on the part of the model. Above that, there is a better agreement between the runs and the measurements, with the exception of PICK20 run clearly being on the higher end (when not outside) of the measured values. However, since in the UT the range of measured values is wide and includes the values for most of the model runs, is it not possible to single out any run as having the best agreement. Region
10
2, in the tropical south Atlantic, shows a much clearer separation of the profiles for the different runs. Since one would not expect much lightning activity there, this is an indication of transport of NOx-rich air form the African continent and underscores the importance of long-range transport of trace gases. In the lowermost troposphere and up to 4 km, most runs overestimate measured values, a probable result of excessive
15
PAN in the model as diagnosed before (von Kuhlmann et al.,2003b). The NoLtNOx run clearly underestimates the measured values in the UT and, while the EVEN5 and PICK20 runs are still within the observed range there, it is the PICK5 run that more closely reproduces observed values. In the middle troposphere, between 4 and 8 km, most runs tend to underestimate measured values.
20
Over the extratropical continental areas (regions 6 and 7), measurements were not carried out above 6 km, where the simulated values start to spread. Over region 6, all runs overestimate NOx in the first 2 km, as does the PICK20 run for the entire al-titude range. The rest of the runs show a better agreement in the free troposphere but, again, no particular run shows better agreement with measured values than the
25
rest. The NOx profile over Japan (region 10) shows most runs overestimating NOx, particularly in the lower and middle troposphere. All 4 runs show very little differences among them at that height, which indicated low flash activity over the region and might point towards other sources than LtNOx, such as excessive PAN decomposition (von
ACPD
4, 6239–6281, 2004 Effects of lightning-NOxon tropospheric chemistry L. Labrador et al. Title Page Abstract Introduction Conclusions References Tables Figures J I J I Back CloseFull Screen / Esc
Print Version Interactive Discussion
© EGU 2004
Kuhlmann et al.,2003b), that could be responsible for the disagreement. The coastal area of Brazil (region 5) shows a clearer separation between all modeled NOx profiles above 4 km, indicating strong lightning activity. Above that height, all 4 runs overesti-mate NOxup until 10 km height, when measurements and modeled results (except the PICK20 run) agree again.Pickering et al.(1996) points out that convection was
unusu-5
ally active during the TRACE A campaign in Brazil. The fact that all but the NoLtNOx run overestimate NOx in that region suggest that the lightning production in our model may be biased high there. This could be a further indication of PR92’s tendency to overestimate lightning over the tropical continents.
Figure 13 show the total NOx scatterplots for 3 runs in this study, namely the
10
NoLtNOx, PICK5 and PICK20 runs for data above 5 km. The plots are done for the en-tire set of airborne observation campaigns in theEmmons et al.(2000) dataset where NOxmeasurements were available. The 5 km lower limit was chosen because, as seen from the vertical profile plots, it is where the values for the different runs generally start to separate. The NoLtNOx run shows a distinct trend to underestimate observed
val-15
ues throughout the entire concentration range, but particularly in the upper range. The PICK5 shows the best fit of all runs, both burden- and distribution wise, although the EVEN5 run (not pictured) resulted in a very similar correlation coefficient (r2=0.4655) and a lower slope (0.65866). It is interesting to notice that, in spite of these two runs having markedly different NOx vertical distributions, the difference in the scatter plots
20
is small. We believe this to be due to the lack of observation at key locations where the largest differences could be expected. On the other hand, the PICK20 run shows a clear tendency to overestimate the observations data throughout the entire range, par-ticularly at the upper end, confirming the tendency already seen in the vertical profile plots.
25
The effects of the vertical distribution and source magnitude of LtNOxhave been ad-dressed before in a number of modeling studies. Tie et al. (2001) andStockwell et al.
(1999) point out that including lightning-NOx emissions in their models produces bet-ter agreement with observations. In another study, Tie et al.(2002) conclude, based
ACPD
4, 6239–6281, 2004 Effects of lightning-NOxon tropospheric chemistry L. Labrador et al. Title Page Abstract Introduction Conclusions References Tables Figures J I J I Back CloseFull Screen / Esc
Print Version Interactive Discussion
© EGU 2004
on vertical profile plots, that simulations with a production of 7 Tg(N)/yr of NOx from lightning uniformly distributed in clouds, and 3.5 Tg(N)/yr in the upper regions of clouds produce the best agreement with observations. The differences between our modeled results and the latter study are notable. While there may be many factors to account for this, including the use of different models, we believe that the use of the Hack
5
(1994) convection scheme in Tie et al.(2002) is fundamental in accounting for these differences since it is unable to simulate deep convective mixing well. From our re-sults, it is apparent that it is not possible, based on vertical profiles alone, to arrive at a solid conclusion as to which run yields the best agreement with observations, and while the scatter plots afford an extra measure of objectivity to our analysis, we can
10
only state with a certain degree of confidence that in our simulations the NoLtNOxand PICK20 runs underestimate and overestimate, respectively, the observations enough not to be considered as realistic assumptions. We believe that the combination of the low availability of observational data, particularly in critical areas, such as the con-tinental tropics (see Fig. 8), the large scatter in the available observations and the
15
many uncertainties in modeling lightning NOx and other NOx sources calls for exercis-ing caution when comexercis-ing to conclusions about its source magnitude based on simple comparisons with observations. More observations campaigns, such as TROCCINOX (http://www.pa.op.dlr.de/troccinox), specifically aimed at reducing the uncertainties in the source of NOx from lightning and in key regions, such as the tropical continents,
20
are therefore needed.
7. Conclusions
We have investigated the effects of different assumptions concerning the source mag-nitude and vertical placement of lightning-produced NOxon total NOxas well as on O3, OH, HNO3 and PAN using the chemical transport model MATCH-MPIC. Our results
25
show these trace gases to be very sensitive to both parameters. Global increases in NOxin the tropics compared to a run with no NOx from lightning are simulated
assum-ACPD
4, 6239–6281, 2004 Effects of lightning-NOxon tropospheric chemistry L. Labrador et al. Title Page Abstract Introduction Conclusions References Tables Figures J I J I Back CloseFull Screen / Esc
Print Version Interactive Discussion
© EGU 2004
ing a 5 Tg(N)/yr LtNOxproduction rate and a vertical distribution according toPickering
et al. (1998). Since these enhancements occur primarily in the tropical upper tropo-sphere, the produced NOx, along with all other trace gases resulting from its chemistry, have the potential to be transported over long distances to pristine areas, greatly en-hancing concentrations in those places. However, under the present circumstances,
5
we believe that the uncertainties in our knowledge of the production of NOxfrom light-ning, such as 1) the horizontal distribution of lightlight-ning, which we address in a separate study, 2) the energy produced by each type of discharge and number of NO molecules per unit energy, along with 3) the low number of observation campaigns available, make it extremely difficult to determine a “best” vertical distribution and source
magni-10
tude. We can say, however, that our results points towards a 0 Tg(N)/yr of NOx from lightning as being too low and 20 Tg(N)/yr as being too high a production rate. This underscores the need for further measurement campaigns, particularly in the tropical continental regions, where lightning activity is prevalent, as well for improved lightning parameterizations for use in 3-D global chemistry transport models.
15
References
Allen, D. and Pickering, K.: Evaluation of lightning flash rate parameterizations for use in a global chemical transport model, J. Geophys. Res., 107, 4711, doi:10.1029/2002JD002066, 2002. 6244
Chameides, W., Stedman, D., Dickerson, R., Rusch, D., and Cicerone, R.: NOx production in
20
lightning, J. Atmos. Sci., 34, 143–149, 1977. 6264
Chameides, W. L.: Production of CO, H2, and other trace gases by atmospheric lightning, Transactions, American Geophysical Union, 59, 1150–1150, 1979. 6264
Chameides, W. L., Davis, D. D., Bradshaw, J., Rodgers, M., Sandholm, S., and Bai, D. B.: An estimate of the NOxproduction-rate in electrified clouds based on NO observation from the
25
GTEs CITE-1 fall 1983 field operation, J. Geophys. Res., 92, 2153–2156, 1987. 6264
Christian, H. J., Blakeslee, R. J., Boccippio, D. J., Boeck, W. L., Buechler, D. E., Driscoll, K. T., Goodman, S. J., Hall, J. M., Koshak, W. J., Mach, D. M., and Stewart, M. F.: Global frequency
ACPD
4, 6239–6281, 2004 Effects of lightning-NOxon tropospheric chemistry L. Labrador et al. Title Page Abstract Introduction Conclusions References Tables Figures J I J I Back CloseFull Screen / Esc
Print Version Interactive Discussion
© EGU 2004
and distribution of lightning as observed from space by the optical transient detector, J. Geophys. Res., 108, 4005, doi:10.1029/2002JD002347, 2003. 6241,6247,6253,6264
Dawson, G. A.: Nitrogen-fixation by lightning, J. Atmos. Sci., 37, 174–178, 1980. 6264
Drapcho, D. L., Sisterson, D., and Kumar, R.: Nitrogen-fixation by lightning activity in a thun-derstorm, J. Geophys. Res., 19, 729–734, 1983. 6264
5
Emmons, L. K., Hauglustaine, D. A., M ¨uller, J.-F., Carroll, M. A., Brasseur, G. P., Brunner, D., Staehelin, J., Thouret, V., and Marenco, A.: Data composites of airborne observations of tropospheric ozone and its precursors, J. Geophys. Res., 105, 20 497–20 538, 2000. 6254,
6257
Fehr, T., Holler, H., and Huntrieser, H.: Model study on production and transport of
10
lightning-produced NOx in a EULINOX supercell storm, J. Geophys. Res., 109, D09102, doi:10.1029/2003JD003935, 2004. 6264
Franzblau, E. and Popp, C. J.: Nitrogen-oxides produced from lightning, J. Geophys. Res., 94, 11 089–11 104, 1989. 6264
Goldenbaum, G. C. and Dickerson, R. R.: Nitric-oxide production by lightning discharges, J.
15
Geophys. Res., 98, 18 333–18 338, 1993. 6244
Hack, J. J.: Parameterization of moist convection in the National Center for Atmospheric Re-search community climate model (CCM2), J. Geophys. Res., 99, 5551–5568, 1994. 6242,
6258
Hill, R. D., Rinker, R. G., and Wilson, H. D.: Atmospheric nitrogen-fixation by lightning, J. Atmos.
20
Sci., 37, 179–192, 1980. 6264
Huntrieser, H., Feigl, C., Schlager, H., Schr ¨oder, F., Gerbig, C., van Velthoven, P., Flatøy, F., Thery, C., Petzold, A., Holler, H., and Schumann, U.: Airborne measurements of NOx, tracer species, and small particles during the european lightning nitrogen oxides experiment, J. Geophys. Res., 107, 4113 doi:10.1029/2000JD000209, 2002. 6264
25
Kowalczyk, M. and Bauer, E.: Lightning as a source of NOx in the troposphere, FAA Technical Report, Federal Aviation Admisnistration, Department of Transportation, Inst. for Defense Anal., Alexandria, VA, 76, 1982. 6244,6264
Kumar, P. P., Manohar, G. K., and Kandalgaonkar, S. S.: Global distribution of nitric-oxide produced by lightning and its seasonal-variation, J. Geophys. Res., 100, 11 203–11 208,
30
1995. 6264
Labrador, L., von Kuhlmann, R., and Lawrence, M. G.: Strong sensitivity of the global mean OH concentration and the troposphere’s oxidizing efficiency to the source of NOxfrom lightning,
ACPD
4, 6239–6281, 2004 Effects of lightning-NOxon tropospheric chemistry L. Labrador et al. Title Page Abstract Introduction Conclusions References Tables Figures J I J I Back CloseFull Screen / Esc
Print Version Interactive Discussion
© EGU 2004
Geophys. Res. Lett., 31, L06102, doi:10.1029/2003GL019229, 2004. 6241,6250
Lawrence, M. G., Chameides, W. L., Kasibhatla, P. S., Levy II, H., and Moxim, W.: Lightning and atmospheric chemistry: The rate of atmospheric NO production, vol. I, 189–202, CRC Press, Inc., 1995. 6240,6264
Lawrence, M. G., Crutzen, P. J., Rasch, P. J., Eaton, B. E., and Mahowald, N. M.: A model for
5
studies of tropospheric photochemistry: Description, global distributions, and evaluation, J. Geophys. Res., 104, 26 245–26 277, 1999. 6243
Lawrence, M. G., J ¨ockel, P., and von Kuhlmann, R.: What does the global mean OH concen-tration tell us?, Atmos. Chem. Phys., 1, 37–49, 2001. 6253
Lawrence, M. G., Rasch, P. J., von Kuhlmann, R., Williams, J., Fischer, H., de Reus, M.,
10
Lelieveld, J., Crutzen, P. J., Schultz, M., Stier, P., Huntrieser, H., Heland, J., Stohl, A., Forster, C., Elbern, H., Jakobs, H., and Dickerson, R. R.: Global chemical weather forecasts for field campaign planning: predictions and observations of large-scale features during MINOS, CONTRACE, and INDOEX, Atmos. Chem. Phys., 3, 267–289, 2003a. 6243
Lawrence, M. G., von Kuhlmann, R., and Salzmann, M.: The balance of effects
15
of deep convective mixing on tropospheric ozone, Geophys. Res. Lett., 30, 1940, doi:10.1029/2003GL017644, 2003b. 6248
Levine, J. S., Rogowski, R. S., Gregory, G. L., Howell, W. E., and Fishman, J.: Simultane-ous measurements of NOx, NO and O3 production in a laboratory discharge: atmospheric implications, Geophys. Res. Lett., 8, 357–360, 1981. 6264
20
Levy, H., Moxim, W. J., and Kasibhatla, P. S.: A global three-dimensional time-dependent light-ning source of tropospheric NOx, J. Geophys. Res., 101, 22 911–22 922, 1996. 6264
Liaw, Y. P., Sisterson, D. L., and Miller, N. L.: Comparison of field, laboratory, and theoretical estimates of global nitrogen-fixation by lightning, J. Geophys. Res., 22, 22 489–22 494, 1990.
6264
25
Navarro-Gonzales, R., Villagran-Muniz, M., Molina, L., and Molina, M.: The physical mecha-nism of nitric oxide formation in simulated lightning, Geophys. Res. Lett., 28, 3867–3870, 2001. 6264
Nesbitt, S. W., Zhang, R., and Orville, R. E.: Seasonal and global NOx production by lightning estimated from the optical transient detector (OTD), Tellus, 52B, 1206–1215, 2000. 6264
30
Noxon, J. F.: Atmospheric nitrogen-fixation by lightning atmospheric nitrogen-fixation by light-ning, Geophys. Res. Lett., 3, 463–465, 1976. 6264
ACPD
4, 6239–6281, 2004 Effects of lightning-NOxon tropospheric chemistry L. Labrador et al. Title Page Abstract Introduction Conclusions References Tables Figures J I J I Back CloseFull Screen / Esc
Print Version Interactive Discussion
© EGU 2004
atmosphere and condensation nuclei resulting from gaseous-phase reactions, Atmos. Envi-ron., 6, 959–968, 1982. 6264
Pickering, K. E., Thompson, A. M., Wang, Y., Tao, W.-K., McNamara, E. P., Kichhoff, V. W. J. J., Heikes, B. G., Sachse, G. W., Bradshaw, J. D., Gregory, G. L., and Blake, D. R.: Convective transport of biomass burning emissions over Brazil during TRACE A, J. Geophys. Res., 101,
5
23 993–24 012, 1996. 6257
Pickering, K. E., Wang, Y., Tao, W. K., Price, C., and M ¨uller, J.-F.: Vertical distributions of lightning NOx for use in regional and global chemical transport models, J. Geophys. Res., 103, 31 203–31 216, 1998. 6240,6244,6245,6259
Price, C. and Rind, D.: A simple lightning parameterization for calculating global lightning
dis-10
tributions, J. Geophys. Res., 97, 9919–9933, 1992. 6243
Price, C. and Rind, D.: Modeling global lightning distribution in a general circulation model, Mon. Weather Rev., 122, 1930–1939, 1994. 6244
Price, C., Penner, J., and Prather, M.: NOx from lightning: 1. global distribution based on lightning physics, J. Geophys. Res., 102, 5929–5941, 1997a. 6240,6264
15
Price, C., Penner, J., and Prather, M.: NOxfrom lightning: 2. constraints from the global
atmo-spheric electric circuit, J. Geophys. Res., 102, 5942–5951, 1997b. 6264
Rasch, P. J., Mahowald, N. M., and Eaton, B. E.: Representations of transport, convection and the hydrologic cycle in chemical transport models: Implications for the modeling of short lived and soluble species, J. Geophys. Res., 102, 28 127–28 138, 1997. 6243
20
Ridley, B. A., Dye, J. E., Walega, J. G., Zheng, J., Grahek, F. E., and Rison, W.: On the production of active nitrogen by thunderstorms over New Mexico, J. Geophys. Res., 101, 20 985–21 005, 1996. 6264
Sisterson, D. L. and Liaw, Y. P.: An evaluation of lightning and corona discharge on thunder-storm air and precipitation chemistry, J. Atmos. Chem., 10, 83–96, 1990. 6264
25
Stockwell, D. Z., Giannakopoulos, C., Plantevin, P. H., Carver, G. D., Chipperfield, M. P., Law, K. S., Pyle, J. A., Shallcross, D. E., and Wang, K.-Y.: Modelling NOx from lightning and its impact on global chemical fields, Atmos. Environ., 33, 4477–4493, 1999. 6247,6248,6257
Tie, X., Brasseur, G., Emmons, L., Horowitz, L., and Kinnison, D.: Effects of aerosols on tropospheric oxidants: A global model study, J. Geophys. Res., 106, 22 931–22 964, 2001.
30
6257
Tie, X., Zhang, R., Brassuer, G., and Lei, W.: Global NOx production by lightning, J. Atmos. Chem., 43, 61–74, 2002. 6257,6258
ACPD
4, 6239–6281, 2004 Effects of lightning-NOxon tropospheric chemistry L. Labrador et al. Title Page Abstract Introduction Conclusions References Tables Figures J I J I Back CloseFull Screen / Esc
Print Version Interactive Discussion
© EGU 2004
Tuck, A. F.: Production of nitrogen-oxides by lightning discharges, Q. J. R. Meteorol. Soc., 102, 749–755, 1976. 6264
Turman, B. N.: Analysis of lightning data from dmsp satellite, J. Geophys. Res., 83, 5019–5024, 1978. 6244
von Kuhlmann, R., Lawrence, M. G., Crutzen, P. J., and Rasch, P. J.: A model for studies of
5
tropospheric ozone and nonmethane hydrocarbons: Model description and ozone results, J. Geophys. Res., 108, 4294, doi:10.1029/2002JD002893, 2003a. 6242,6243
von Kuhlmann, R., Lawrence, M. G., Crutzen, P. J., and Rasch, P. J.: A model for studies of tropospheric ozone and non-methane hydrocarbons: Model evaluation of ozone related species, J. Geophys. Res., 108, 4729, doi:10.1019/2002JD003348, 2003b. 6256
10
von Kuhlmann, R., Lawrence, M. G., P ¨oschl, U., and Crutzen, P. J.: Sensitivities in global scale modeling of isoprene, Atmos. Chem. Phys., 4, 1–17, 2004. 6254
von Liebig, J.: Extrait d’une note sur la nitrification, Ann. Chem. Phys., 35, 329–333, 1827.
6241
Wang, Y., DeSilva, A. W., Goldenbaum, G. C., and Dickerson, R. R.: Nitric oxide production by
15
simulated lightning: Dependence on current, energy, and pressure, J. Geophys. Res., 103, 19 149–19 159, 1998. 6264
Zhang, G. J. and McFarlane, N. A.: Sensitivity of climate simulations to the parameterization of cumulus convection in the canadian climate centre general circulation model, Atmos. Ocean, 33, 407–446, 1995. 6242
20
Zhang, X. J., Helsdon Jr., J. H., and Farley, R. D.: Numerical modeling of lightning-produced NOx using and explicit lightning scheme: 1. three-dimensional simulation and expanded chemistry, J. Geophys. Res., 108, 4580, doi:10.10.1029/2002JD003225, 2003. 6245
ACPD
4, 6239–6281, 2004 Effects of lightning-NOxon tropospheric chemistry L. Labrador et al. Title Page Abstract Introduction Conclusions References Tables Figures J I J I Back CloseFull Screen / Esc
Print Version Interactive Discussion
© EGU 2004 Table 1. Global estimates of lightning-produced NOx (values prior to 1995 adopted from
Lawrence et al.(1995)).
REFERENCE Molec.(NO)/unit energy Molec.(NO)/flash Number of flashes LtNOxproduction rate
(type of estimate) (×1016molec./J) (×1025molec./flash) (flashes/s) (Tg(N)/yr)
Tuck(1976)a – 1.1 500 4 Chameides et al.(1977)a 3–7 6–14 400 18–41 Noxon(1976)c – 10 500 37 Chameides(1979)a 8–17 16–34 400 47–100 Dawson(1980)a – 0.8 500 3 Hill et al.(1980)a – 1.2 100 0.9 Levine et al.(1981)b 5±2 0.5 500 1.8±0.7
Kowalczyk and Bauer(1982)a – 10 500 5.7
Peyrous and Lapyere(1982)b 1.6 3.2 400 9.4
Drapcho et al.(1983)c – 40 100 30
Chameides et al.(1987)d – – – 7
Franzblau and Popp(1989)c – 300 100 220
Sisterson and Liaw(1990)a – 8.2 200 12
Liaw et al.(1990)e – – – 81
Lawrence et al.(1995)e – 2.3(1–7) 100(70–150) 2(1–8)
Kumar et al.(1995)c – 0.5 100 2
Ridley et al.(1996)c – – 100 2–5
Levy et al.(1996)a – – – 2–6
Price et al.(1997a)c 10 – 70–100 12.2(5–20)
Price et al.(1997b)a 10 – – 13.2(5–25)
Wang et al.(1998)b – 3.1 30–100 2.5–8.3
Nesbitt et al.(2000)c – 0.87–6.2 57 0.9
Navarro-Gonzales et al.(2001)b 15±5 – – –
Huntrieser et al.(2002)c – 2.7×10²¹molec/m flash – 3
Christian et al.(2003)c – – 44±5 – Fehr et al.(2004)c – 21 – – a Theoretical estimate b Laboratory-based estimate cField observations-based estimate d
Thunderstorm extrapolation-based estimate e
ACPD
4, 6239–6281, 2004 Effects of lightning-NOxon tropospheric chemistry L. Labrador et al. Title Page Abstract Introduction Conclusions References Tables Figures J I J I Back CloseFull Screen / Esc
Print Version Interactive Discussion
© EGU 2004 Table 2. MATCH-MPIC runs done for this study.
RUN LtNOxproduction Vertical distribution (Tg(N)/yr)
NoLtNOx 0 Density-weighteda EVEN2 2 Density-weighteda EVEN5 5 Density-weighteda EVEN10 10 Density-weighteda PICK2 2 Pickering et al. (1998) PICK5 5 Pickering et al. (1998) PICK10 10 Pickering et al. (1998) PICK20 20 Pickering et al. (1998)
ANVIL2 2 Five uppermost layers of cloud ANVIL5 5 Five uppermost layers of cloud
a
ACPD
4, 6239–6281, 2004 Effects of lightning-NOxon tropospheric chemistry L. Labrador et al. Title Page Abstract Introduction Conclusions References Tables Figures J I J I Back CloseFull Screen / Esc
Print Version Interactive Discussion
© EGU 2004 Table 3. Burdens of the NoLtNOx runs (in Tg for NOx and O3 and ×106 molec for OH) and
relative increases (in percent) of the burdens of the different trace gases for the whole globe and tropics (T) for the different runs with respect to the LtNOxruns.
Trace Burden in Relative increase vs. NoLtNOxrun gas NoLtNOxrun P2 P5 P10 P20 E2 E5 E10 NOx 0.14 9.1 19.5 31.9 51.2 6.4 14.4 24.9 NOx(T) 0.05 16.6 36.4 60.6 98.2 11.9 27.3 47.8 Ozone 377.1 6.8 14.1 21.8 30.7 4.9 10.6 17.6 Ozone (T) 138.5 9.9 20.8 32.3 45.6 7.1 15.7 26.2 OH 0.17 13.2 27.8 43.1 61.3 9.6 21.1 35.1 OH (T) 0.09 16.4 34.8 54.8 78.4 11.9 26.5 44.6 HNO3 0.15 14.2 35.6 69.6 135.2 11.6 29.1 59.8 HNO3(T) 0.07 21.4 54.7 109.6 217 17.6 44.7 90.7 PAN 0.37 14.2 28.9 43.2 57.4 9.7 21.3 34.9 PAN (T) 0.13 8.1 51.7 24.8 33.2 5.5 12.0 19.8
ACPD
4, 6239–6281, 2004 Effects of lightning-NOxon tropospheric chemistry L. Labrador et al. Title Page Abstract Introduction Conclusions References Tables Figures J I J I Back CloseFull Screen / Esc
Print Version Interactive Discussion
© EGU 2004 Table 4. Regional annual mean airmass-weighted OH concentrations (×106molec/cm3) and
relative increases vs. NoLtNOx(in parenthesis) for the different LtNOxvertical distributions.
REGION NoLtNOx EVEN5 PICK5
Below 750 hPa 90◦S–30◦S 0.54 0.58 (+7.4%) 0.59 (+9.3%) Below 750 hPa 30◦S–0◦ 1.25 1.45 (+16%) 1.43 (+14.4%) Below 750 hPa 0◦–30◦N 1.44 1.59 (+10.4%) 1.56 (+8.3%) Below 750 hPa 30◦N–90◦N 0.82 0.85 (+3.7%) 0.85 (+3.7%) 750–500 hPa 90◦S–30◦S 0.48 0.55 (+14.6%) 0.56 (+17%) 750–500 hPa 30◦S–0◦ 1.21 1.53 (+26.4%) 1.56 (+28.9%) 750–500 hPa 0◦–30◦N 1.44 1.71 (+18.8%) 1.72 (+19.4%) 750–500 hPa 30◦N–90◦N 0.72 0.77 (+6.9%) 0.77 (+6.9%) 500–250 hPa 90◦S–30◦S 0.34 0.40 (+17.6%) 0.42 (+23.5%) 500–250 hPa 30◦S–0◦ 0.67 0.93 (+38.8%) 1.07 (+59.7%) 500–250 hPa 0◦–30◦N 0.87 1.13 (+29.9%) 1.27 (+46%) 500–250 hPa 30◦N–90◦N 0.52 0.57 (+9.6%) 0.58 (+11.5%)