HAL Id: hal-00295378
https://hal.archives-ouvertes.fr/hal-00295378
Submitted on 16 Dec 2003
HAL is a multi-disciplinary open access
archive for the deposit and dissemination of
sci-entific research documents, whether they are
pub-lished or not. The documents may come from
teaching and research institutions in France or
abroad, or from public or private research centers.
L’archive ouverte pluridisciplinaire HAL, est
destinée au dépôt et à la diffusion de documents
scientifiques de niveau recherche, publiés ou non,
émanant des établissements d’enseignement et de
recherche français ou étrangers, des laboratoires
publics ou privés.
Weekly cycle of NO2 by GOME measurements: a
signature of anthropogenic sources
S. Beirle, U. Platt, M. Wenig, T. Wagner
To cite this version:
S. Beirle, U. Platt, M. Wenig, T. Wagner. Weekly cycle of NO2 by GOME measurements: a signature
of anthropogenic sources. Atmospheric Chemistry and Physics, European Geosciences Union, 2003, 3
(6), pp.2225-2232. �hal-00295378�
www.atmos-chem-phys.org/acp/3/2225/
Chemistry
and Physics
Weekly cycle of NO
2
by GOME measurements: a signature of
anthropogenic sources
S. Beirle1, U. Platt1, M. Wenig2, and T. Wagner1
1Institut f¨ur Umweltphysik, Universit¨at Heidelberg, Germany 2NASA Goddard Space Flight Center, Greenbelt, MD 20771, USA
Received: 23 May 2003 – Published in Atmos. Chem. Phys. Discuss.: 3 July 2003
Revised: 15 October 2003 – Accepted: 26 November 2003 – Published: 16 December 2003
Abstract. Nitrogen oxides (NO+NO2=NOx and reservoir species) are important trace gases in the troposphere with impact on human health, atmospheric chemistry and cli-mate. Besides natural sources (lightning, soil emissions) and biomass burning, fossil fuel combustion is estimated to be responsible for about 50% of the total production of NOx. Since human activity in industrialized countries largely fol-lows a seven-day cycle, fossil fuel combustion is expected to be reduced during weekends. This ”weekend effect” is well known from local, ground based measurements, but has never been analysed on a global scale before.
The Global Ozone Monitoring Experiment (GOME) on board the ESA-satellite ERS-2 allows measurements of NO2 column densities. By estimating and subtracting the strato-spheric column, and considering radiative transfer, vertical column densities (VCD) of tropospheric NO2can be deter-mined (e.g. Leue et al., 2001). We demonstrate the statistical analysis of weekly cycles of tropospheric NO2VCDs for dif-ferent regions of the world. In the cycles of the industrialized regions and cities in the US, Europe and Japan a clear Sun-day minimum of tropospheric NO2VCD can be seen. Sun-day NO2VCDs are about 25–50% lower than working day levels. Metropolitan areas with other religious and cultural backgrounds (Jerusalem, Mecca) show different weekly pat-terns corresponding to different days of rest. In China, no weekly pattern can be found.
The presence of a weekly cycle in the measured tropo-spheric NO2VCD may help to identify the different anthro-pogenic source categories. Furthermore, we estimated the lifetime of tropospheric NO2by analysing the mean weekly cycle exemplarily over Germany, obtaining a value of about 6 h in summer and 18–24 h in winter.
Correspondence to: S. Beirle
(beirle@iup.uni-heidelberg.de)
1 Introduction
Over the last 150 years, the atmospheric composition has changed dramatically due to the industrial revolu-tion. Among the various emitted pollutants nitrogen ox-ides (NO+NO2=NOxand reservoir species) play an impor-tant role. In the troposphere they have a large impact on hu-man health, climate and atmospheric chemistry, e.g. due to the role they play in ozone production (Atkinson, 2000) and their influence on the OH concentration (“oxidizing power”, Jacob, 2003). The estimation of the strengths of the different NOxsources (industry, biomass burning, aircraft, soil emis-sions, lightning) still has high uncertainties (e.g. Lee et al., 1997). Nevertheless, NOxby fossil fuel combustion is esti-mated to account for more than 50% of the overall produc-tion.
Industrial activity and traffic in western countries are re-duced during weekends leading to lower levels of emitted pollutants (“Weekend effect”; Cleveland et al., 1974; Elkus and Wilson, 1977; Cerveny and Coakley, 2002). Compared to working day levels the weekend emissions of NOx, e.g. in Germany, are reduced by approximately 35% (Wickert, 2001). The degree of reduction of industrial activity and traf-fic may differ from country to country and even from region to region, but a Sunday minimum of NOxemissions is gen-erally expected for all countries with a Christian tradition, celebrating Sunday as the day of rest.
Satellite measurements allow a new and independent ap-proach to the determination of trace gas emissions. The entire globe is monitored with a single instrument under the same conditions and over long periods of time. The Global Ozone Monitoring Experiment GOME on board the ESA satellite ERS-2 provides data to determine vertical col-umn densities (VCDs) of NO2(Wagner, 1999; Leue et al., 2001). By subtracting the estimated stratospheric fraction, tropospheric VCDs of NO2are retrieved (Leue et al., 2001; Velders et al., 2001; Wenig et al., 2001; Martin et al., 2002).
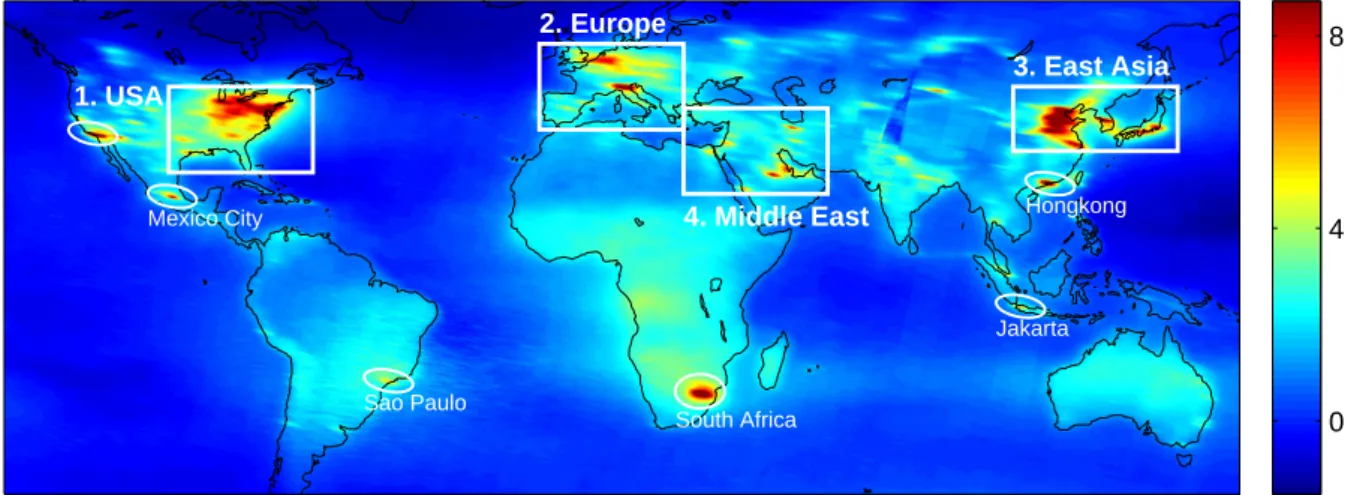
2226 S. Beirle et al.: Weekly cycle of NO2by GOME measurements 0 4 8 1. USA 2. Europe 3. East Asia 4. Middle East South Africa Sao Paulo Hongkong Jakarta Mexico City
Fig. 1. Six years mean (1996–2001) of global tropospheric NO2Vertical Column Density in 1015molecules/cm2. The weekly cycle of the framed areas 1. US East Coast, 2. Europe, 3. East Asia and 4. Middle East, as well as 5. the marked individual Metropolises are considered in detail in this study.
Since the lifetime of tropospheric NO2is of the order of one day (Leue et al., 2001), enhanced VCDs directly indicate nearby sources of NOx.
Remote sensing of the troposphere in principle is con-strained by clouds and aerosol, and quantitative correction of radiative transfer requires additional information on surface albedo and trace gas profile (e.g. Velders et al., 2001). Fur-thermore, the spatial resolution of one GOME ground pixel (320 × 40 km2) is rather coarse compared to the extent of individual cities. In spite of these uncertainties of individ-ual VCD measurements, the statistical analysis of long time series of GOME data provides reliable information, for in-stance on the mean tropospheric NO2distribution and on fea-tures of its weekly cycle.
2 Retrieval of tropospheric NO2vertical column densi-ties from GOME
In April 1995, the ERS-2 satellite was launched by the Eu-ropean Space Agency, carrying (in addition to other instru-ments) the Global Ozone Monitoring Experiment (GOME) (Burrows et al., 1999). The satellite operates at an altitude of about 780 km. It flies along a sun- synchronous polar orbit and crosses the equator at 10:30 (local time). GOME consists of four spectrometers measuring the radiation reflected by the earth in the UV/vis spectral range with a resolution of about 0.2–0.4 nm. Global coverage is achieved every three days. The primary objective of GOME is the retrieval of Ozone column densities, but beyond this the column densities of several trace gases can be determined by applying Differen-tial Optical Absorption Spectroscopy (DOAS) (Platt, 1994). The retrieval of vertical column densities (VCDs) of NO2is described in detail by Wagner (1999), Leue et al. (2001) and Wenig (2001).
Since the global distribution of stratospheric NO2is much more homogeneous and less time dependent than it is in the troposphere, it is possible to estimate the stratospheric frac-tion of the total column (Leue et al., 2001; Velders et al., 2001; Wenig, 2001). For this study, the stratospheric col-umn was determined in a reference sector over the remote Pacific (Richter and Burrows, 2002) and assumed to be inde-pendent from longitude. The resulting mean global distribu-tion of tropospheric NO2generally justifies our assumptions about stratospheric homogeneity (see Fig. 1). But in some regions, especially the North Atlantic, and mainly in winter time, we obviously overestimated the stratosphere, resulting in negative tropospheric columns. This additive bias affects our study at least in the case of Europe. Its relevance will be discussed in conjunction with our results. (A recent study of stratospheric NO2from GOME is presented by Wenig et al., 2003, discussing the longitudinal homogeneity and seasonal dependency in detail.)
The difference between the total and the estimated strato-spheric column represents the tropostrato-spheric fraction. For a quantitative analysis the tropospheric vertical column den-sity has to be corrected for effects of radiation transfer in the troposphere. The absolute value of the correction factor depends on surface albedo, trace gas profile and especially the cloud cover (Richter and Burrows, 2002; Martin et al., 2002). In this study, we apply a uniform correction factor of 4 (Velders et al., 2001) to keep the analysis as simple as possible. We focus on the relations of mean VCDs of dif-ferent days of the week, i.e. normalized weekly cycles. Any regional bias of the correction factor (e.g. due to a different profile shape) is multiplicative, thus not affecting our study.
The coverage of one GOME pixel is about 40 km north– south by 320 km east–west. This complicates the monitoring of individual cities: the total area of pixels containing a spe-cific location is 80 × 640 km2(since the city center may be
Wed Thu Fri Sat Sun Mon Tue
2. Europe
Wed Thu Fri Sat Sun Mon Tue
1. USA Eastcoas
t
Wed Thu Fri Sat Sun Mon Tue
4. Middle East
Wed Thu Fri Sat Sun Mon Tue
3. East Asia
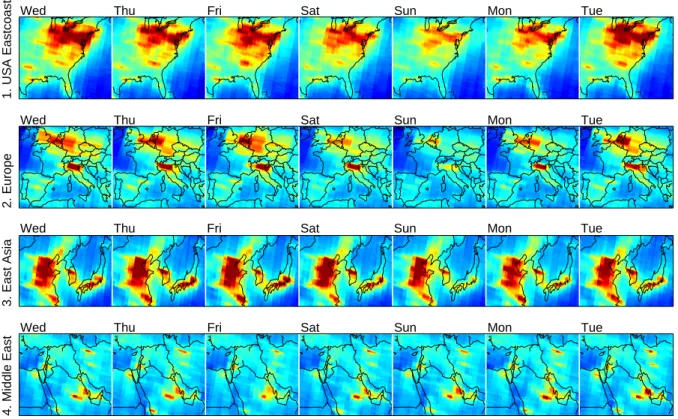
Fig. 2. Mean tropospheric NO2VCD (1996–2001) for the regions of interest, as marked in Fig. 1, for the different days of the week. Colour scale and unit are the same as in Fig. 1.
situated in the upper right corner of the GOME pixel as well as in the lower left corner), implying possible interferences with other sources.
The flight track of the ERS-2 satellite has a periodicity of 35 days. That means, that every 35 days the GOME ground pixel coordinates are identical. This circumstance may influ-ence the analysis of weekly cycles, since 35 is a multiple of 7. Hence each day of the week is scanned with a different spatial sampling. This implies that, by monitoring a certain location, the influence of neighbouring regions differs from day to day. This effect is in general of minor importance, but may cause artefacts in the weekly cycle of tropospheric NO2 VCD in a few cases (see below).
The retrieval of tropospheric information from satellite data can be strongly affected by clouds: an enhanced cloud cover might “shield” the troposphere and lead to the obser-vation of a reduced VCD. In principle, there could even be a systematic weekly cycle of cloud cover. In fact, Cerveny and Balling Jr (1998) report a weekly cycle of precipitation. To examine if there is a weekly cycle of cloud cover we use the Heidelberg Iterative Cloud Retrieval Utilities (HI-CRU), recently presented by Grzegorski (2003). HICRU contains an improved algorithm that retrieves cloud covers using the GOME Polarization Monitoring Devices (PMD), which are broadband spectrometers with a better spatial res-olution. Therefore, information on cloud cover is obtained for the same time and place as for the NO2retrieval.
By analysing the weekly cycle of the HICRU cloud cover data we found no evidence of a weekly pattern of enhanced cloud cover on Sundays. In the case of Germany, for in-stance, the mean cloud cover (1996–2001) is 0.450 on week-days and 0.457 on Sunweek-days. The weekday cloud covers (i.e. the fraction of the area covered by clouds) vary between 0.431 (Tuesday) and 0.479 (Friday); the standard deviation of the five mean weekday values is 0.018. Especially the fact that for Germany the day with the highest cloud cover shows no irregular features in the NO2 VCD gives us confidence that the influence of cloud cover on our study is negligible. We did not observe enhanced cloud cover on Sundays for the US either.
3 Weekly cycle of tropospheric NO2VCD
The GOME measurements currently span more than 7 years, providing a large amount of data for statistical evaluation. Figure 1 shows the mean global distribution of tropospheric NO2VCDs for 1996–2001. Regions with high industrial ac-tivity and even individual metropolises, e.g. Mexico City, can clearly be seen. In this study, we focus on four regions of the world with enhanced NO2VCD values: 1. the eastern USA, 2. western Central Europe, 3. East Asia and 4. the Mid-dle East, as well as 5. some individual cities, as marked in Fig. 1. Rural areas with other predominant sources of NOx
2228 S. Beirle et al.: Weekly cycle of NO2by GOME measurements
Wed Thu Fri Sat Sun Mon Tue Wed 0.5 1.0 1.5
(1) USA
New York Los Angeles Chicago Dallas DetroitWed Thu Fri Sat Sun Mon Tue Wed 0.5 1.0 1.5
(2) Europe
Milan Paris Frankfurt Essen SheffieldWed Thu Fri Sat Sun Mon Tue Wed 0.5 1.0 1.5
(3a) Japan & South Corea
Tokio Osaka Kyoto Seoul
Wed Thu Fri Sat Sun Mon Tue Wed 0.5 1.0 1.5
(3b) China
Beijing Shanghai Tianjin Jinan ShijiazhuangWed Thu Fri Sat Sun Mon Tue Wed 0.7 0.8 0.9 1.0 1.1 0.8 0.9 1.0 1.5
(4) Middle East
Jerusalem CairoRijad Mecca Dammam Abu Dhabi
Wed Thu Fri Sat Sun Mon Tue Wed 0.5 1.0 1.5
(5) Others
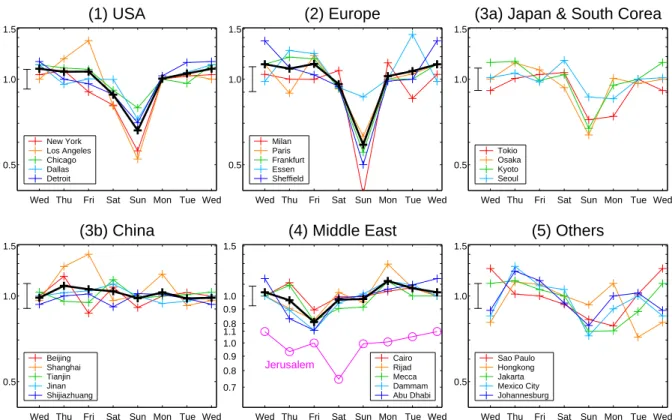
Sao Paulo Hongkong Jakarta Mexico City JohannesburgFig. 3. Weekly cycle of mean (1996–2001) tropospheric NO2VCD for the considered locations (as marked in Fig. 1). The values are normalized with respect to the median weekly value (relative units). Black lines are averaged curves. The error bar to the left of every plot indicates the maximum relative error (standard error of the mean) of all data points. The scale is logarithmic to emphasize relative features. (soil emissions, biomass burning, lightning) show no
indica-tion for a weekly NOxcycle.
The weekly cycle of tropospheric NO2VCD is visualized in two ways. Figure 2 shows maps of the tropospheric NO2 VCD for the regions under consideration for the different days of the week (mean over 1996–2001). This provides in-formation about the absolute source strength in the different regions. The effect of the 35 day periodicity of GOME is reflected by the stripe-like structures parallel to the ERS-2 flight direction.
In addition, Fig. 3 shows plots of weekly cycles for some selected cities to illustrate the relative reduction of the tropo-spheric NO2VCD during the day of rest. For each day of the week we calculated the mean (and its statistical error) of all GOME observations (1996–2001) containing the respective location. These values are normalized to the median weekly value for better comparison. (The median was chosen as ref-erence in order to avoid a bias by the Sunday minimum: The mean of all days would shift from the normal weekday level towards the lower Sunday level, and consequently, the week-days normalized to the mean would be higher than unity.) The normalisation allows to calculate relative errors. The error bar of each subplot is the maximum of all individual relative errors. We chose a logarithmic scale since we focus on relative changes in the weekly cycle. Furthermore, the length of the relative error bar is independent from the actual mean.
Both figures show the same general features: the level of NO2VCD is similar for the different working days, but there is a significant reduction of tropospheric NO2 VCD during the weekend, especially on Sunday, for the US (1), Europe (2), and Japan (3a). In all cities considered in these regions, there is a minimum on Sunday. The NO2VCD is reduced by about 25–50% and even 60% (Milan (2)). A Sunday mini-mum can also be seen in Johannesburg and Mexico City (5). In China (3b), no indications for a weekly cycle can be found in Figs. 2 or 3. China has a different economic, cul-tural, and religious background. Nevertheless, there is also a seven day week and a work free weekend. The absence of a weekend effect in our data probably indicates that the Chinese NOxemissions are dominated by power plants and heavy industry, operating throughout the week. On the other hand, in the US and in Europe individual transport appears to contribute significantly to the NOxsources.
The cities in the Middle East (4) show a shifted weekly cycle due to different religious traditions, i.e. other days of rest. In Israel, Saturday (Sabbath) is the day of lowest NO2 VCD. In Islamic cities, there is a slight weekly effect with lowest emissions on Friday.
Besides the noticeable minimum on Sunday, there are two more days of interest in the weekly cycles of the western cities: a) Saturday, since it is also a working free day for most professions in western countries (reduced industrial activ-ity), but a preferred day for shopping or short trips (possible
Weekday Sunday Summer Weekday Sunday Winter Weekday Sunday Summer Weekday Sunday Winter
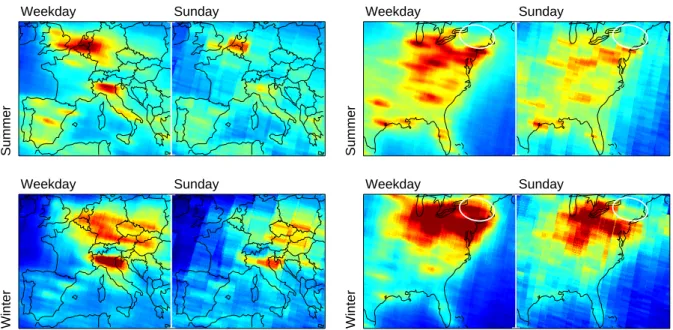
Fig. 4. Mean tropospheric NO2VCD (1996–2001) for Europe (left) and US east coast (right), separated for summer (upper row) and winter (lower row). The mean workday level is compared to the respective Sunday plot. Colour scale and unit are the same as in Fig. 1. The marked area in the northeastern US is discussed in the text.
increase of individual transport), and b) Monday, since it starts with relatively clean air, whereas for the other work-ing days the measured air masses might be influenced by the pollution of the day before, as the lifetime of NOxin the tro-posphere is about one day.
a) Saturday NO2values are slightly reduced in most western cities. But in some places they are quite high, reaching nor-mal working day levels (e.g. Milan, Dallas, Tokyo).
b) Monday values in the US and Europe are almost on work-ing day level, whereas there are uncommonly low levels in Tokyo and Seoul (3a) as well as in Sao Paulo and Jakarta (5). To understand these features in the weekly cycle in de-tail, further information about local emissions, wind speed and direction, and lifetime of NO2is necessary. Another as-pect is the daily cycle of emissions, especially the starting time of work in the morning which differs from region to region, whereas the local observation time of GOME is the same (about 10:30). A rather late start of human activity in the morning could possibly explain the Monday minimum in the weekly cycle for e.g. Sao Paulo. The fixed observa-tion time also affects the level of the Sunday minimum, since on Sundays generally emissions start later (Sunday trips or shopping (in the USA) take place mainly after the GOME overpass).
The 35 day periodicity of the ERS-2 satellite flight track should be, in general, of minor influence. However, it is thought to be the most probable reason for some unusually high values, e.g. the Tuesday values in Essen or the high Wednesday values in Sheffield (Fig. 3(2)). For instance, in the Tuesday scans, the polluted regions of West Germany
(Ruhr area) and the Netherlands are largely covered by a single track of GOME pixels, whereas there are two neigh-bouring tracks on Wednesdays (see Fig. 2(2)). This leads to a higher observed NO2 VCD on Tuesdays compared to Wednesdays. Also the relative high Sunday values in Essen seem to derive from this effect.
Additionally, we compared the weekday and Sunday lev-els of tropospheric NO2 in Europe and the USA for sum-mer and winter separately (Fig. 4). We observed a signifi-cant Sunday reduction for both regions and both seasons. In principle, a quantitative comparison of the weekly cycles for summer and winter should hold information about the role of heating (north-western Europe) or air-conditioning (USA). However, such a quantitative analysis seems to be not feasi-ble yet:
– The reduction of data (3 months per year instead of 12)
increases the statistical error by a factor of 2.
– Obviously, the stratospheric bias depends on season.
Mainly in winter we retrieved negative tropospheric columns over the Atlantic e.g. around Ireland or east of Florida (Fig. 4, lower row).
– The lifetime of NOxis higher in winter (see next chap-ter). This also influences the weekly cycle, i.e. the Sun-day minimum (in winter there is more NOxfrom Satur-day remaining).
Nevertheless, Fig. 4 reveals some new insights. For in-stance, while the Netherlands/Belgium/Germany plume van-ishes almost completely on Sundays in winter (Fig. 4, lower
2230 S. Beirle et al.: Weekly cycle of NO2by GOME measurements
Europe
Germany
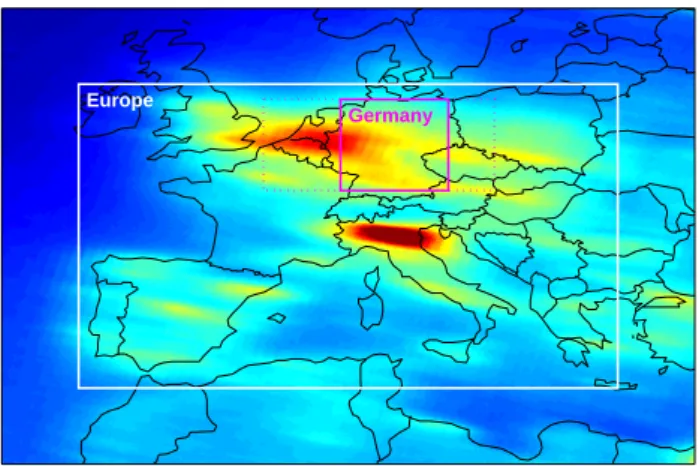
Fig. 5. Zoom of Fig. 1 on West Europe. For the lifetime estimation
of tropospheric NOx in Germany, the considered area is marked
(7◦–14◦E and 48◦–54◦N). The dotted box (2◦–17◦E) indicates an
alternative area for comparison (see text).
left panel), indicating transport as main source of NOx, the VCD over Austria/Hungary/Czechia/Slovakia/Poland almost stays the same. This indicates that the predominant source of NOx has no weekly cycle, i.e. is very probably heat-ing. (Buildings in Eastern Europe are worse isolated, which leads to higher energy consumption for heating, Bayer et al., 2002).
Another quite astonishing result is the north-eastern region of the US between Lake Ontario and Boston (Fig. 4, marked ellipse, right panels): While this region is quite clean in sum-mer (on weekdays as well as on Sundays), it is highly pol-luted on winter workdays, but much less on Sundays. This indicates a weekly cycle in NOx — either due to source, visibility to GOME, or sink — not existing in summer. At present we do not understand this feature.
4 Lifetime estimation
The average lifetime of NOxin the boundary layer depends on many factors like meteorological conditions, photolysis, length of night, temperature, OH and H2O concentrations. It is of the order of one day, but varies by about one order of magnitude with time and place. Estimates of the mean lifetime for a given location and season reflect typical condi-tions. Furthermore, they are needed to relate NOxemissions quantitatively to GOME VCDs. We use the weekly cycle to estimate mean lifetimes of NOx in summer and winter for Germany exemplarily.
The principal sink of NOx is oxidation to HNO3 that is removed by wet or dry deposition in the troposphere (e.g. Jacob, 2003). During daytime, the conversion takes place by NO2 directly reacting with OH radicals. At night, NO3 is formed (by reactions of NO2with ozone), that itself re-acts with NO2to N2O5. This product finally reacts hetero-geneously with H2O to HNO3(Geyer and Platt 2002). For
a mid-latitude located country like Germany, the removal in summer takes place by both mechanisms, while in winter it occurs almost solely by the second path due to low OH con-centrations.
For our estimation, we analysed the influence of the low Sunday emissions on the VCD measured on Monday in the area downwind from the source regions. Therefore we con-sider Germany, i.e. the area 7◦–14◦E and 48◦–54◦N (Fig. 5). Since the main sources are located in the western part of Ger-many and the mean wind direction is eastwards, the emitted pollutants should remain within the area for at least one day. (A mean wind velocity of approx. 5 m/s corresponds to a daily transport of 432 km, whereas the east-west extension of Germany is about 700 km.) We based our analysis on some simple assumptions:
1. The ratio NO2/NOxdoes not depend on the day of week. That means, the normalized weekly cycles of NOxand NO2are the same.
2. There is a constant NOxemission during daytime (12 h), while there are no emissions at night. Saturday emis-sions are 66%, Sunday emisemis-sions 60% of working day level (adopted from Wickert, 2001), see Fig. 6a. 3. The chemical loss of NOx is first order in NOx
char-acterised by a constant lifetime τ . We neglect possible changes of τ due to different VOC/Ozone concentra-tions on Sundays.
4. For the considered area, there is neither in- nor outflow of NOxdue to wind transport. By this approach we ne-glect the pollution in the Netherlands/Belgium in partic-ular, that itself is subject to a weekly cycle. The error of this simplification was estimated by extending the box size (dotted rectangle in Fig. 5).
Therefore, the change of the NO2VCD can be described as d(VCDNO2)/dt = E(t) – (VCDNO2)/τ
E(t): Emissions (in units of molecules cm−2s−1).
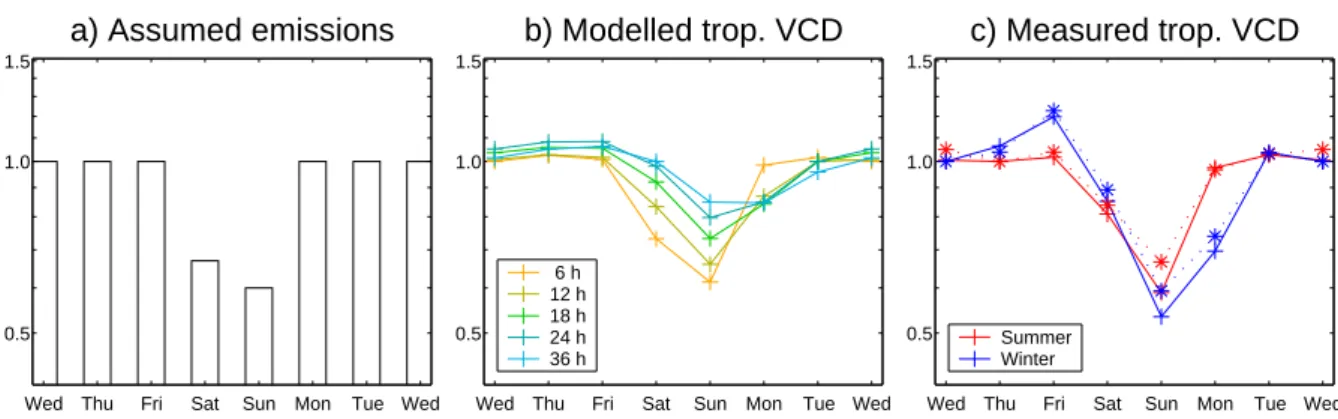
This differential equation was solved numerically. Fig-ure 6b shows the retrieved average weekly cycle of German NO2VCD at the ERS-2 overpass time for different lifetimes τ. This is compared to the actual measurements of GOME in Fig. 6c. This comparison was performed for winter and summer data separately. The dotted lines in Fig. 6c are re-lated to the extended area (dotted rectangle in Fig. 5). As can be seen, the actual weekly cycle is nearly unaffected by the extent of the considered area.
The Sunday reduction is underestimated in the modelled weekly cycle. This might indicate that the reduction of week-end emissions is actually more extensive than assumed. Be-sides, in assumption 2 (Fig. 6a) we neglected that Sunday
Wed Thu Fri Sat Sun Mon Tue Wed 0.5 1.0 1.5
c) Measured trop. VCD
Summer Winter Wed Thu Fri Sat Sun Mon Tue Wed0.5 1.0 1.5
a) Assumed emissions
Wed Thu Fri Sat Sun Mon Tue Wed 0.5 1.0 1.5
b) Modelled trop. VCD
6 h 12 h 18 h 24 h 36 hFig. 6. Weekly cycle of NO2(modelled and measured) for Germany (as shown in Fig. 5). All plots are normalized to the median weekly
value (relative units). (a) Assumed weekly cycle of NOxemissions (adopted from Wickert, 2001). (b) Modelled tropospheric VCD at ERS-2
overflight time for different lifetimes of NOx. (c) Mean tropospheric VCD of NO2measured with GOME. Dotted curves refer to the dotted
rectangle in Fig. 5.
emissions start later in the morning. Another important rea-son, especially for winter, is the overestimation of the strato-sphere for the North Atlantic region. If we add a constant offset of, for instance, 1015molec cm−2(that would compen-sate the negative values over Ireland), the Sunday minimum would be 61% instead of 53%.
In any case, the detailed temporal pattern of the weekly cycle of the modelled VCD crucially depends on the as-sumed lifetime. (Fig. 6b). The weekly cycle of the summer data (Fig. 6c) shows Monday values on the normal workday level. Therefore, the summer weekly cycle is smaller than 12 h and in good agreement with a lifetime of 6 h (a shorter lifetime would result in Saturday values lower than observed, whereas a longer lifetime would show reduced Monday val-ues). In winter, the observed Monday values are lower than the Saturday ones, indicating a lifetime of about 18–24 h (any lifetime longer than 36 h would lead to Monday values lower than Sunday values, which is not observed). Our results are quantitatively in good agreement with the GEOS-CHEM cal-culations presented by Martin et al., 2003. The lifetime of Germany NOxin summer is significantly shorter than in win-ter as expected. The winwin-ter result of 18–24 h can serve as estimate for the removal via NO3/N2O5, since OH concen-tration is quite negligible in winter.
5 Conclusions
The existence of a weekly cycle is an obvious signature of anthropogenic sources. In most western industrialised ar-eas a clear weekly cycle with a noticeable Sunday minimum can be found in tropospheric NO2VCD from GOME, adding credibility to the retrieval of tropospheric trace gas measure-ments from space. Regions with a different religious back-ground show a shifted weekly cycle with minimum NO2 VCD on Saturday (Israel) or Friday (cities with predomi-nantly Islamic population). In China, no weekly cycle of tropospheric NO2could be found.
The low level of the Sunday minimum in the western cities provides information about the fraction of periodic an-thropogenic sources of NOx. In principle, the analysis of the weekly cycle (for different seasons) could help to dis-criminate manmade from natural sources (lightning, biomass burning, soil emissions) and assess the contribution of local traffic to the NOxsources.
The characteristics of the weekly cycle, i.e. the ratio of the Monday values and Sunday minima, allow a rough estimate of the mean lifetime of boundary-layer NOx. We find a mean lifetime of 6 h (summer) and 18–24 h (winter), respectively, for Germany.
The quantitative interpretation of features of the weekly cycle requires background information about the considered regions. Weekly as well as daily patterns of emissions, the predominant source of NOx(traffic, heavy industry or heat-ing) and the lifetime of tropospheric NOxdiffer for different levels of industrialisation, religious and cultural customs and meteorological conditions.
The statistical errors of the data points in Fig. 3 are quite small due to the large amount of data. Systematical errors due to the estimation of the stratospheric column and the large spatial extent of the GOME pixels, as described in Sect. 2, have to be borne in mind. A better spatial resolution (nominal 30 × 60 km2) will be provided by the SCanning Imaging Absorption SpectroMeter for Atmospheric CHar-tographY (SCIAMACHY) onboard the ENVISAT, which is presently in its validation phase. Furthermore, due to the ad-ditional limb viewing geometry a direct estimation of the stratospheric column is possible. Time series of SCIA-MACHY data as well as ongoing GOME measurements will allow the improved analysis of weekly cycles of tropospheric NO2and will afford quantitative estimates of different types of anthropogenic emissions as well as the lifetime of tropo-spheric NO2for different regions of the world.
2232 S. Beirle et al.: Weekly cycle of NO2by GOME measurements
Acknowledgements. We like to thank the European Space Agency
(ESA) operation center in Frascati (Italy) and the “Deutsches Zen-trum f¨ur Luft- und Raumfahrt” DLR (Germany) for providing the ERS-2 satellite data. We appreciate the reviewers for many helpful comments and valuable input to our study.
References
Atkinson, R.: Atmospheric chemistry of VOCs and NOx, Atmos.
Environ., 34, 2063–2101, 2000.
Bayer, G., Wennstr¨om, N., Kisliakova, A., Umweltpolitiken, -strategien und -programme der Beitrittsl¨ander in Mittel- und Ost-europa, Bericht 2002, http://www.oekb.at/1/05/01/umwelt f210. pdf, 2002.
Burrows, J., Weber, M., Buchwitz, M., Rozanov, V., Ladstetter-Weienmayer, A., Richter, A., De Beek, R., Hoogen, R., Bram-stedt, K., Eichmann, K. U. , Eisinger, M., and Perner, D.: The Global Ozone Monitoring Experiment (GOME): Mission con-cept and first scientific results, J. Atmos. Sci., 56, 151–175, 1999. Cerveny, R. S. and Balling, R. C. Jr.: Weekly cycles of air pollu-tants, precipitation and tropical cyclones in the coastal NW At-lantic region, Nature, 394, 561–563, 1998.
Cerveny, R. S. and Coakley, K. J.: A weekly cycle in
atmospheric carbon dioxide, Geophys. Res. Lett., 29, 2, doi:10.1029/20001GL013952, 2002.
Cleveland, W. S., Graedel, T. E., Kleiner, B., and Warner, J. L.: Sunday and workday variations in photochemical air pollutants in New Jersey and New York, Science, 186, 1037–1038, 1974. Elkus, B. and Wilson, K. R.: Photochemical air pollution:
weekend-weekday differences, Atmos. Environ., 11, 509–515, 1977.
Geyer, A., and Plat, U.: The temperature dependence of the NO3
degradation frequency – a new indicator for the contribution of
NO3 to VOC oxidation and NOx removal in the atmosphere,
J. Geophys. Res., 107, 4431–4442, doi:10.1029/2001JD001215, 2002.
Grzegorsky, M.: Determination of cloud parameters for the Global Ozone Monitoring Experiment with broad band spectrometers and from absorption bands of oxygen dimer, Diploma thesis, University of Heidelberg, Germany, 2003.
Jacob, D. J.: The oxidizing power of the atmosphere, Handbook of Weather, Climate and Water, edited by Potter, T. D. and Colman, B., Wiley, 2003.
Lee, D. S., K¨ohler, I., Grobler, E., Rohrer, F., Sausen, R., Gallardo-Klenner, L., Olivier, J. G. J., Dentener, F. J., and Bouwman, A.
F.: Estimations of global NOxemissions and their uncertainties,
Atmos. Environ., 31, 1735–1749, 1997.
Leue, C., Wenig, M., Wagner, T., Klimm, O., Platt, U., and J¨ahne,
B.: Quantitative analysis of NO2emissions from GOME satellite
image sequences, J. Geophys. Res., 106, 5493–5505, 2001. Martin, R. V., Chance, K., Jacob, D. J., Kurosu, T. P., Spurr, R.
J. D., Bucsela, E., Gleason, J. F., Palmer, P. I., Bey, I., Fiore, A. M., Li, Q., Yantosca, R. M., and Koelemeijer, R. B. A.: An improved retrieval of tropospheric nitrogen dioxide from GOME, J. Geophys. Res., 107, D20, 4437, doi:10.1029/2001JD001027, 2002.
Martin, R.V., Jacob, D.J., Chance, K., Kurosu, T.P., Palmer, P.I., Evans, M.J., Global inventory of nitrogen oxide emissions
con-strained by space-based observations of NO2columns, J.
Geo-phys. Res., 108, 4537, doi:10.1029/2003JD003453, 2003. Platt, U.: Differential optical absorption spectroscopy (DOAS),
in Air Monitoring by Spectrometric Techniques, edited by M. Sigrist, Chemical Analysis Series, 127, 27–84, John Wilsy, New York, 1994.
Richter A. and Burrows, J.: Retrieval of Tropospheric NO2from
GOME Measurements, Adv. Space Res., 29, 11, 1673–1683, 2002.
Velders, G. J. M., Granier, C., Portmann, R. W., Pfeilsticker, K., Wenig, M., Wagner, T., Platt, U., Richter, A., and Burrows, J.:
Global tropospheric NO2column distributions: Comparing 3-D
model calculations with GOME measurements, J. Geophys. Res., 106, 12 643–12 660, 2001.
Wagner, T.: Satellite observations of atmospheric halogen oxides, Ph.D. thesis, University of Heidelberg, Germany, 1999. Wenig, M.: Satellite Measurements of Long-Term Global
Tropo-spheric Trace Gas Distributions and Source Strengths, Ph.D. the-sis, University of Heidelberg, Germany, http://mark-wenig.de/ diss mwenig.pdf, 2001.
Wenig, M., K¨uhl, S., Beirle, S., Bucsela, E., Jhne, B., Platt, U., Gleason, J. and Wagner, T., Retrieval and Analysis of
Strato-spheric NO2from GOME, J. Geophys. Res., 2003JD003652R,
in press, 2003.
Wickert, B.: Berechnung anthropogener Emissionen in Deutsch-land f¨ur Ozonsimulationen, Ph.D. thesis, University of Stuttgart, Germany, 2001.