HAL Id: hal-00303979
https://hal.archives-ouvertes.fr/hal-00303979
Submitted on 18 Feb 2008HAL is a multi-disciplinary open access
archive for the deposit and dissemination of sci-entific research documents, whether they are pub-lished or not. The documents may come from teaching and research institutions in France or abroad, or from public or private research centers.
L’archive ouverte pluridisciplinaire HAL, est destinée au dépôt et à la diffusion de documents scientifiques de niveau recherche, publiés ou non, émanant des établissements d’enseignement et de recherche français ou étrangers, des laboratoires publics ou privés.
Antarctic network of lamp-calibrated multichannel
radiometers for continuous ozone and uv radiation data
A. Redondas, C. Torres, O. Meinander, K. Lakkala, R. García, E. Cuevas, H.
Ochoa, G. Deferrari, S. Díaz
To cite this version:
A. Redondas, C. Torres, O. Meinander, K. Lakkala, R. García, et al.. Antarctic network of lamp-calibrated multichannel radiometers for continuous ozone and uv radiation data. Atmospheric Chem-istry and Physics Discussions, European Geosciences Union, 2008, 8 (1), pp.3383-3404. �hal-00303979�
ACPD
8, 3383–3404, 2008 Antartic network of multichannel radiometers A. Redondas et al. Title Page Abstract Introduction Conclusions References Tables Figures ◭ ◮ ◭ ◮ Back CloseFull Screen / Esc
Printer-friendly Version Interactive Discussion Atmos. Chem. Phys. Discuss., 8, 3383–3404, 2008
www.atmos-chem-phys-discuss.net/8/3383/2008/ © Author(s) 2008. This work is distributed under the Creative Commons Attribution 3.0 License.
Atmospheric Chemistry and Physics Discussions
Antarctic network of lamp-calibrated
multichannel radiometers for continuous
ozone and uv radiation data
A. Redondas1, C. Torres1, O. Meinander2, K. Lakkala2, R. Garc´ıa1, E. Cuevas1, H. Ochoa3, G. Deferrari4, and S. D´ıaz4
1
Instituto Nacional de Meteorolog´ıa, Iza ˜na Atmospheric Research Center, Spain 2
Finnish Meteorological Institute, Helsinki, Finland 3
Direcci ´on Nacional del Ant ´artico, Instituto Ant ´artico Argentino, Buenos Aires, Argentina 4
Centro Austral de Investigaciones Cient´ıficas, Ushuaia, Argentina
Received: 3 January 2008 – Accepted: 9 January 2008 – Published: 18 February 2008 Correspondence to: A. Redondas ([email protected])
Published by Copernicus Publications on behalf of the European Geosciences Union.
ACPD
8, 3383–3404, 2008 Antartic network of multichannel radiometers A. Redondas et al. Title Page Abstract Introduction Conclusions References Tables Figures ◭ ◮ ◭ ◮ Back CloseFull Screen / Esc
Printer-friendly Version Interactive Discussion Abstract
Three NILU-UV multichannel radiometers have been installed in 1999 at the Argen-tinian sites of Ushuaia (54S), Marambio (64S) and Belgrano-II (77S) in order to contin-uously monitor UV radiation, photosynthetically active radiation and total ozone. The measurements were established by INM, Spain in collaboration with FMI, Finland, 5
DNA-IAA, Argentina and CADIC, Argentina to observe and characterize the spatial and temporal evolution of ozone and ultraviolet radiation in the Antarctic region. Spe-cial attention has been given to the quality control and quality assurance of the mea-surements under harsh climatological conditions. The ozone and UV time series of 2000–2006 were calibrated using a polynomial fit for lamp measurements performed 10
every second week all year round. The gaps in these data are minimal, with almost no data missing, and the data products are available fromhttp://www.polarvortex.org
in near real time. The data products include the erythemally-weighted UV, UVB and UVA radiation, photosynthetically active radiation (PAR), total ozone (O3) and a cloud parameter (CLT). For UV data, dose rates as well as daily doses are available; from 15
these the maximum measured UV indices (UVI), during 2000–2006, were 12.0, 9.7 and 8.1 at Ushuaia, Marambio and Belgrano-II, respectively.
1 Introduction
Due to climate change, the expected recovery of the stratospheric ozone layer (Had-jinicolaou et al., 2005; Weatherhead and Andersen, 2006) may be endangered, as 20
changes in the climate may serve to cool the stratosphere to temperatures favourable for ozone depletion (Butchart et al., 2000). All the factors that affect UV radiation, i.e., ozone, clouds, albedo (especially the effect of snow cover) and aerosols are related to climate change. Continuous quality- controlled Antarctic measurements of total ozone and UV radiation are therefore of great importance. It is evident that the ozone de-25
ACPD
8, 3383–3404, 2008 Antartic network of multichannel radiometers A. Redondas et al. Title Page Abstract Introduction Conclusions References Tables Figures ◭ ◮ ◭ ◮ Back CloseFull Screen / Esc
Printer-friendly Version Interactive Discussion Organization), 2007).
The Spanish contribution to Antarctic research began with the installation of three UV-VIS spectrometers at the Argentinian bases of Belgrano-II, Marambio and Ushuaia in 1994; in 1999 ozone soundings for the INTA (Instituto Nacional de T ´ecnica Aeroes-pacial, Spain) were started at Belgrano-II, as well as the installation of three radiome-5
ters for the INM (Instituto Nacional de Meteorolog´ıa, Spain), at the above-mentioned stations thanks to the existing agreements on scientific collaboration between the DNA/IAA (Direcci ´on Nacional del Ant ´artico/Instituto Ant ´artico Argentino, Argentina) and INTA and INM, respectively. These complementary and coordinated networks of instruments are intended to observe and characterise the spacial and temporal evo-10
lution of the O3, NO2, OClO and ultraviolet radiation in these regions during coming years. This project will provide and unique information to other Spanish and interna-tional groups involved in Antarctic biology research (Parrondo et al., 2007; Steck et al., 2007; Yela et al., 2003). The observation data are accessible to researcher at the web
http://www.spain.oracle-o3.org. 15
In order to monitor the ozone profiles of the Antarctic, an Argentinian-Finnish co-operation project initiated regular ozone soundings at Marambio in November 1988. Nowadays they make a significant contribution to the regular ozone depletion re-ports, ozone bulletins, compiled by the WMO (http://www.wmo.ch/pages/prog/arep/
gaw/ozone/), and have been used in scientific research (Taalas et al., 1997). The 20
sounding data are available to all researchers from the data bases of WOUDC (World Ozone and UV radiation Data Center) and NILU (Norwegian Institute for Air Research). Since 1999, the ozone-hole-related activities at Marambio have been enlarged into Spanish-Argentinian-Finnish co-operative project, as it became one of the three year-around Antarctic region stations to measure simultaneously total ozone and UV radia-25
tion with NILU-UV multichannel filter radiometers.
Previously, in 1988, NSF (U.S. National Science Foundation) had established a mea-surement network comprising six high-latitude sites from the South Pole to Alaska (Bernhard et al., 2005). The NSF network in the Antarctic region includes Ushuaia
ACPD
8, 3383–3404, 2008 Antartic network of multichannel radiometers A. Redondas et al. Title Page Abstract Introduction Conclusions References Tables Figures ◭ ◮ ◭ ◮ Back CloseFull Screen / Esc
Printer-friendly Version Interactive Discussion (54◦49′S, 68◦19′W), McMurdo (77◦50′S, 166◦40′E), Palmer (64◦46′S, 64◦03′W), and
the South Pole (90◦00′S). NSF sites are equipped with scanning
spectroradiome-ters (type SUV-100 or SUV-150B) and multichannel filter instruments (type GUV-511 or GUV-541). The NSF observations are freely available via the internet at
http://www.biospherical.com/NSF/. 5
The Antarctic NILU-UV network by the Spanish-Finnish-Argentinian co-operative project is unique in the sense that no earlier UV network has linked the Antarctic and the European Arctic. The NILU-UV network travelling reference of FMI, described fur-ther in Sect. 2.2, can be used to compare and transfer the UV irradiance scale from one hemisphere to another. In addition to this, the station of Ushuaia belongs to both 10
the NSF and our network. This makes solar comparisons possible, and all the stations of both of networks can be used for any study with knowledge of the irradiance scales. According to Lakkala et al. (2005), the irradiance scales of NSF and our network are within 5%.
The ozone and UV data from the NILU-UV network, documented here for the first 15
time, are quality-controlled, continuous and have the potential for wide use among scientists. Recently, the results of the network were also used for the WMO ozone bulletin for the first time. The quality assurance of the network has been published earlier in Lakkala et al. (2005).
2 NILU-UV antarctic network
20
In 1999, an Antarctic network of multichannel NILU-UV instruments was established in order to measure real-time ground-based UV radiation and total ozone columns. The network was established by INM in collaboration with FMI, DNA-IAA and CADIC (Centre for Scientific Research, Argentina). The main objectives of the network are to observe and to characterise the spatial and temporal evolution of both the ozone and 25
the ultraviolet radiation in the Antarctic region and to carry out dynamics studies of the Antarctic polar vortex. At the present time, the network has been consolidated, and
ACPD
8, 3383–3404, 2008 Antartic network of multichannel radiometers A. Redondas et al. Title Page Abstract Introduction Conclusions References Tables Figures ◭ ◮ ◭ ◮ Back CloseFull Screen / Esc
Printer-friendly Version Interactive Discussion this makes it possible to analyse how the daily evolution of the vortex affects the ozone
and UV radiation. Great effort has been put into the quality control of the network data so that they can also be used for studies that require high accuracy in the data, e.g., climatological studies.
2.1 Stations 5
NILU-UV multichannel filter radiometers have been set up at three Argentinian Antarctic stations. The location of the stations with respect to the stratospheric polar vortex, and to the ozone depletion area, is the underlying motive for selecting the sites: Belgrano-II (77◦52′29′′S, 34◦37′37′′W, 50 m a.s.l.) is mostly located inside the vortex; Marambio
(64o14′S, 56o38′W, 200 m a.s.l.) is at various times inside, on the edge of, or outside
10
the vortex; while Ushuaia (54◦49′S, 68◦19′W, 50 m a.s.l.) is mostly outside the vortex.
All these bases are permanent and manned all the year round. At all the stations, the NILU-UV radiometers are installed on the roofs of the permanent buildings of the bases.
The Argentinian city of Ushuaia is the southernmost city in the world, and is located 15
on Grande Island of the Land of the Fire. Ushuaia is affected by the Antarctic ozone loss, especially during an event in which it is beneath the vortex, and for this reason it is one of the most populated towns affected by the yearly ozone loss. Ushuaia is the capital of the Land of the Fire, and it extends over the slopes of the Martial Mounts. The measurement instruments are in the facilities of the CADIC. This Center was created 20
on the 9 of April, 1969, and belongs to the National Council of Scientific and Technical Research (CONICET). In Ushuaia, the weather is variable all year round, with the lowest daily mean temperature of 1◦C occurring at the end of July and beginning of
August.
Marambio and Belgrano-II are two of the six Argentinian bases that remain open all 25
year long, and belong to IAA-DNA. They were set up in 1969 and 1979, respectively. Marambio is located on the Island of Seymour, approximately 1.6 km to the NE of the Island of Cerro Nevado on the southern margin of the gulfs of Erebus and Terror in
ACPD
8, 3383–3404, 2008 Antartic network of multichannel radiometers A. Redondas et al. Title Page Abstract Introduction Conclusions References Tables Figures ◭ ◮ ◭ ◮ Back CloseFull Screen / Esc
Printer-friendly Version Interactive Discussion the Sea of Weddell. This base is located on a plateau 14 km in length and 8 km wide,
200 m a.s.l., and hosts many other scientific instruments, e.g., for carrying out regular ozone soundings and aerosol measurements. Sometimes the air masses there orig-inate in midlatitudes and have high total ozone column values, while at other times polar air masses with only little ozone affect the area. Belgrano-II is located in Nunatak 5
Bertrab, on the Confin Coast (Land of Coast), Sea of Weddell. Because of its location, this base is one of the most important observatories for the study of the ozone destruc-tion during the austral spring, but it is only accessible once a year, during the austral summer, and then only with the aid of the “Icebreakers Almirante Irizar”. The weather at Belgrano-II is harsh. The wind may reach 200 km/h, and the measured maximum 10
and minimum temperatures range from −2◦C to −4◦C. Due to the high latitude, the sun
does not rise at all for 4 months of the year. 2.2 Instrument
The NILU-UV 6T radiometer is a filter instrument with five UV channels, with central wavelengths at around 305, 312, 320, 340 and 380 nm, and bandwidths of around 15
10 nm at full-width half-maximum (FWHM). A sixth channel measures the photosyn-thetic active radiation (PAR) in the 400–700 nm wavelength region. The radiometer has a Teflon diffuser, silicon detectors, high-quality bandpass filters and is temperature-stabilized to 40◦C. One-min averages of measured irradiances and detector
tempera-tures are recorded. The measurements can be used to retrieve UV-B, UV-A, erythe-20
mally -weighted UV radiation and the total ozone column, as well as to provide cloudi-ness information, using the method described by Dahlback (1996). The characteristics of the instrument are described in more detail in H ¨oiskar et al. (2003).
During the period 2000–2006, the NILU-UV #012 and NILU-UV #011 radiometers have been measuring continuously at Ushuaia and Marambio, respectively, while at 25
the Belgrano-II base, three different instruments have been used for measurements: NILU-UV #009, NILU-UV #010 and NILU-UV #023 (Table 1). Due to technical prob-lems during the exchange of instruments in Belgrano-II, the NILU-UV#023 has been
ACPD
8, 3383–3404, 2008 Antartic network of multichannel radiometers A. Redondas et al. Title Page Abstract Introduction Conclusions References Tables Figures ◭ ◮ ◭ ◮ Back CloseFull Screen / Esc
Printer-friendly Version Interactive Discussion measuring in this site since 2004 until now.
2.3 Quality control (QC) and Quality assurance (QA)
The quality control and quality assurance of the network is based on regular lamp mea-surements and, for UV radiation meamea-surements, on a travelling reference (Lakkala et al., 2005). An important part of the quality control has been to train the station opera-5
tors; this training is repeated every second year. The operators perform daily checks that include timing control and cleaning of the diffuser. The levelling of the instrument is also regularly checked. The operators perform lamp tests and dark current measure-ments, as well as solar comparisons between the station instrument and the travelling reference NILU-UV radiometer.
10
2.3.1 Lamp measurements: QC
The quality control for the site instruments consists of 100 W OSRAM Radium lamp measurements and dark current measurements. Two lamps are measured every two weeks and a third lamp is measured on every third calibration to exclude possible lamp drift. During the calibration, the power supply of the lamp is controlled with software 15
that keeps the lamp intensity constant. Lamp tests are also made before and after each solar comparison to determinate the stability of the reference NILU.
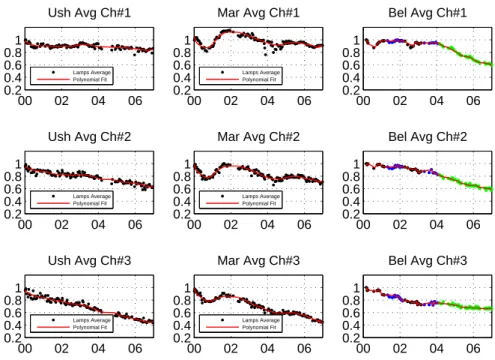
In order to study the stability of the NILU-UV, the lamp measurement time series for each instrument was calculated. The normalized averages of lamp measurements at Ushuaia, Marambio and Belgrano (2000–2006) are shown in Fig. 1. The results of all 20
the six channels of the radiometer are shown. In each case, the lamp averages were normalized with the first calibration, in order to observe any changes in the sensitivity of the channels.
When we have four successive instruments at one station, as at Belgrano-II, it is not always is possible to perform a direct comparison of the two instruments being 25
interchanged. In this case, the last lamp calibration of the leaving instrument and the 3389
ACPD
8, 3383–3404, 2008 Antartic network of multichannel radiometers A. Redondas et al. Title Page Abstract Introduction Conclusions References Tables Figures ◭ ◮ ◭ ◮ Back CloseFull Screen / Esc
Printer-friendly Version Interactive Discussion first lamp calibration of the replacing instrument are used to adjust the calibration scales
of the instruments. As the instruments are manufactured using the same filter batch, we convert the measurements of the lamps for each instrument to that of the other one before it. In this way, all calibrations are referenced to the first instrument NILU-UV #009 and a unique lamp series is used for all the NILU-UV radiometers at Belgrano-II. 5
Changes of more than 50% in the sensitivity of some of the channels have been observed in all the instruments. The channels with the largest drift are #3 and #4 in all the radiometers. To obtain the UV dose rates and ozone, the observed values have been corrected for the drift of the channels. The procedure used is shown in Sect. 3 and its validation using ozone measurements from different sources was described in 10
Torres et al. (2002).
2.3.2 Travelling reference: QA
The quality assurance of the UV measurements of the whole network is based on a travelling reference NILU-UV which makes it possible to maintain the absolute irradi-ance scale of the different stations. The irradiirradi-ance scale can be transferred using the 15
results of solar comparisons between the reference NILU-UV and the NILU-UV of the station (Lakkala et al., 2005). The travelling reference visits Ushuaia three times and Marambio twice during the spring-summer-autumn season. Visits of the travelling ref-erence to Belgrano-II are impossible, due to the inaccessibility of the site for most of the year. Access is possible, using an icebreaker, only during the summer, when the NILU-20
UV at Belgrano is replaced each year by another, well-calibrated, NILU-UV, of which the calibration is traceable to the irradiance scale used at Marambio and Ushuaia.
The travelling reference is calibrated every year or every second year. During the winter period of the Antarctic, the reference NILU-UV measures in the Arctic, and may attend intercomparison campaigns. This makes possible the comparison of UV mea-25
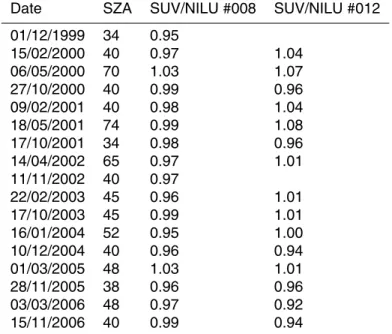
surements performed in both hemispheres using the same irradiance scale. Table 2 shows the ratios between the erythemally-weighted UV dose rates retrieved from the reference NILU-UV, network NILU#012 and those measured by the NSF-network
SUV-ACPD
8, 3383–3404, 2008 Antartic network of multichannel radiometers A. Redondas et al. Title Page Abstract Introduction Conclusions References Tables Figures ◭ ◮ ◭ ◮ Back CloseFull Screen / Esc
Printer-friendly Version Interactive Discussion spectroradiometer at Ushuaia. The results are shown for the lowest SZA in almost
clear-sky conditions. A cosine correction of 5% has been assumed for the SUV-data (Bernhard, G., personal communication, 2004). The results show compatibility within the measurement uncertainties. The reference instrument for the calibration of the reference NILU-UV is the Bentham spectroradiometer of the NRPA, whose irradiance 5
scale is traceable to the National Institute of Standards and Technology (NIST) via the laboratory of SP, the Swedish National Testing and Research Institute (Johnsen et al., 2002). The irradiance scale of the SUV-spectroradiometer is also traceable to the NIST via 200 W lamps (Bernhard et al., 2006).
3 Measurements
10
The total ozone column and the biologically-effective UV rates are determinate using the method described by Dahlback (1996).
The total ozone column (Ω) is determined by comparing a calculated irradiance ratio, (N′), with the corresponding measured ratio (N), Eq. (1),
N(θ,Ω)=Vi(θ,Ω)/Vj(θ,Ω) (1) 15
where Vi and Vj are the irradiances in two channels with a different sensitivity to ozone absorption. We have used the ratio between the irradiances at 320 nm (Vi) and 312 nm (Vj), low and high ozone absorption, respectively. A radiative-transfer model (Mayer and Kylling, 2005) is used to determine a look-up table of ratioN′as a function of solar
zenith angle (θ) and ozone (Ω). The look-up table also depends on the atmosphere,
20
ozone profile, aerosols, clouds and surface albedo.
The UV dose rates (D), Eq. (2), are determined as a linear combination of the
irradi-ances, represented by the NILU-UV raw data (Vi) obtained from the five UV channels (i ). D = 5 X i =1 aiVi (2) 25 3391
ACPD
8, 3383–3404, 2008 Antartic network of multichannel radiometers A. Redondas et al. Title Page Abstract Introduction Conclusions References Tables Figures ◭ ◮ ◭ ◮ Back CloseFull Screen / Esc
Printer-friendly Version Interactive Discussion In order to obtain the coefficients of the linear combination (ai),
spectroradiometer-based calibration and radiative-transfer calculations are needed (Dahlback, 1996). To apply this method, it is necessary to correct the drift shown by the quality control. A polynomial fit is calculated with the normalized average of lamp measurements to ob-tain a daily correction coefficient for each channel and instrument (Fig. 1). With these 5
coefficients, all the raw data are referenced to the first absolute calibration. This first calibration of all the network instruments was performed by the manufacturer at the Iza ˜na Atmospheric Observatory, Iza ˜na (Tenerife, Spain), in 1999. Following that, NILU-UV #012, NILU-NILU-UV #011 and NILU-NILU-UV #009 were set up at Ushuaia, Marambio and Belgrano-II, respectively. All measurements are referenced to the first instrument NILU-10
UV #009 at Belgrano-II and all the other instruments are converted to this standard. The drift is corrected using its normalized lamp average, as at the other stations. With this correction method all the three stations maintain the scale of the manufacturer cal-ibration; this absolute scale can be changed using the travelling reference in Ushuaia and Marambio and in Belgrano we can use the NILU#023 compared with QASUME unit 15
(Gr ¨obner et al., 2005) just before its setup at Belgrano as is described by Meinander et al. (2004).
4 Results and discussion
4.1 Ozone and UV time series
As the NILU-UV instrument gives a reading every min, it is perfect for monitoring rapid 20
changes in the atmosphere. The total ozone changes during a day can be followed, as well as the exact UV daily doses, even during days with rapidly-changing cloudiness. The time series of 2000–2006 covers almost all the days of the year, with a minimal amount of missing data.
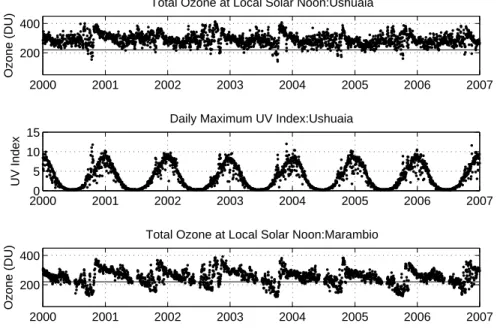
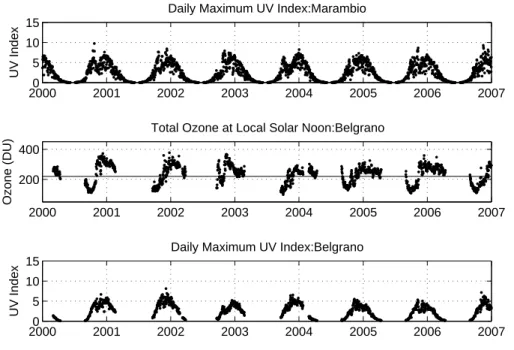
The total ozone and maximum daily UV index time series are shown in Fig. 2 for 25
ACPD
8, 3383–3404, 2008 Antartic network of multichannel radiometers A. Redondas et al. Title Page Abstract Introduction Conclusions References Tables Figures ◭ ◮ ◭ ◮ Back CloseFull Screen / Esc
Printer-friendly Version Interactive Discussion radiation is clearly seen in the time series. Maximum spring-time UV values are mostly
connected with low ozone values. The daily evolution of the stratospheric polar vortex can also be studied from our measurements. The location of the polar vortex and its associated low ozone values can move from day to day and have an effect even at the latitudes of Ushuaia. This event is usually recorded as high UV values at Ushuaia. 5
During 2000–2006, the highest UV index value measured at Ushuaia was 12.0 on 27 Nov 2003. For the same period the highest UV index at Marambio was 8.1 on 04 Dec 2001 and 9.7 in Marambio on 22 Oct 2000.
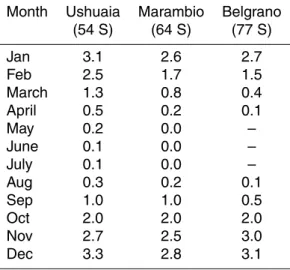
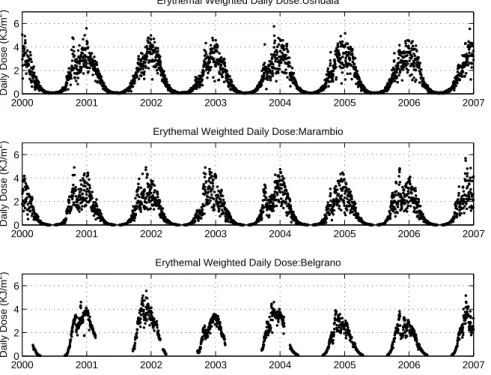
The UV daily doses at three stations are shown in Fig. 3 during spring-time the daily doses are similar, even though the latitude of Marambio and Belgrano would sug-10
gest significantly lower UV daily doses comparing with Ushuaia. High daily doses are strongly connected to low ozone values at Marambio and low cloudiness at Belgrano. The monthly means of erythemally-weighted UV daily doses are shown in Table 3. 4.2 Web site implementation
The NILU-UVs at the bases are controlled by individual workstations, in which the raw 15
data are stored. The raw data are remotely harvested from the logging computers, and all data products are calculated and presented on the webpagehttp://www.polarvortex.
org as soon as they are available. These data available from the web are thus real-time data and are considered to be provisional. Any user of the data is kindly asked to contact the web-master to get the latest QC/QA information. Two types of data are 20
available for downloading: daily course data (of ozone, UVI, CIE, UVA, UVB, UVA/UVB CLT, PAR ) and summary files with the solar noon data. For both, two data versions, V1.1 and V1.2 exist, depending on the last available lamp test. V1.1 contains data extending up to the last-available stability check, while V1.2 is produced when the data has been processed using both the previous and the following lamp test. V1.1 is 25
updated daily and V1.2 every two weeks after the lamp test has been performed.
ACPD
8, 3383–3404, 2008 Antartic network of multichannel radiometers A. Redondas et al. Title Page Abstract Introduction Conclusions References Tables Figures ◭ ◮ ◭ ◮ Back CloseFull Screen / Esc
Printer-friendly Version Interactive Discussion
5 Conclusions
In this paper we have presented the Antarctic NILU-UV network established in 1999 as a joint Spanish-Finnish-Argentinian co-operation. Three NILU-UV multichannel ra-diometers have been installed at the sites of Ushuaia, Marambio and Belgrano-II. Spe-cial attention has been given to the quality control and quality assurance of the data. 5
Initial and refresher training is provided for the operators, and regular lamp tests are performed in order to monitor the stability of the instruments. Severe drift of the chan-nels of the multifilter radiometers has been detected and corrected in order to produce homogenized time series. The time series contain daily UV and ozone data since 2006 and are available online at http://www.polarvortex.org. The data contain UVB, UVA, 10
erythemally-weighted UV dose rates, PAR and cloud information, and ozone data. Daily summaries of UV data are also available.
It is of major importance to continue long-term measurements of ozone and UV in the Antarctic region; extension of the existing valuable data series will enable monitoring of future changes of all the relevant environmental factors, and ensure the availability 15
of these data to the research community representing various fields of science. We have found the NILU-UV radiometer to be a good instrument for operation in harsh environments, but that QA/QC are essential to monitor the drift in the sensitivity of the channels. In the future, we plan to include the Norwegian Troll station (72◦0′S, 2◦32′E)
in the network and its data in the web pages. 20
Acknowledgements. The MAR Project is financed by the National R&D Plan of the
Span-ish Ministry of Science and Technology (National Research Program in the Antarctic) under contract REN2000-0245-C02-01.The Academy of Finland has given financial support for this work (FARPOCC -project). The SUV-spectroradiometer UV data from Ushuaia were provided by the NSF UV Monitoring Network, operated by Biospherical Instruments Inc. under a con-25
tract from the United States National Science Foundation’s Office of Polar Programs via the Raytheon Polar Services Company. We are grateful to B. Johnsen of the Norwegian Radiation Protection Authority for relative response measurements and fruitful discussions. We thank the operators of the NILU-UV Antarctic Network.
ACPD
8, 3383–3404, 2008 Antartic network of multichannel radiometers A. Redondas et al. Title Page Abstract Introduction Conclusions References Tables Figures ◭ ◮ ◭ ◮ Back CloseFull Screen / Esc
Printer-friendly Version Interactive Discussion References
Bernhard, G., Booth, C. R., and Ehramjian, J. C.: Real-time ultraviolet and column ozone from multichannel ultraviolet radiometers deployed in the national science foundation’s ultraviolet monitoring network, Opt. Eng., 44, 1011–1012, 2005.
Bernhard, G., Booth, G. R., Ehramjian, J. C., and Quang, V. V.: Nsf polar programs uv spectro-5
radiometer network 2003–2004 operations report, United States, National Science Founda-tion/Biospherical Instruments Inc, San Diego, CA, 2006.
Butchart, N., Austin, J., Knight, J. R., Scaife, A. A., and Gallani, M. L.: The response of the stratospheric climate to projected changes in the concentrations of well-mixed greenhouse gases from 1992 to 2051, J. Climate, 13, 2142–2159, 2000.
10
Dahlback, A.: Measurements of biologically effective uv doses, total ozone abundances, and cloud effects with multichannel, moderate bandwidth filter instruments, Appl. Optics, 35, 6514–6521, 1996.
Gr ¨obner, J., Schreder, J., Kazadzis, S., Bais, A., Blumthaler, M., Garts, P., Tax, R., Koskela, T., Seckmeyer, G., Webb, A., and Rembges, D.: Traveling reference spectroradiometer for 15
routine quality assurance of spectral solar ultraviolet irradiance measurements, Appl. Optics, 44, 5321–5331, 2005.
Hadjinicolaou, P., Pyle, J. A., and Harris, N. R. P.: The recent turnaround in stratospheric ozone over northern middle latitudes: A dynamical modeling perspective, Geophys. Res. Lett., 32, L12821, doi:10.1029/2005GL022476, 2005.
20
H ¨oiskar, B., Haugen, R., Danielsen, T., Kylling, A., Edvardsen, K. R., Dahlback, A., Johnsen, B. R., Blumthaler, M., and Schreder, J.: Multichannel moderate-bandwidth filter instrument for measurement of the ozone-column amount, cloud transmittance, and ultraviolet dose rates, Appl. Optics, 42, 3472–3479, 2003.
Johnsen, B., Mikkelborg, O., Dahlback, A., Høiskar, B. A., Kylling, A., Edvardsen, K., Olseth, 25
J. A., Kjeldstad, B., and Ørbæk, J.: Quality control of the norwegian uv monitoring network, EGS XXVII General Assembly, Nice, 21–26 April 2002, abstract #1576, 27, 1576, 2002. Lakkala, K., Redondas, A., Meinander, O., Torres, C., Koskela, T., Cuevas, E., Taalas, P.,
Dahlback, A., Deferrari, G., Edvardsen, K., and Ochoa, H.: Quality assurance of the solar uv network in the antarctic, J. Geophys. Res., 110, D15101, doi:10.1029/2004JD005584, 2005. 30
Mayer, B. and Kylling, A.: Technical note: The libradtran software package for radiative transfer calculations – description and examples of use, Atmos. Chem. Phys., 5, 1855–1877, 2005,
ACPD
8, 3383–3404, 2008 Antartic network of multichannel radiometers A. Redondas et al. Title Page Abstract Introduction Conclusions References Tables Figures ◭ ◮ ◭ ◮ Back CloseFull Screen / Esc
Printer-friendly Version Interactive Discussion
http://www.atmos-chem-phys.net/5/1855/2005/.
Meinander, O., Koskela, T., Lakkala, K., and Redondas, A.: Antarctic nilu-uv network linked to qasume and nsf irradiance scales, in: XX Quadrennial Ozone Symposium, Kos, Greece, 1128–1129, 2004.
Parrondo, M. C., Yela, M., Gil, M., von der Gathen, P., and Ochoa, H.: Mid-winter lower strato-5
sphere temperatures in the antarctic vortex: Comparison between observations and ecmwf and ncep operational models, Atmos. Chem. Phys., 7, 435–441, 2007,
http://www.atmos-chem-phys.net/7/435/2007/.
Steck, T., von Clarmann, T., Fischer, H., Funke, B., Glatthor, N., Grabowski, U., H ¨opfner, M., Kellmann, S., Kiefer, M., Linden, A., Milz, M., Stiller, G. P., Wang, D. Y., Allaart, M., Blu-10
menstock, T., von der Gathen, P., Hansen, G., Hase, F., Hochschild, G., Kopp, G., Kyr ¨o, E., Oelhaf, H., Raffalski, U., Marrero, R., Remsberg, E., Russell, J., Stebel, K., Steinbrecht, W., Wetzel, G., Yela, M., and Zhang, G.: Bias determination and precision validation of ozone profiles from mipas-envisat retrieved with the imk-iaa processor, Atmos. Chem. Phys., 7, 3639–3662, 2007,
15
http://www.atmos-chem-phys.net/7/3639/2007/.
Taalas, P., Damski, J., Kyr, E., Ginzburg, M., and Talamoni, G.: Effect of stratospheric ozone variations on uv radiation and on tropospheric ozone at high latitudes, J. Geophys. Res., 102, 1533–1540, 1997.
Torres, C., Redondas, A., Cuevas, E., Lakkala, K., and Taalas, P.: Correction and validation 20
of total ozone data series from an antarctic multichannel filter radiometer solar uv network, EGS XXVII General Assembly, Nice, France, 21–26 April 2002, abstract# 6222, 27, 2002. Weatherhead, E. and Andersen, S.: The search for signs of recovery of the ozone layer, Nature,
441, 39–45, 2006.
WMO (World Meteorological Organization): Scientific assessment of ozone depletion, 25
Geneva,Switherland Global Ozone Research and Monitoring Project-50, 572 pp., 2007. Yela, M., Parrondo, C., Rodr, S., Gil, M., Araujo, J., Ochoa, H., Diaz, S., Deferrari, G., and
Reimer, E.: The 2002 antarctic vortex splitting as observed from visible spectroscopy and ozonesoundings, EGS – AGU – EUG Joint Assembly, Abstracts from the meeting held in Nice, France, 6–11 April 2003, abstract# 9093, 2003.
ACPD
8, 3383–3404, 2008 Antartic network of multichannel radiometers A. Redondas et al. Title Page Abstract Introduction Conclusions References Tables Figures ◭ ◮ ◭ ◮ Back CloseFull Screen / Esc
Printer-friendly Version Interactive Discussion Table 1. NILU-UV radiometers set up in the Base Belgrano-II.
Instruments Date Date NILU-UV #009 02/03/2000 26/02/2001 NILU-UV #010 27/02/2001 23/02/2002 NILU-UV #009 24/02/2002 25/02/2003 NILU-UV #010 25/02/2003 03/02/2004 NILU-UV #023 04/02/2004 To present 3397
ACPD
8, 3383–3404, 2008 Antartic network of multichannel radiometers A. Redondas et al. Title Page Abstract Introduction Conclusions References Tables Figures ◭ ◮ ◭ ◮ Back CloseFull Screen / Esc
Printer-friendly Version Interactive Discussion Table 2. The ratios of erythemally-weighted UV dose rates between the reference NILU-UV
#008 the network NILU-UV #012 and the SUV-spectroradiometer at Ushuaia during 2000– 2006.
Date SZA SUV/NILU #008 SUV/NILU #012 01/12/1999 34 0.95 15/02/2000 40 0.97 1.04 06/05/2000 70 1.03 1.07 27/10/2000 40 0.99 0.96 09/02/2001 40 0.98 1.04 18/05/2001 74 0.99 1.08 17/10/2001 34 0.98 0.96 14/04/2002 65 0.97 1.01 11/11/2002 40 0.97 22/02/2003 45 0.96 1.01 17/10/2003 45 0.99 1.01 16/01/2004 52 0.95 1.00 10/12/2004 40 0.96 0.94 01/03/2005 48 1.03 1.01 28/11/2005 38 0.96 0.96 03/03/2006 48 0.97 0.92 15/11/2006 40 0.99 0.94
ACPD
8, 3383–3404, 2008 Antartic network of multichannel radiometers A. Redondas et al. Title Page Abstract Introduction Conclusions References Tables Figures ◭ ◮ ◭ ◮ Back CloseFull Screen / Esc
Printer-friendly Version Interactive Discussion Table 3. Monthly mean Erithemal Daily Dose (KJ/m2) for the three stations, even thoungth
with the different latitude of the stations the values are comparable and even higher on the southermost station Belgrano.
Month Ushuaia Marambio Belgrano (54 S) (64 S) (77 S) Jan 3.1 2.6 2.7 Feb 2.5 1.7 1.5 March 1.3 0.8 0.4 April 0.5 0.2 0.1 May 0.2 0.0 – June 0.1 0.0 – July 0.1 0.0 – Aug 0.3 0.2 0.1 Sep 1.0 1.0 0.5 Oct 2.0 2.0 2.0 Nov 2.7 2.5 3.0 Dec 3.3 2.8 3.1 3399
ACPD
8, 3383–3404, 2008 Antartic network of multichannel radiometers A. Redondas et al. Title Page Abstract Introduction Conclusions References Tables Figures ◭ ◮ ◭ ◮ Back CloseFull Screen / Esc
Printer-friendly Version Interactive Discussion 00 02 04 06 0.2 0.4 0.6 0.8 1 Ush Avg Ch#1 Lamps Average Polynomial Fit 00 02 04 06 0.2 0.4 0.6 0.81 Ush Avg Ch#2 Lamps Average Polynomial Fit 00 02 04 06 0.2 0.4 0.6 0.81 Ush Avg Ch#3 Lamps Average Polynomial Fit 00 02 04 06 0.2 0.4 0.6 0.8 1 Mar Avg Ch#1 Lamps Average Polynomial Fit 00 02 04 06 0.2 0.4 0.6 0.81 Mar Avg Ch#2 Lamps Average Polynomial Fit 00 02 04 06 0.2 0.4 0.6 0.81 Mar Avg Ch#3 Lamps Average Polynomial Fit 00 02 04 06 0.2 0.4 0.6 0.8 1 Bel Avg Ch#1 00 02 04 06 0.2 0.4 0.6 0.81 Bel Avg Ch#2 00 02 04 06 0.2 0.4 0.6 0.81 Bel Avg Ch#3
Fig. 1. Lamp measurements time series of Ushuaia, Marambio and Belgrano during 2000– 2006. Results of the six channels are shown together with the average of the lamps and the polynomial fit. The colors in Belgrano series indicate the different instrumetns used.
ACPD
8, 3383–3404, 2008 Antartic network of multichannel radiometers A. Redondas et al. Title Page Abstract Introduction Conclusions References Tables Figures ◭ ◮ ◭ ◮ Back CloseFull Screen / Esc
Printer-friendly Version Interactive Discussion 00 02 04 06 0.2 0.4 0.6 0.81 Ush Avg Ch#4 Lamps Average Polynomial Fit 00 02 04 06 0.2 0.4 0.6 0.8 1 Ush Avg Ch#5 Lamps Average Polynomial Fit 00 02 04 06 0.2 0.4 0.6 0.8 1 Ush Avg Ch#6 Lamps Average Polynomial Fit 00 02 04 06 0.2 0.4 0.6 0.81 Mar Avg Ch#4 Lamps Average Polynomial Fit 00 02 04 06 0.2 0.4 0.6 0.8 1 Mar Avg Ch#5 Lamps Average Polynomial Fit 00 02 04 06 0.2 0.4 0.6 0.8 1 Mar Avg Ch#6 Lamps Average Polynomial Fit 00 02 04 06 0.2 0.4 0.6 0.81 Bel Avg Ch#4 00 02 04 06 0.2 0.4 0.6 0.8 1 Bel Avg Ch#5 00 02 04 06 0.2 0.4 0.6 0.8 1 Bel Avg Ch#6 Fig. 1. Continued. 3401
ACPD
8, 3383–3404, 2008 Antartic network of multichannel radiometers A. Redondas et al. Title Page Abstract Introduction Conclusions References Tables Figures ◭ ◮ ◭ ◮ Back CloseFull Screen / Esc
Printer-friendly Version Interactive Discussion 2000 2001 2002 2003 2004 2005 2006 2007 200 400 Ozone (DU)
Total Ozone at Local Solar Noon:Ushuaia
20000 2001 2002 2003 2004 2005 2006 2007 5
10 15
UV Index
Daily Maximum UV Index:Ushuaia
2000 2001 2002 2003 2004 2005 2006 2007 200
400
Ozone (DU)
Total Ozone at Local Solar Noon:Marambio
Fig. 2. Time series of total ozone and UV index at Ushuaia, Marambio and Belgrano-II during 2000–2006. Horizontal line in ozone plots indicate the level Ozone hole level off 220 Dobson Units.
ACPD
8, 3383–3404, 2008 Antartic network of multichannel radiometers A. Redondas et al. Title Page Abstract Introduction Conclusions References Tables Figures ◭ ◮ ◭ ◮ Back CloseFull Screen / Esc
Printer-friendly Version Interactive Discussion 20000 2001 2002 2003 2004 2005 2006 2007 5 10 15 UV Index
Daily Maximum UV Index:Marambio
2000 2001 2002 2003 2004 2005 2006 2007 200
400
Ozone (DU)
Total Ozone at Local Solar Noon:Belgrano
20000 2001 2002 2003 2004 2005 2006 2007 5
10 15
UV Index
Daily Maximum UV Index:Belgrano
Fig. 2. Continued.
ACPD
8, 3383–3404, 2008 Antartic network of multichannel radiometers A. Redondas et al. Title Page Abstract Introduction Conclusions References Tables Figures ◭ ◮ ◭ ◮ Back CloseFull Screen / Esc
Printer-friendly Version Interactive Discussion 20000 2001 2002 2003 2004 2005 2006 2007 2 4 6 Daily Dose (KJ/m 2)
Erythemal Weighted Daily Dose:Ushuaia
20000 2001 2002 2003 2004 2005 2006 2007 2 4 6 Daily Dose (KJ/m 2)
Erythemal Weighted Daily Dose:Marambio
20000 2001 2002 2003 2004 2005 2006 2007 2 4 6 Daily Dose (KJ/m 2)
Erythemal Weighted Daily Dose:Belgrano
Fig. 3. Time series of Erythemal Daily Dose Ushuaia, Marambio and Belgrano-II during 2000– 2006.