HAL Id: hal-01089616
https://hal.archives-ouvertes.fr/hal-01089616
Submitted on 2 Dec 2014
HAL is a multi-disciplinary open access
archive for the deposit and dissemination of
sci-entific research documents, whether they are
pub-lished or not. The documents may come from
teaching and research institutions in France or
abroad, or from public or private research centers.
L’archive ouverte pluridisciplinaire HAL, est
destinée au dépôt et à la diffusion de documents
scientifiques de niveau recherche, publiés ou non,
émanant des établissements d’enseignement et de
recherche français ou étrangers, des laboratoires
publics ou privés.
Bertifier: New Interactions for Crafting Tabular
Visualizations
Charles Perin, Pierre Dragicevic, Jean-Daniel Fekete
To cite this version:
Charles Perin, Pierre Dragicevic, Jean-Daniel Fekete. Bertifier: New Interactions for Crafting Tabular
Visualizations. IHM’14, 26e conférence francophone sur l’Interaction Homme-Machine, Oct 2014, Lille,
France. pp.16-17, 2014. �hal-01089616�
Bertifier: New Interactions for Crafting Tabular
Visualizations
Charles Perin
INRIA, Univ. Paris-Sud &
CNRS-LIMSI
Bat. 660, Orsay, France
[email protected]
Pierre Dragicevic
INRIA
Bat. 660, Orsay, France
[email protected]
Jean-Daniel Fekete
INRIA
Bat. 660, Orsay, France
[email protected]
ABSTRACT
Bertifier is a Web app for rapidly creating tabular visual-izations from spreadsheets. It directly draws from Jacques Bertin’s matrix analysis method, whose goal was to “sim-plify without destroying” by encoding cell values visu-ally and grouping similar rows and columns. Bertifier has the potential to bring Bertin’s method to a wide au-dience of both technical and non-technical users, and em-power them with data analysis and communication tools that were so far only accessible to a handful of specialists.
www.aviz.fr/Bertifiercontains additional material ma-terials, a tutorial, and a link to the online open-source ap-plication.
Key Words
Visualization; Bertifier; Crossing; Crossets; Bertin Matrices; Tables.
ACM Classification Keywords
H.5.m. Information Interfaces and Presentation (e.g. HCI): Miscellaneous.
INTRODUCTION
Standard GUIs use only one dimension of the screen 2D space—and one dimension of the mouse—to interact with sliders, while several works take advantage of the dimen-sion orthogonal to the sliders’ axis [2, 6], that we call the orthogonal dimension. Despite the fact that crossing [1] for selecting several objects in a single gesture is well suited to the simultaneous manipulation of multiple slid-ers, this technique has never been applied to manipulate the orthogonal dimension of sliders. While pointing re-quires to target an object and press the mouse button to activate it, crossing consists of pressing the mouse button and moving the cursor in a series of graphical objects to activate them all.
Crossets [9] are beneficial for interfaces presenting ob-jects that are similar, aligned, and on which users often perform the same small set of actions over a range of consecutive objects. Spreadsheet calculators for exam-ple, would benefit from Crossets to apply specific format-ting/coloring to a subset of rows (or columns). Currently,
users have to select the rows on which to apply the action, then open a menu and apply the action using a action-deselection cycle. Crossets can avoid the selection-deselection, and apply the action directly with continuous feedback. In this demonstration, we present Bertifier [10], an online application entirely based on crossets for craft-ing tabular visualization from quantitative spreadsheets.
BERTIFIER
Bertifier is an online application for crafting tabular visualizations from quantitative spreadsheets, based on Jacques Bertin’s matrices analysis method [4, 5]. As de-tailed in [10], Bertifier remains faithful to Bertin’s method while leveraging recent advances in HCI in order to pro-vide a tool accessible to a wide range of users.
Bertifier loads any spreadsheet containing quantitative data. It allows for visually encoding cell values using various encodings (e. g.,barchart, circle height, and posi-tion). Moreover, as heterogeneous data implies heteroge-neous visual encodings, each dimension of the table can be encoded independently. . Following Bertin’s method, Bertifier features formatting tools (e. g.,separators, rows and columns resizing) and free annotation tools to both improve the visual exploration process and the communi-cation process. One of the main characteristics of Bertifier is the visual reordering it provides. Rows and columns can be dragged and dropped to manually reorder the ta-ble, but subsets of rows and columns can also be auto-matically reordered using associated crossets; as a result, Bertifier makes it possible to reorder visually numerical tables without requiring any mathematical or statistical background, as this was confirmed during a qualitative user study [10]. Finally, an export functionality allows users to export the final visualization as a vector graphic file for further modifications.
To summarize, Bertifier features the following functional-ists, based on Jacques Bertin’s requirements for matrices analysis:
1. allow the creation of a table from raw data
2. perform data conditioning: scale, clamp range, dis-cretize (step), and inverse rows/columns values so they become comparable
3. select an encoding for cell values 4. present the table visually
5. reorder the rows/columns to group similar items to-gether and move apart dissimilar ones
6. group rows/columns that form meaningful chunks 7. annotate the matrix (name groups)
8. finalize the results for communication / publication
16
16
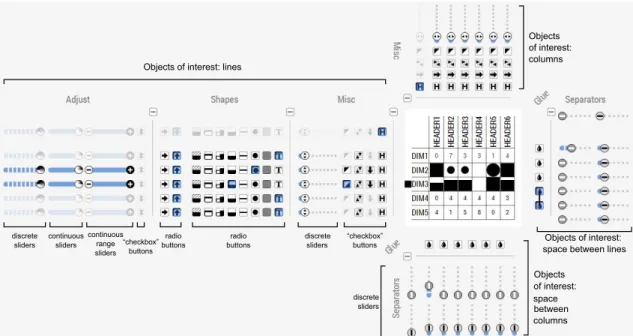
Objects of interest: lines Objects of interest: space between columns Objects of interest: columns Objects of interest: space between lines
discrete sliders continuous sliders continuous range sliders “checkbox” buttons radio buttons radio buttons discrete sliders “checkbox” buttons discrete sliders
Figure 1. The Bertifier interface with crossets laid out around the table.
CROSSETS FOR BERTIFIER
In Bertifier (see Figure 1), Crossets are placed next to rows and columns, and make it possible to perform actions on arbitrary groups of adjacent rows and columns.
UI Guidelines recommend avoiding too many wid-gets [12]. However, the multiplication of Crossets is a strength of Bertifier. Indeed, it deals with the challenge of applying an action on several objects of interest by one unique interaction [7]. Moreover, applying actions does not require to specify the selection in advance which is made on-the-fly—as opposed to the traditional selection-action sequential approach, and the gesture’s reversibility makes the system tolerant to errors.
As Crossets are aligned with their target row or column, their spatial offset is null according to one of the two di-mensions of the space. Thus, their spatial indirectness [3] is lower than widgets not designed to be aligned with the objects of interest and far from them.
The selection of objects of interest and the manipulation of values are performed in a unique gesture with imme-diate feedback [11, 8], and the actions are instantaneously applied to the objects of interest. Thus, Crossets minimize temporal indirectness [3] and articulatory distance [8]. Designing an entire interface involves tradeoffs, and in-ternal consistency can conflict with the degree of compat-ibility [3] of some Crossets. For example, to modify the width of a column, the user has to drag the slider thumb up and down while a horizontal dragging would be more cognitively congruent.
A recognized challenge of direct manipulation interfaces is targeting invisible objects [7]. Crossets must be visible in the viewport to be reachable, which may be a problem when the table is too large (Bertifier reaches its limits for tables larger than 1000 cells), requiring to perform several gestures coupled with page scrolling. However, zooming out solves the problem in most cases.
CONCLUSION
Bertifier is a semi-automatic approach for reordering ma-trices based on visual reordering. Bertifier leverages recent advances in HCI—crossing interaction—to apply actions on multiple rows and columns in a single ges-ture, avoiding the standard selection–action sequential approach. Bertifier resurrects an ancient and forgotten method and we believe it will finally democratize Bertin’s work, while many previous attempts failed before. The tool is designed to be accessible to a wide range of users, from researchers—for communicating experimental re-sults to school pupils—for learning by manipulation, and we believe it has a high pedagogical value. Some teachers and students from a French University already use it dur-ing a class, and we hope it is the sign of a wider adoption.
BIBLIOGRAPHY
1. Accot J. & Zhai S. More than dotting the i’s — foundations for crossing-based interfaces. In Proc. CHI ’02, ACM (2002), 73–80. 2. Appert C. & Fekete J.-D. Orthozoom scroller: 1d multi-scale
navigation. In Proc. CHI ’06, ACM (2006), 21–30. 3. Beaudouin-Lafon M. Instrumental interaction: An interaction
model for designing post-wimp user interfaces. In Proc. CHI ’00, ACM (2000), 446–453.
4. Bertin J. La graphique et le traitement graphique de l’information. Nouvelle bibliothèque scientifique. Flammarion, 1975.
5. Bertin J. Graphics and Graphic Information Processing. De Gruyter, Berlin, 1981. Translation: William J. Berg, Paul Scott. 6. Fekete J. The infovis toolkit. In INFOVIS ’04 (2004), 167–174. 7. Frohlich D. M. Direct manipulation and other lessons. In Handbook
of human-computer interaction (2nd ed), Elsevier (1997), 463–488. 8. Hutchins E. L., Hollan J. D. & Norman D. A. Direct manipulation
interfaces. Hum.-Comput. Interact. 1, 4 (1985), 311–338. 9. Perin C. & Dragicevic P. Manipulation de Sliders Multiples par
Franchissement. 26th French Speaking Conference on Human-Computer Interaction(2014).
10. Perin C., Dragicevic P. & Fekete J. Revisiting bertin matrices: New interactions for crafting tabular visualizations. TVCG (2014). 11. Shneiderman B. Direct manipulation: A step beyond programming
languages. Computer 16, 8 (1983), 57–69.
12. Van Dam A. Post-wimp user interfaces. Commun. ACM 40, 2 (1997), 63–67.