HAL Id: hal-00298837
https://hal.archives-ouvertes.fr/hal-00298837
Submitted on 4 Jun 2007HAL is a multi-disciplinary open access
archive for the deposit and dissemination of sci-entific research documents, whether they are pub-lished or not. The documents may come from teaching and research institutions in France or abroad, or from public or private research centers.
L’archive ouverte pluridisciplinaire HAL, est destinée au dépôt et à la diffusion de documents scientifiques de niveau recherche, publiés ou non, émanant des établissements d’enseignement et de recherche français ou étrangers, des laboratoires publics ou privés.
GIBSI: an integrated modelling system for watershed
management ? sample applications and current
developments
R. Quilbé, A. N. Rousseau
To cite this version:
R. Quilbé, A. N. Rousseau. GIBSI: an integrated modelling system for watershed management ? sample applications and current developments. Hydrology and Earth System Sciences Discussions, European Geosciences Union, 2007, 4 (3), pp.1301-1335. �hal-00298837�
HESSD
4, 1301–1335, 2007
Applications and developments of
GIBSI
R. Quilb ´e and A. N. Rousseau Title Page Abstract Introduction Conclusions References Tables Figures ◭ ◮ ◭ ◮ Back Close
Full Screen / Esc
Printer-friendly Version
Interactive Discussion
Hydrol. Earth Syst. Sci. Discuss., 4, 1301–1335, 2007 www.hydrol-earth-syst-sci-discuss.net/4/1301/2007/ © Author(s) 2007. This work is licensed
under a Creative Commons License.
Hydrology and Earth System Sciences Discussions
Papers published in Hydrology and Earth System Sciences Discussions are under open-access review for the journal Hydrology and Earth System Sciences
GIBSI: an integrated modelling system for
watershed management – sample
applications and current developments
R. Quilb ´e and A. N. Rousseau
Institut National de la Recherche Scientifique – Centre Eau, Terre et Environnement
(INRS-ETE), Universit ´e du Qu ´ebec, 490 rue de la Couronne, Qu ´ebec (QC), G1K 9A9, Canada Received: 2 February 2007 – Accepted: 20 March 2007 – Published: 4 June 2007
Correspondence to: A. N. Rousseau ([email protected])
HESSD
4, 1301–1335, 2007
Applications and developments of
GIBSI
R. Quilb ´e and A. N. Rousseau Title Page Abstract Introduction Conclusions References Tables Figures ◭ ◮ ◭ ◮ Back Close
Full Screen / Esc
Printer-friendly Version
Interactive Discussion
Abstract
Hydrological and pollutant fate models have long been developed for research pur-poses. Today, they find an application in integrated watershed management, as deci-sion support systems (DSS). GIBSI is such a DSS designed to assist stakeholders in watershed management. It includes a watershed database coupled to a GIS and ac-5
cessible through a user-friendly interface, as well as modelling tools that simulate, on a daily time step, hydrological processes, soil erosion, agricultural pollutant transport and surface water quality. Therefore, GIBSI can be used to assess a priori the effect of management scenarios (reservoirs, land use, waste water effluents, diffuse sources of pollution that is agricultural pollution) on surface hydrology and water quality. For 10
illustration purposes, this paper presents several management-oriented applications using GIBSI on the 6680 km2 Chaudi `ere River watershed, located near Quebec City (Canada). They include impact assessments of: (i) timber harvesting; (ii) municipal clean water program; (iii) agricultural nutrient management scenarios; (iv) past land use evolution; (v) possible future agricultural land use evolution under climate change, 15
as well as (vi) determination of achievable performance standards of pesticides man-agement practices. Current and future developments of GIBSI are also presented as these will extend current uses of this tool and make it useable and applicable by stakeholders on other watersheds. Finally, the conclusion emphasizes some of the challenges that remain for a better use of DSS in integrated watershed management. 20
1 Introduction
Integrated water management at the watershed scale has become a priority in many countries all over the world. For instance, the U.S. Clean Water Act (see Clements et al., 1996; Gari ´epy et al., 2006) and the European Directive Framework (Official Jour-nal of the European Community, 2000) impose specific objectives in terms of water 25
resources integrity and have led to the creation of numerous watershed organisations 1302
HESSD
4, 1301–1335, 2007
Applications and developments of
GIBSI
R. Quilb ´e and A. N. Rousseau Title Page Abstract Introduction Conclusions References Tables Figures ◭ ◮ ◭ ◮ Back Close
Full Screen / Esc
Printer-friendly Version
Interactive Discussion
that try to apply integrated management principles. These principles basically consist in conciliating all land and water uses while protecting and sustaining water resources. This relies on the involvement of stakeholders and the definition of operating rules. To facilitate the decision making process, there is a need for high quality and accessible data. In this context, scientific research has shifted towards the development of de-5
cision support systems (DSS) designed to support the implementation of integrated water management. DSS are practical and user-friendly computer tools that basically rely on a geographical information system (GIS) and a relational database manage-ment system (RDBMS) that enable the display of information at any point in space and time, as well as transforming raw data into information relevant to the decision making 10
process (graphs, maps or tables). Most DSS are based on mathematical models and can be used to assess a priori the effect of watershed management scenarios regard-ing urban, forestry or agricultural issues, on water yield and quality at the watershed scale. Many DSS have been developed all over the world, suited for specific condi-tions, scales and purposes. Borah and Bera (2004) as well as Rousseau et al. (2005), 15
to name a few, reviewed and compared some DSS. For instance, while some of them are more suited for urban water management, others are specifically developed to as-sess the effect of agricultural practices on hydrology. Even if most of them are still under development and regularly upgraded, their development is now advanced enough to envision concrete applications for water management purpose (e.g. see Borah and 20
Bera, 2004; He, 2003; Rousseau et al., 2005; Santhi et al., 2001).
As an illustration of the structure, development and possible applications of a DSS, this paper focuses on GIBSI (Gestion Int ´egr ´ee des Bassins Versants `a l’aide d’un Syst `eme Informatis ´e), a Canadian DSS that was originally developed to assist sci-entists and stakeholders in integrated water management. The development of GIBSI 25
began in 1995 and a first version was released in 1998 (Villeneuve et al., 1998a). A general description is presented in Sect. 2. Since then, several application studies have been conducted and some of them are briefly described in Sect. 3. At the same time, this integrated modelling system (IMS) has been continually upgraded by addition
HESSD
4, 1301–1335, 2007
Applications and developments of
GIBSI
R. Quilb ´e and A. N. Rousseau Title Page Abstract Introduction Conclusions References Tables Figures ◭ ◮ ◭ ◮ Back Close
Full Screen / Esc
Printer-friendly Version
Interactive Discussion
of new models, data post-processing modules or model calibration guidelines. This is presented in Sect. 4.
2 General description of GIBSI
GIBSI is designed to help stakeholders to make decisions in water management at the watershed scale. It can either be used as a data management system or as an impact 5
assessment tool to study the effect of management scenarios on surface water quality using mathematical models. The general structure of GIBSI is depicted on Fig. 1. A detailed presentation of each component may be found in Villeneuve et al. (1998a). 2.1 Data management modules
As most DSS, GIBSI is basically composed of a database, a GIS, a RDBMS and a 10
graphical user interface or GUI (Fig. 2). Attribute data were originally managed us-ing Microsoft Access ™ (Simpson, 1994) but this RDBMS has now been replaced by the MySQL® database management system (Pedersen et al., 2005). The database contains spatial data (e.g. location of meteorological stations) and attribute data (i.e., all data associated with spatial data, such as meteorological series). The GIS used 15
is GRASSLAND (L.A.S., 1996). The watershed is discretized into two types of com-putational elements: (i) river segments that is, one-dimensional elements that support watercourse simulation processes (i.e. streamflow and pollutant transport); and (ii) rel-atively homogeneous hydrological units (RHHUs) that is, elements corresponding to elementary watersheds that support all the other simulation processes (i.e. runoff gen-20
eration and sediment and pollutant transport). These computational elements are de-termined using PHYSITEL (Turcotte et al., 2001), a complementary software program designed specifically to prepare the physiographic database of distributed hydrological models.
HESSD
4, 1301–1335, 2007
Applications and developments of
GIBSI
R. Quilb ´e and A. N. Rousseau Title Page Abstract Introduction Conclusions References Tables Figures ◭ ◮ ◭ ◮ Back Close
Full Screen / Esc
Printer-friendly Version
Interactive Discussion
2.2 Scenarios management modules
Four types of management scenarios can be defined:
(i) Reservoirs: addition of new reservoirs at any river segment or editing of their characteristics;
(ii) Agriculture : editing of crop types, nutrient management practices, pesticide treat-5
ments, dates of agricultural practices, at any spatial scale (i.e., one or many RHHUs, subwatersheds or administrative units such as municipalities);
(iii) Wastewater treatment plants: addition of new plants at any river segment or edit-ing of their characteristics (e.g., treatment types, effluent rates);
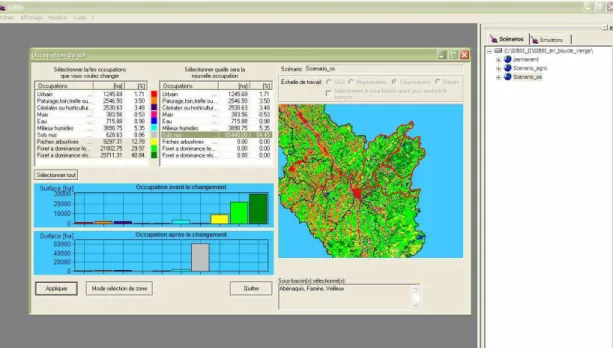
(iv) Land use: change of a land use class to another one at any spatial scale (Fig. 2). 10
Once scenarios are defined, there are integrated into the database and simulations can be run.
2.3 Simulation modules
GIBSI simulates hydrology, erosion, pollutant transport and surface water quality. It is based on four existing semi-distributed models: (i) HYDROTEL (Fortin et al., 2001a; 15
Fortin et al., 1995), a physically-based, hydrological model compatible with GIS and remote sensing; (ii) RUSLE (Renard et al., 1997; Wischmeier and Smith, 1978) com-plemented by Yalin’s equation (Yalin, 1963) to account for soil erosion and sediment transport capacity; (iii) SWAT (Arnold et al., 1996) and EPIC algorithms (Arnold and Williams, 1995) to simulate the fate of nitrogen, phosphorus and pesticides on crop-20
land; (iv) QUAL2E (Brown and Barnwell, 1987) a water quality model that simulates the biological, physical and chemical processes controlling the fate of pollutants in surface water. The modeling time step is the day. Input data are daily meteorological series (precipitations, minimum temperature and maximum temperature). The user selects
HESSD
4, 1301–1335, 2007
Applications and developments of
GIBSI
R. Quilb ´e and A. N. Rousseau Title Page Abstract Introduction Conclusions References Tables Figures ◭ ◮ ◭ ◮ Back Close
Full Screen / Esc
Printer-friendly Version
Interactive Discussion
the meteorological series, either by defining dates of start and end into the meteoro-logical database, or by selecting characteristic series (e.g., dry summer or wet spring). 2.4 Post-processing tools
Tools have been developed to analyse simulation results. First, data can be visual-ized using tables, graphs or maps. Regarding pollutant concentrations data, the fre-5
quency of exceeding a water quality standard can be calculated or visualised using graphs, which is useful when simulations concern the effect of management practices on specific water uses such as swimming or drinking water. Finally, an environmental benefit-cost analysis can be performed for agricultural scenarios based on the cost of implementation of agricultural beneficial management practices and the environmental 10
benefits from recovering potential water uses due to water quality improvement (see Salvano et al., 2004).
3 Applications of GIBSI
Several applications of GIBSI have been performed since the first version was released in 1998. The aim of this paper is not to describe all of them in detail but rather to 15
provide an overview that illustrates the range of possibilities and limitations of use. All of these applications have been performed on the Chaudi `ere River watershed or sub-watersheds.
3.1 The Chaudi `ere River watershed
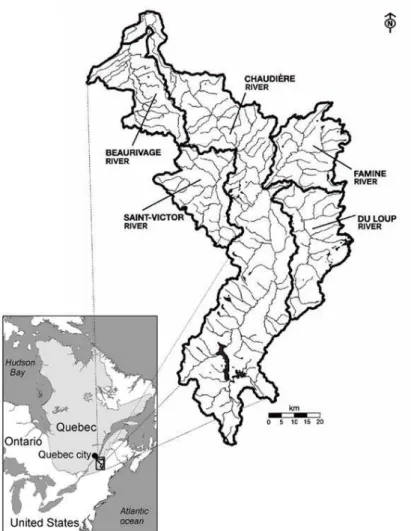
The Chaudi `ere River is a tributary of the Saint-Lawrence River, located south of 20
Qu ´ebec City (Fig. 3). It drains a watershed of 6680 km2, mainly forested (64%) and used for agriculture (33%). This watershed was selected for the application and de-velopment of GIBSI due to the variety of land uses, agricultural and industrial activi-ties, available data and because it is representative of many watersheds in the
HESSD
4, 1301–1335, 2007
Applications and developments of
GIBSI
R. Quilb ´e and A. N. Rousseau Title Page Abstract Introduction Conclusions References Tables Figures ◭ ◮ ◭ ◮ Back Close
Full Screen / Esc
Printer-friendly Version
Interactive Discussion
Lawrence valley. Soils vary from loamy sand in the downstream portion of the water-shed to clay loam in the middle portion and loam in the upstream portion (Duchemin et al., 2001). Agriculture is dominated by animal production, especially pig and dairy farming. That implies that most of the cropland is dedicated to forages and pasture (75% of agricultural land in 1995). It is also important to note that it was identified by 5
the Qu ´ebec government as the pilot watershed for the implementation of integrated watershed water management in 1993. The population is now around 180 000 inhabi-tants. Meteorological data come from forty stations distributed all over the watershed.
Calibration of the hydrological model HYDROTEL was performed on the whole water-shed (Fortin et al., 2001b) considering measured and simulated streamflows at the out-10
let. The model efficiency was satisfactory with Nash-Sutcliffe coefficients of 0.88 and 0.83 for 1989–1990 and 1993–1994, respectively. Spatial validation was performed for the Famine and Beaurivage subwatersheds with similar results. A temporal validation was also performed on 1987–1988 and 1990–1991 as well as over a 10-year period. A first calibration of the erosion model was performed in 2002 (unpublished). Regarding 15
the nutrient transport and water quality model, Villeneuve et al. (1998b) compared sim-ulated nitrate and phosphorus concentrations to measured data and found that errors were, in majority, less than 0.1 mgN/L and 0.01 mgP/L respectively. Results were less satisfactory for BOD5. Note that improvements and further calibration of these models are in progress (see Sect. 3.1).
20
3.2 Effect of timber harvesting on watershed hydrology 3.2.1 Context, objectives and general approach
The objective of this study (Lavigne et al., 2004) was to characterize the ability of GIBSI to simulate the impact of deforestation on the hydrological regime of the Famine River watershed, a subwatershed of the Chaudi `ere River covering an area of 728 km2. It is 25
mostly forested, 30% in deciduous forest and 41% in coniferous forest.
HESSD
4, 1301–1335, 2007
Applications and developments of
GIBSI
R. Quilb ´e and A. N. Rousseau Title Page Abstract Introduction Conclusions References Tables Figures ◭ ◮ ◭ ◮ Back Close
Full Screen / Esc
Printer-friendly Version
Interactive Discussion
3.2.2 Scenarios and simulations
Two scenarios were considered and compared: the basic scenario (BS) consisted in the 1995 land use, while the deforestation scenario (DS) involved a drastical change of forest into bare land. By this way, the bare soil class increased from 1% to 72% of the total area of the watershed. Thirty-one simulations were performed with meteoro-5
logical daily time series from 1964 to 1995 as input data, each year being considered independently. This was done for each scenario.
3.2.3 Results
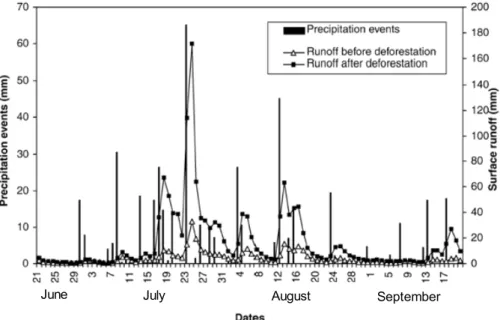
The results showed an increase in annual runoff (+57%), spring runoff (+25%) and summer runoff (+138%) after deforestation. For summer low-flow periods, GIBSI sim-10
ulated an average increase in runoff of 102%. The spring peak flow was also affected, the median value shifting from 201 to 259 m3s−1 (+26%), as well as the summer peak flow (increase of 74 m3s−1, +101%). As an illustration, Fig. 4 shows the increase in the summer runoff using the 1995 meteorological series. The runoff response to these precipitation events for DS scenario is larger than for BS scenario, especially between 15
11 July and 30 August. For the precipitation event of 22 July, runoff response simulated by GIBSI occurred 2 days after the precipitation event (65 mm) with a runoff increase of 135 mm between the two scenarios. These results confirm the fact that deforesta-tion has a great effect on runoff during summer. These changes were consistent with observations from experimental paired watersheds studies found in literature, show-20
ing that GIBSI could complement field studies for land management planning on large scale watersheds with respect to surface water resources.
HESSD
4, 1301–1335, 2007
Applications and developments of
GIBSI
R. Quilb ´e and A. N. Rousseau Title Page Abstract Introduction Conclusions References Tables Figures ◭ ◮ ◭ ◮ Back Close
Full Screen / Esc
Printer-friendly Version
Interactive Discussion
3.3 Impact of municipal clean water program 3.3.1 Context, objectives and general approach
In 1978, a provincial municipal clean water program (MCWP) was implemented in Qu ´ebec to control point-source pollution and restore the province’s surface water qual-ity. On the Chaudi `ere River watershed, 35 waste water treatment plants (WWTP) were 5
built and the population being connected reached 95% in 1997. The objective of this study (Mailhot et al., 2002) was to assess the effect of this program on water quality. The first step was to characterize WWTP properties (i.e. affluent and effluent water dis-charge, chemical and physical parameters). Pollutant loads from industrial plants not connected to a municipal sewer network as well as diffuse sources of pollution from 10
urban area or agricultural land were not considered in this study. 3.3.2 Scenarios and simulations
Two scenarios were defined in GIBSI: the first one was associated with the 1983 year corresponding to the pre-MCWP period, and the second one was associated with the 1994 year describing the post-MCWP period. Simulations were performed with both 15
scenarios using meteorological data of years 1983 (dry year) and 1994 (wet year) – two simulations for each scenario.
3.3.3 Results
Simulations results showed that the annual probability of exceeding phosphorus water quality standards (WQSs) at the watershed outlet decreased from 0.53 to 0.40 after 20
MCWP, under 1994 meteorological conditions (wet year). That corresponds to a gain of 49 days under the phosphorus WQS. The results are similar under dry conditions (1983 series), even if phosphorus concentrations remain almost always larger than the WQS during summer, and at the other control points on the watershed. Regarding biological oxygen demand (BOD5), in the year before MCWP the WQS was usually exceeded 25
HESSD
4, 1301–1335, 2007
Applications and developments of
GIBSI
R. Quilb ´e and A. N. Rousseau Title Page Abstract Introduction Conclusions References Tables Figures ◭ ◮ ◭ ◮ Back Close
Full Screen / Esc
Printer-friendly Version
Interactive Discussion
during several days, however, after MCWP the standard was never exceeded, neither under wet nor dry conditions. Finally, we observed a decrease in median concentration but the concentrations were always smaller than the WQS, even before MCWP. We can conclude from this study that MCWP had a drastic effect on BOD5 and phosphorus but that urban wastewater is still responsible for high probabilities of exceeding phosphorus 5
WQS in the Chaudi `ere River.
3.4 Determination of environmental load allocations from point and diffuse sources 3.4.1 Context, objectives and general approach
This study (Rousseau et al., 2002a, b) consisted in assessing the contribution of pol-lutant loads associated with wet (non-point source or diffuse) and dry (point source) 10
weather to water pollution. The objective was also to set environmental load alloca-tions (ELAs) or total maximum daily loads (TMDLs) regarding various human activities and water uses, and to determine whether WQSs were achievable. If ELAs from point sources are generally well established based on severe low flows and maximum daily loads, it is not as easy for diffuse sources since they occur during important runoff 15
events and strongly depend on land use and agricultural management practices. Un-treated municipal wastewater from a small town (St. Martin) and non-point source pol-lution were responsible for impairment of the studied river segment located upstream of Sartigan dam which is a place for recreational activities. Pollutants considered were fecal coliforms for bacteriological considerations and phosphorus for aesthetic require-20
ments (eutrophication).
3.4.2 Scenarios and simulations
Based on WQSs, environmental load allocations were calculated for both point and non-point sources, resulting in 7.5 1011 UFC/day and 4.35 kgP/day for low flow condi-tions. Two base case scenarios were defined considering only point source pollution or 25
HESSD
4, 1301–1335, 2007
Applications and developments of
GIBSI
R. Quilb ´e and A. N. Rousseau Title Page Abstract Introduction Conclusions References Tables Figures ◭ ◮ ◭ ◮ Back Close
Full Screen / Esc
Printer-friendly Version
Interactive Discussion
both point-source and non-point source pollution. Then, three management scenarios were defined considering: (i) the construction of a WWTP at St. Martin; (ii) the reduc-tion of fertilizareduc-tion rate (from 31 to 13 kgP/ha) by meeting crop requirements for only phosphorus; and (iii) both changes. The simulations were performed using four years (1982–1985) of meteorological data including wet and dry weather years.
5
3.4.3 Results
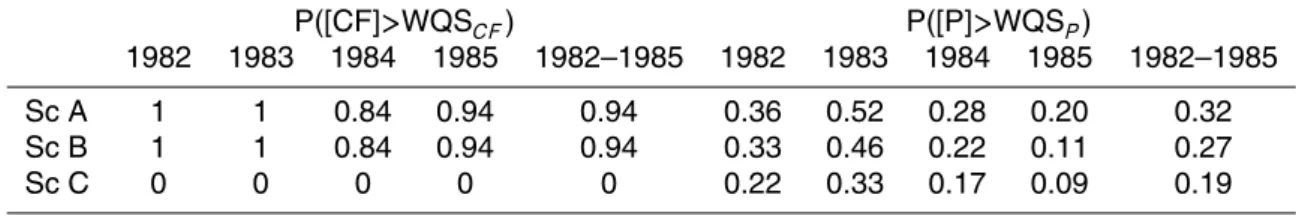
As shown on Table 1, the bacteriological WQS was always exceeded more than 84% of the time without the WWTP, but the WWTP reduced this frequency to 0%. Mean-while, the reduction of the phosphorous fertilization rate resulted in an improvement of water quality as the average probability of exceeding the phosphorus WQS over 10
the five year period dropped from 0.32 to 0.27. This probability was further lowered to 0.19 in the case of the implementation of the St. Martin WWTP. These simulation results also enabled to quantify the contribution of point versus non-point sources for phosphorus loads, which varied dramatically from wet to dry weather conditions: dry weather sources (i.e. urban wastewater) accounted for 63% of the phosphorus loads 15
during the driest summer, and for 12% to 19% for the other summers. This study clearly illustrated how the proposed approach based on probability of exceeding WQSs is well suited to characterise ELAs for various human activities.
3.5 Environmental benefit-cost analysis of manure management 3.5.1 Context, objectives and general approach
20
This study (Salvano et al., 2004, 2006) illustrates the importance of valuing environ-mental benefits associated with an improvement of water quality when assessing and implementing new agricultural nutrient management plans. In the province of Qu ´ebec, the Qu ´ebec Regulation Respecting Agricultural Operations (RRAO) was implemented in 2002 (and modified in 2005) to ensure the protection of water and soil, as well as 25
HESSD
4, 1301–1335, 2007
Applications and developments of
GIBSI
R. Quilb ´e and A. N. Rousseau Title Page Abstract Introduction Conclusions References Tables Figures ◭ ◮ ◭ ◮ Back Close
Full Screen / Esc
Printer-friendly Version
Interactive Discussion
aquatic life and human health from agricultural pollution. The rationale behind this reg-ulation is to reach a balance between the soil’s phosphorus support capacity and the amount of fertilizers. The objective of this study was to evaluate potential benefits gen-erated from water quality improvements within a benefit/cost analysis framework. As most of human services provided by water are not priced in markets, their economic 5
values first have to be estimated using non-market methods. In this case, a benefit transfer procedure was used (see Salvano et al., 2004, 2006 for details). As a first approximation, only the monetary benefits associated with water-based recreational activities were evaluated. First, willingness-to-pay and participation data (number of persons and days per person) were determined based on a survey from Environment 10
Canada (Environment Canada, 2001). Then, the number of days exceeding the phos-phorus aesthetic WQS obtained from simulations were used to calculate the total ben-efit of the management scenario.
3.5.2 Scenarios and simulations
This application concerned the Beaurivage River watershed (tributary of the Chaudi `ere 15
River) on which numerous river segments were identified for existing or potential recre-ational activities (swimming, canoeing, kayaking, hiking). Two scenarios were defined: (i) a base case scenario assuming application of all available manure; and (ii) an on-farm nutrient management scenario based on meeting phosphorus crop requirements with manure and treating any manure surpluses (so called RROA scenario). The cost 20
associated with the implementation of this manure management practice was calcu-lated based on livestock production costs and revenues, manure storage and treat-ment costs, and fertilization costs for a spatial unit, as compared to the base case scenario. A reduction of benefit is considered as an opportunity cost that is added to other costs. Total cost was then obtained by multiplying the unit cost by cropland 25
area within management units of interest. Two types of spatial management units were considered to evaluate and compare the effect of these scenarios: a group of three contiguous municipalities and two subwatersheds corresponding to two river segments
HESSD
4, 1301–1335, 2007
Applications and developments of
GIBSI
R. Quilb ´e and A. N. Rousseau Title Page Abstract Introduction Conclusions References Tables Figures ◭ ◮ ◭ ◮ Back Close
Full Screen / Esc
Printer-friendly Version
Interactive Discussion
of the Beaurivage River watershed with existing or potential water uses. As the prime period for recreational activities is the summer, simulations were performed using sum-mer meteorological data for years 1977 through 1986 independently.
3.5.3 Results
Simulations with the management scenario induced an increase of the number of days 5
of potential activities (i.e. for which phosphorus concentration is lower than phosphorus aesthetic WQS) as compared to the base-case scenario, for the two river segments and the three management units (between 248 and 499 days vs. 213 days for base case scenario). The results of the environmental benefit-cost analysis are given in Table 2. We can see that benefits were similar for all management units but that costs were 10
higher when implementing the scenario at the scale of the municipalities. This results in higher benefit-cost ratios, especially for the upstream river segment, due to the fact that it focuses on a problematic area. Note that all benefit-cost ratios were smaller than one, but a sensitivity analysis showed that this ratio could be larger than one when reducing manure treatment costs, which is technically achievable. However, this methodology 15
does not take into account intrinsic values that would certainly increase the ratios. The development of the proposed environmental benefit-cost analysis methodology represents a first step towards the estimation of all monetary benefits of improving water quality.
3.6 Influence of past land use evolution on hydrological regime 20
3.6.1 Context, objectives and general approach
As illustrated in Sect. 3.2, watershed hydrology is highly sensitive to land use. For instance, clear-cutting induces an increase in water discharge and peak flows. In gen-eral, land use all over the world has evolved a lot over the last decades, and it is important to understand and quantify the influence of these changes on hydrology in 25
HESSD
4, 1301–1335, 2007
Applications and developments of
GIBSI
R. Quilb ´e and A. N. Rousseau Title Page Abstract Introduction Conclusions References Tables Figures ◭ ◮ ◭ ◮ Back Close
Full Screen / Esc
Printer-friendly Version
Interactive Discussion
the past to be able to anticipate the future. This is the objective of this study based on the application of GIBSI in the Chaudi `ere River watershed (Savary et al., 20071). 3.6.2 Scenarios and simulations
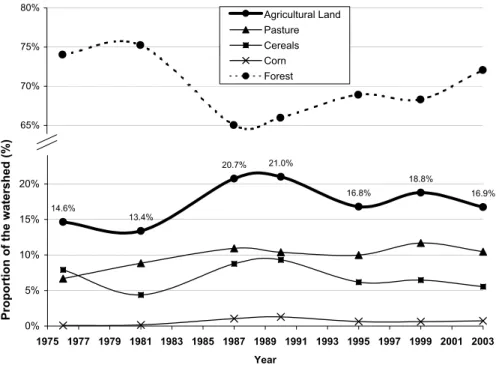
Seven satellite images (Landsat) were acquired to reconfigure the evolution of land use over the last 30 years (1976, 1981, 1987, 1990, 1995, 1999, 2004). After treatment and 5
classification, the evolution of land use was quantified (Fig. 5). Agriculture and forest (including bush land) followed opposite tendencies, with an increase in agricultural land in the seventies, stagnation in the eighties and a decrease in the nineties. The seven images were integrated into the GIBSI database. For each land use configuration, simulations were run using 30 years of meteorological data (1970–1999), each year 10
being considered independently. 3.6.3 Results
The mean annual water discharge, as well as critical low flow sequences (Q2-7, Q10-7 and Q5-30), were strongly correlated with agricultural land use evolution, with deter-mination coefficients of 0.97, 0.95, 0.92 and 0.93, respectively. This can be explained 15
by the fact that the increase in agricultural land to the detriment of forest induces less evapotranspiration, and thus more available water for overall runoff. This is taken into account by the hydrological model of GIBSI by the mean of the leaf area index and the root depth in the water balance calculation. Moreover, soil surface is more likely to produce faster runoff (translated in the model by a lower Manning coefficient in the 20
calculation of surface water routing). These results show that the water regime of a river is strongly dependent on the evolution of the watershed land use and illustrate how a DSS like GIBSI enables to quantify this influence.
1
Savary, S., Garbouj, M. S., Rousseau, A. N., and Quilb ´e, R.: Impact of land use changes on the hydrology of the Chaudi `ere River watershed, in preparation, 2007.
HESSD
4, 1301–1335, 2007
Applications and developments of
GIBSI
R. Quilb ´e and A. N. Rousseau Title Page Abstract Introduction Conclusions References Tables Figures ◭ ◮ ◭ ◮ Back Close
Full Screen / Esc
Printer-friendly Version
Interactive Discussion
3.7 Influence of future land use evolution on hydrological regime and water quality in a context of climate change
3.7.1 Context, objectives and general approach
To complement the previous study, Quilb ´e et al. (2007) have assessed the effect of future land use evolution scenarios under climate change conditions. To do so, the first 5
step was to determine future meteorological sequences that would be used as input data in GIBSI. Three methods were used, based on general circulation models (GCM): delta method, statistical downscaling and a mix of both. Three GCMs were considered for the delta method and only one for the statistical downscaling method. Several gas emission scenarios (GES) were also considered for each case.
10
3.7.2 Scenarios and simulations
Three land use scenarios were defined. First, the land use of 1995 was used as ref-erence. Secondly, scenario A was driven by economical criteria, by extrapolating the last decade tendency regarding pig production increase. This results in deforestation to create more agricultural fields for feed production and manure application. Finally, 15
scenario B considers the land use distribution as it was in 1976, implying reforesta-tion. It also considers a spatial dispersion of agricultural lands over the watershed. Simulations were run with each scenario over 30 years considered as independent, for reference period (1970–1999) and future period (2010–2039).
3.7.3 Results 20
The results first show that, without any modification in land use (base case scenario), climate change would induce a decrease of annual water discharge at the outlet of the watershed (mean of -2.7%, with delta method). However, this value can be very differ-ent from a GCM/GES combination to another (from –14.1% to +13.8%), pointing out the large uncertainties that are still linked to these methods. Water discharge would 25
HESSD
4, 1301–1335, 2007
Applications and developments of
GIBSI
R. Quilb ´e and A. N. Rousseau Title Page Abstract Introduction Conclusions References Tables Figures ◭ ◮ ◭ ◮ Back Close
Full Screen / Esc
Printer-friendly Version
Interactive Discussion
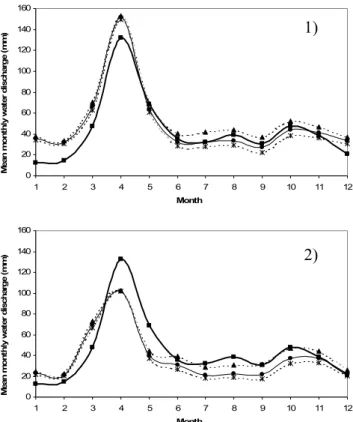
strongly increase in winter due to higher temperatures and earlier snow melt (on aver-age +68.5%), and decrease the rest of the year (Fig. 6). This effect is homogeneous within the thirty years of simulation, i.e. both for dry and wet years. Regarding the effect on spring peak flow, results are once again different from one GCM/GES combination to another with, on average, a decrease in peak flow. Finally it is not possible to con-5
clude to any tendency regarding summer low flow modification. When integrating land use evolution scenarios into GIBSI simulations, we obtained opposite effects between the two scenarios, with an increase and a decrease of water discharge in summer and fall, respectively. This is illustrated on Fig. 6 which shows the mean monthly wa-ter discharge obtained with GCM ECHAM4, GES A2 and the three land use scenarios 10
(base case, A and B). These results suggest that intensification of agriculture (Scenario A) would mitigate the effect of climate change in summer and fall by generating more runoff and thus higher streamflow in river. The results regarding the effects on sediment follow roughly the same trend as water discharge (see Quilb ´e et al., 2007). However, this prospective approach has many limitations due to the methodology. First, only 15
tendencies can be pointed out because of the large uncertainty linked to the method-ological approach and tools used. Moreover, even if statistical downscaling captures precipitation occurrence, it is weaker at predicting wet days amounts and extremes in our region (Gachon et al., 2005). Finally, the effect on water quality should be consid-ered before concluding about the good or bad effect of land use scenario.
20
3.8 Definition of achievable agroenvironmental performance standards for pesticides at the watershed scale
3.8.1 Context, objectives and general approach
The Canadian National Agri-Environmental Standards Initiative (NAESI) program aims to develop water quality standards at the watershed scale, in order to lead the devel-25
opment and application of benefical management practices (BMPs) at the farm scale. This includes: (i) ideal performance standards (IPSs) that are based on
HESSD
4, 1301–1335, 2007
Applications and developments of
GIBSI
R. Quilb ´e and A. N. Rousseau Title Page Abstract Introduction Conclusions References Tables Figures ◭ ◮ ◭ ◮ Back Close
Full Screen / Esc
Printer-friendly Version
Interactive Discussion
logical data and specify the desired level of environmental state needed to maintain ecosystem health, and (ii) achievable performance standards (APSs) which represent more realistic standards that could be achieved using recommended available pro-cesses, practices and technologies, including BMPs. This means that, to determine APSs, it is necessary to assess a priori the effect of several BMPs on water quality 5
by using a mathematical model that simulates the fate of pollutants at the watershed scale. This approach was first applied for pesticides. After a review and multicri-teria comparative analysis of existing pesticide fate models at the watershed scale, GIBSI was selected together with the SWAT and BASINS/HSPF models (Quilb ´e et al., 2006). Pesticide concentrations data as well as representative agricultural practices 10
were identified with a survey in the Beaurivage River watershed. However, due to the size of the area, it was impossible to identify precisely these practices at the farm scale. Therefore, a large uncertainty remains about the locations, dates and rates of pesticide applications. This uncertainty represents an important limitation for the calibration of the pesticide models. To account for this uncertainty during the simulations, a stochas-15
tic process was introduced in GIBSI to determine for each RHHU: (i) the year of crop rotation which determines the crop and thus what kind of pesticides are applied; and (ii) the date of application within the period of time defined. Then, several simulations with different stochastic configurations for crops and application dates provide a range of pesticide concentrations in surface water.
20
3.8.2 Scenarios and simulations
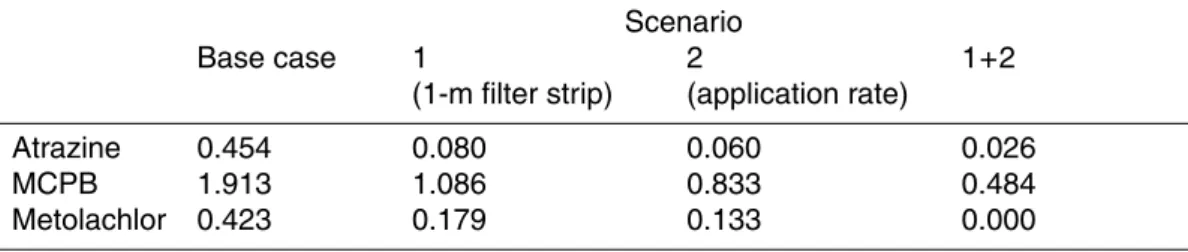
This study is described by Rousseau et al. (2007). A base case scenario was defined based on current agricultural practices. We considered that pesticides applications were done between 1 and 15 June (16 days). The application rates were 0.65, 0.06 and 1.6 kg/ha for Atrazine (on corn), MCPB (on cereals) and Metolachlor (on corn), re-25
spectively. Then three BMP scenarios were created based on this base case scenario: (1) implementation of a 1-m filter strip all along the river network; (2) a 30% reduc-tion in the pesticide applicareduc-tion rate; and (3) a combinareduc-tion of both. Simulareduc-tions were
HESSD
4, 1301–1335, 2007
Applications and developments of
GIBSI
R. Quilb ´e and A. N. Rousseau Title Page Abstract Introduction Conclusions References Tables Figures ◭ ◮ ◭ ◮ Back Close
Full Screen / Esc
Printer-friendly Version
Interactive Discussion
performed over thirty years (1979–1999), each year being considered independently. Three different stochastic configurations for crops spatial distribution and application dates were considered for each year, resulting in 90 simulations for each scenario. The effect of BMPs was examined at the outlet of the Beaurivage River subwatershed, which is the most affected by pesticide pollution.
5
3.8.3 Results
A cumulative frequency curve (CFC) of pesticide concentration was determined for the month of June since any pesticide level in the stream network beyond this month remains undetectable. These CFCs were based on thirty-year simulations and three stochastic configurations for each scenario. We proposed to define the 9th centile 10
(Q90) of this distribution as a possible value for APS. This means that this value is ex-ceeded only 10% of the time. The results show that this value decreases with the imple-mentation of BMPs (Table 3). For Atrazine, we observed a reduction of 81.7%, 85.8% and 91.9% for scenarios 1, 2 and 3. For MCPB, the effect is weaker with a decrease of 41.4%, 47.5% and 74.7% respectively. Finally, for Metolachlor, Q90 was reduced of 15
57.6%, 68.6% and 100%, respectively. It is noteworthy that all these concentrations values are all lower than the WQS for aquatic life protection (1.8 µg/L, 7.3 µg/L and 8 µg/L respectively for Atrazine, MCPB and Metolachlor; MDDEP, 2006). These results mean that the effect of BMPs on pesticides concentrations may be very different from one pesticide to another. It should be noted that the final APS value can be linked to 20
the ecotoxicologal impact by the use of a species sensitivity distribution (the one used for the determination of IPS) as a means to assess a priori the percentage of potentially affected species. Finally, this approach can be easily transposed to other pesticides and other rivers and watersheds. The study clearly shows the utility of tools like GIBSI to determine a priori the efficiency of management plans at the watershed scale and to 25
define APSs.
HESSD
4, 1301–1335, 2007
Applications and developments of
GIBSI
R. Quilb ´e and A. N. Rousseau Title Page Abstract Introduction Conclusions References Tables Figures ◭ ◮ ◭ ◮ Back Close
Full Screen / Esc
Printer-friendly Version
Interactive Discussion
4 Current and future developments of GIBSI
In parallel to these application studies, GIBSI has been continuously upgraded since the first version released in 1998. This concerned database management, interface, scenario management, post-processing tools and models.
4.1 Model development and calibration 5
Regarding models, only the calibration of the hydrological model has been reported in the literature (Fortin et al., 2001b). This explains why most of the applications pre-sented in this paper concern the effect of watershed management on water discharge. Regarding the pollutant transport models (erosion, nutrients, pesticides), an important work was performed to improve them over the last three years, and their thorough cal-10
ibration is currently in the process and results will be submitted for publication soon. Moreover, a pathogen transport model has been developed (Rogel, 2007). It simulates the fate of fecal coliforms resulting from manure application on crops as well as pasture, accounting for bacterial mortality, partitioning and transport in erosion and runoff.
Finally, an indicator of ecological integrity is currently under development (Grenier 15
et al., 2006b). Indeed, physical and chemical data are not sufficient to determine the quality of an aquatic medium. For instance, high nitrogen and phosphorus concentra-tions in a stream or a lake indicate a risk for eutrophication but do not give information on the real state of the aquatic environment, which depends on many other factors such as pH or dissolved oxygen. This indicator will be based on benthic diatoms and 20
macro-invertebrate communities. In a previous study (Grenier et al., 2006a), reference conditions of each stream type sampled in Southern Quebec (Canada) were defined using benthic diatoms and environmental variables characterizing streams and water-sheds (regional reference site approach). Two diatom reference communities were sufficient to define reference conditions, one for neutral conditions and one for alka-25
line conditions. Based on these results, classification tree models (prediction models) were created using reference sites to identify watershed characteristics responsible for
HESSD
4, 1301–1335, 2007
Applications and developments of
GIBSI
R. Quilb ´e and A. N. Rousseau Title Page Abstract Introduction Conclusions References Tables Figures ◭ ◮ ◭ ◮ Back Close
Full Screen / Esc
Printer-friendly Version
Interactive Discussion
the discrimination between the two reference communities (neutral and alkaline). The model was then used to predict which diatom reference community should be present in an impacted stream under potential natural conditions. The results from this study were used to develop a diatom-based index that can be used to evaluate the degra-dation status of a site by comparing the actual ecological conditions with appropriate 5
reference conditions. The same approach is now being applied for benthic macro-invertebrate communities. Finally, the developed models will be integrated into GIBSI to predict the structure of diatoms and macro-invertebrate communities in rivers based on simulated physical and chemical variables.
4.2 Development of an application protocol of GIBSI and implementation on other 10
watersheds
Until now, GIBSI has been developed and applied on only one watershed, i.e. the Chaudi `ere River. A user’s guide already exists (Villeneuve et al., 2003) but it only ex-plains how to use GIBSI once it is implemented. However, the implementation and application procedure of GIBSI, like many DSS, is still complex and follows several 15
steps that have to be done carefully, for example: identification of user’s needs, model selection, data acquisition, database construction, model adaptation if needed, model calibration, scenario definition, simulations and results analysis. Moreover, it should be always kept in mind that all models are based on simplification hypotheses that have to be considered in the end of the process, i.e. when interpreting the results and con-20
clusions. Therefore, in order to allow stakeholders to apply it on other watersheds, an application protocol is being developed, explaining the different steps to follow and giv-ing tools to clarify the procedure. It includes an inventory of needed data, a dictionary of the database and a guide on how to construct the database, discretize the water-shed, apply and calibrate the models. Moreover, these two documents (user’s guide 25
and application protocol) as well as the GUI will eventually be translated in English and Spanish.
Meanwhile, applications on other watersheds have already begun: GIBSI is now be-1320
HESSD
4, 1301–1335, 2007
Applications and developments of
GIBSI
R. Quilb ´e and A. N. Rousseau Title Page Abstract Introduction Conclusions References Tables Figures ◭ ◮ ◭ ◮ Back Close
Full Screen / Esc
Printer-friendly Version
Interactive Discussion
ing implemented on a Mexican watershed (Arcediano watershed, Santiago River) by the Instituto Mexicano de Tecnolog´ıa del Agua (IMTA). The objective is to improve wa-ter management on this wawa-tershed, in collaboration with the wawa-tershed management committee. Moreover, in the next two years GIBSI will be implemented on four water-sheds throughout Canada to determine APSs for pesticides (see Sect. 3.8): Yamaska 5
river (QC), Wilmot-Dunk (PEI), South Nations (ON) and Salmon Arm (CB).
5 Conclusions
The practical applications of GIBSI presented in this paper illustrate the wide range of possibilities offered by such a tool to assess the effect of land use management, wastewater treatment or agricultural practices on water quantity and quality at the wa-10
tershed scale. Current and future work involves addition and calibration of models as well as development of a water ecological integrity indicator. More generally, this demonstrates how a DSS like GIBSI may be used to incorporate sound science into legislative and political decisions regarding water management. However, the integra-tion and the use of a DSS like GIBSI for operaintegra-tional integrated watershed management 15
issues still face major challenges. One of them is that DSS are often too complex for operational purposes. Indeed, if stakeholders do need tools that are sound science based, they also need them to be easy to use, apply and understand. Thus, this re-quires a simplification as well as the development of tools and guides that facilitate the technical transfer from research to management, as it is being done for GIBSI. Also, 20
new concepts based on user needs and receptivity have to be investigated (see Jake-man and Letcher, 2003; McIntosh et al., 2007). Moreover, the uncertainty in model outputs has to be quantified to make the DSS more reliable and the decision making process easier (Mannina et al., 2006; Wu et al., 2006). Even so, it is clear that DSS ap-plication will always need a close dialogue between users and developers, i.e. between 25
stakeholders and scientists, within an interdisciplinary framework, and this is certainly one of the greatest interests of such tools.
HESSD
4, 1301–1335, 2007
Applications and developments of
GIBSI
R. Quilb ´e and A. N. Rousseau Title Page Abstract Introduction Conclusions References Tables Figures ◭ ◮ ◭ ◮ Back Close
Full Screen / Esc
Printer-friendly Version
Interactive Discussion
Acknowledgements. The development of GIBSI was funded by grants from the Qu ´ebec
Min-istry of Environment (1995–1998; 1999–2002) and the Fonds Qu ´eb ´ecois pour la Recherche et la Technologie (FQRNT, 2004–2007). The application on the influence of land use has been funded by Natural Resources Canada’s Climate Change Action Fund (CCAF) and OURANOS, a Qu ´ebec Research Consortium on Regional Climatology and Adaptation. The application
5
regarding development of APSs for pesticides is funded by Environment Canada and Centre Saint-Laurent. The authors would like to thank S. Savary, M. Grenier, G. Rogel, M.-P. Lavigne, S. Ricard, M. Slim Garbouj, J.-S. Moquet, S. Tremblay (INRS-ETE) and E. Salvano (University of Manitoba) for their contribution to this paper. Special thanks to A. Mailhot who has con-tributed from the start and to J.-P. Villeneuve who has initiated the development of GIBSI in
10
1995.
References
Arnold, J. G. and Williams, J. R.: The EPIC model, In: Singh, V. P. (Editor), Computer models of watershed hydrology. Water Resources Publications, Highlands Ranch, CO, 847–908, 1995. Arnold, J. G., Williams, J. R., Srinivasan, R., and King, K. W.: SWAT. Manual, USDA,
Agricul-15
tural Research Service and Blackland Research Center, Texas, 1996.
Borah, D. K. and Bera, M.: Watershed-scale hydrologic and nonpoint-source pollution models: review of applications, Transactions of the ASAE, 47(3), 789–803, 2004.
Brown, L. C. and Barnwell, T. O. J.: The enhanced stream water quality models QUAL2 and QUAL2E-UNCAS: Documentation and User Manual, Environmental Protection Agency,
20
Athens, Georgia, U.S., 1987.
Clements, J. T., Creager, C. S., Beach, A. R., Butcher, J. B., Marcus, M. D., and Schueler, T. R.: Framework for a watershed management program, Water Environment Research Foun-dation, Alexandria, 1996.
Duchemin, M., Rousseau, A. N., Lamontagne, L., and Villeneuve, J.-P.: Utilisation des
tech-25
nologies g ´eomatiques pour spatialiser le facteur K d’ ´erodabilit ´e des sols du bassin versant de la rivi `ere Chaudi `ere, Qu ´ebec, Canadian journal of soil science, 81, 423–437, 2001. Environment Canada: The importance of Nature to Canadians: The economic significance of
Nature-related activities, En 47-312/2000E, Federal-Provincial-Territorial Task Force for the Importance of Nature to Canadians, Ottawa, 2001.
30
HESSD
4, 1301–1335, 2007
Applications and developments of
GIBSI
R. Quilb ´e and A. N. Rousseau Title Page Abstract Introduction Conclusions References Tables Figures ◭ ◮ ◭ ◮ Back Close
Full Screen / Esc
Printer-friendly Version
Interactive Discussion
Fortin, J., Turcotte, R., Massicotte, S., Moussa, R., Fitzback, J., and Villeneuve, J. P.: A dis-tributed watershed model compatible with remote sensing and GIS data. Part I: Description of the model, J. Hydraulic Eng., 6(2), 91–99, 2001a.
Fortin, J. P., Moussa, R., Bocquillon, C., and Villeneuve, J. P.: Hydrotel, un mod `ele hydrologique distribu ´e pouvant b ´en ´eficier des donn ´ees fournies par la t ´el ´ed ´etection et les syst `emes
5
d’information g ´eographique, Revue des Sciences de l’Eau, 8(1), 97–124, 1995.
Fortin, J. P., Turcotte, R., Massicotte, S., Moussa, R., and Fitzback, J.: A distributed watershed model compatible with remote sensing and GIS data, part 2: Application to the Chaudi `ere watershed, J. Hydraulic Eng., 6(2), 100–108, 2001b.
Gachon, P., St-Hilaire, A., Ouarda, T., Nguyen, V. T. V., Lin, C., Milton, J., Chaumont, D.,
10
Goldstein, J., Hessami, M., Nguyen, T. D., Selva, F., Nadeau, M., Roy, P., Parishkura, D., Major, D., Choux, M., and Bourque, A.: A first evaluation of the strength and weaknesses of statistical downscaling methods for simulating extremes over various regions of eastern Canada, Final report, Sub-component, Climate Change Action Fund (CCAF), Environment Canada, Montr ´eal, Qu ´ebec, Canada, 2005.
15
Gari ´epy, S, Rousseau, A. N., and Brun, A.: La gestion de l’eau par bassin versant aux Etats-Unis: entre incitatifs l ´egislatifs et int ´er ˆets des usagers, in : Les politiques de l’eau, grands principes et r ´ealit ´ees locales, edited by: Brun, A. and Lasserre, F., Ed. PUQ, coll. G ´eographie contemporaine, 69–90, 2006.
Grenier, M., Campeau, S., Lavoie, I., Park, Y. S., and Lek, S.: Diatom reference
communi-20
ties in Qu ´ebec (Canada) streams based on Kohonen self-organizing maps and multivariate analyses, Can. J. Fisheries Aquatic Syst., 63, 2087–2106, 2006a.
Grenier, M., Campeau, S., and Rousseau, A. N. Establishing diatom reference communities in Quebec streams (Canada): ecological goals for stream restoration and baseline for eval-uation of aquatic ecosystem degradation status. Man and River Systems II – Interactions
25
among Rivers, their Watersheds, and the Socioecosyste. Extended abstracts – Interna-tional Symposium, Paris, December 4–6, 2006, Presses de l’ ´Ecole Nationale des Ponts et Chauss ´ees, 102–104, 2006b.
He, C.: Integration of geographic information systems and simulation model for watershed management, Environmental Modelling & Software, 18(8–9), 809–813, 2003.
30
Jakeman, A. J. and Letcher, R. A.: Integrated assessment and modelling: features, princi-ples and examprinci-ples for catchment management, Environ. Modell. Software, 18(6), 491–501, 2003.
HESSD
4, 1301–1335, 2007
Applications and developments of
GIBSI
R. Quilb ´e and A. N. Rousseau Title Page Abstract Introduction Conclusions References Tables Figures ◭ ◮ ◭ ◮ Back Close
Full Screen / Esc
Printer-friendly Version
Interactive Discussion
Logiciels et Applications Scientifiques Inc. (L.A.S.): Grassland User’s guide for Windows95 and Windows NT, Version 1.0, Montr ´eal, QC., 1996.
Lavigne, M. P., Rousseau, A. N., Turcotte, R., Laroche, A. M., Fortin, J. P., and Villeneuve, J. P.: Validation and use of a distributed hydrological modeling system to predict short term effects of clear cutting on the hydrological regime of a watershed, Earth Interactions, 8(3), 1–19,
5
2004.
Mailhot, A., Rousseau, A. N., Salvano, E., Turcotte, R., and Villeneuve, J. P.: ´Evaluation de l’impact de l’assainissement urbain sur la qualit ´e des eaux du bassin versant de la rivi `ere Chaudi `ere `a l’aide du syst `eme de mod ´elisation int ´egr ´ee GIBSI, Revue des Sciences de l’Eau, 15(Num ´ero sp ´ecial), 149–172, 2002.
10
Mannina, G., Freni, G., Viviani, G., Sægrov, S., and Hafskjold, L. S.: Integrated urban water modelling with uncertainty analysis, Water Sci. Technol., 379–386, 2006.
McIntosh, B. S., Seaton, R. A. F., and Jeffrey, P.: Tools to think with? Towards understanding the use of computer-based support tools in policy relevant research, Environ. Modell. Software, 22(5), 640–648, 2007.
15
MDDEP, M. d. D. D., de l’Environnement et des Parcs du Qu ´ebec:http://www.mddep.gouv.qc.
ca/eau/criteres eau/critere lmc.htm{#}mcpb, 2006
Official Journal of the European Community: Directive 200/60/EC of the European Parliament and of the Coucnil of 23 October establishing a framework for Community action in the field of water policy, OJ C L 327, 22.12.2000, 2000.
20
Pedersen, C., Dubois, P., and Hinz, C.: MySQL 5, Certification Study Guide. MySQL Press, 2005.
Quilb ´e, R., Rousseau, A. N., Lafrance, P., Leclerc, J. and Amrani, M.: Selecting a pesticide fate model at the watershed scale using a multi-criteria analysis, Water Quality Res. J. Can., 41(3), 283–295, 2006.
25
Quilb ´e, R., Rousseau, A. N., Savary, S., Ricard, S., Moquet, J.-S., and Garbouj, M. S.: Impact of historical and future land use on the hydrological regime of a Canadian watershed, Hydrol. Earth Syst. Sci. Discuss., in press, 2007.
Renard, K. G., Foster, G. R., Weesies, G. A., Mclood, D. K., and Yoder, D. C.: Predicting Soil Erosion by Water : A Guide to Conservation Planning with the Revised Universal Soil Loss
30
Equation (RUSLE), US Department of Agriculture, Washington, 1997.
Rogel, G.: D ´eveloppement et int ´egration au systme de mod ´elisation int ´egr ´e GIBSI d’un mo-dle de transport et du devenir d’agents pathog `enes d’origine agricole l’ ´echelle du bassin
HESSD
4, 1301–1335, 2007
Applications and developments of
GIBSI
R. Quilb ´e and A. N. Rousseau Title Page Abstract Introduction Conclusions References Tables Figures ◭ ◮ ◭ ◮ Back Close
Full Screen / Esc
Printer-friendly Version
Interactive Discussion
versant. Master Thesis in Water Science, INRS-ETE, University of Qu ´ebec, Qubec City, Canada, 2007.
Rousseau, A. N., Mailhot, A., Gari ´epy, S., Salvano, E., and Villeneuve, J. P.: Calcul de prob-abilit ´es de d ´epassement d’objectifs environnementaux de rejets de sources ponctuelle et diffuse `a l’aide du syst`eme de mod´elisation int´egr´ee GIBSI, Revue des Sciences de l’Eau,
5
15(Num ´ero sp ´ecial), 121–148, 2002a.
Rousseau, A. N., Mailhot, A., Quilb ´e, R., and Villeneuve, J. P.: Information technologies in a wider perspective: integrating management functions across the urban-rural interface, Envi-ron. Modell. Software, 20, 443–455, 2005.
Rousseau, A. N., Mailhot, A., and Villeneuve, J. P.: Development of a risk-based TMDL
as-10
sessment approach using the integrated modeling system GIBSI, Water Sci. Technol., 45(9), 317–324, 2002b.
Rousseau, A. N., Quilb ´e, R., Lafrance, P., Savary, S., Amrani, M., Caux, P.-Y., and Jiapizian, P.: A hydrological modelling framework for defining watershed-scale achievable performance standards of pesticides beneficial managements practices. Man and River Systems II –
In-15
teractions among Rivers, their Watersheds, and the Socioecosyste. Extended abstracts – International Symposium, Paris, December 4–6, 2006, Presses de l’ ´Ecole Nationale des Ponts et Chauss ´ees, 193–194, 2006b.
Salvano, E., Rousseau, A. N., Debailleul, G., and Villeneuve, J. P.: Development of a cost-benefit framework to evaluate the impact of legislation supporting reduction of agricultural
20
pollution at the watershed level, in: , Lake Champlain in Transition: Partnerships in Progress, edited by: Manley, T. O., Maley, P. L., and Mihuc, T., Kluwer Academic, 123–142, 2004. Salvano, E., Rousseau, A. N., Debailleul, G., and Villeneuve, J. P.: An environmental
benefit-cost analysis case study of nutrient management in an agricultural watershed, Can. Water Resour. J., 31(2), 105–122, 2006.
25
Santhi, C., Arnold, J. G., Williams, J. R., Hauck, L. M., and Dugas, W. A.: Application of a watershed model to evaluate management effects on point and nonpoint source pollution, Transactions of the ASAE, 44(6), 1559–1570, 2001.
Simpson, A.: Microsoft Access 2, Sybex Inc., San Francisco, CA, 1994.
Turcotte, R., Fortin, J.-P., Rousseau, A. N., Massicotte, S., and Villeneuve, J.-P.: Determination
30
of the drainage structure of a watershed using a digital elevation model and a digital river and lake network, J. Hydrol., 240(3–4), 225–242, 2001.
Villeneuve, J. P., Blanchette, C., Duchemin, M., Gagnon, J. F., Mailhot, A., Rousseau, A. N.,
HESSD
4, 1301–1335, 2007
Applications and developments of
GIBSI
R. Quilb ´e and A. N. Rousseau Title Page Abstract Introduction Conclusions References Tables Figures ◭ ◮ ◭ ◮ Back Close
Full Screen / Esc
Printer-friendly Version
Interactive Discussion
Roux, M., Tremblay, J. F., and Turcotte, R.: Rapport Final du Projet GIBSI : Gestion de l’Eau des Bassins Versants `a l’Aide d’un Syst `eme Informatis ´e. Mars 1998 : Tome 1., R-462, INRS – Eau, Sainte-Foy, 1998a.
Villeneuve, J. P., Blanchette, C., Duchemin, M., Mailhot, A., Rousseau, A. N., Roux, M., Tr ´epanier, S., and Turcotte, R.: Document relatif aux commentaires du Comit ´e de suivi du
5
projet GIBSI, 462 Add1, INRS – Eau, Sainte-Foy, 1998b.
Villeneuve, J.-P., Rousseau, A. N., Mailhot, A., Salvano, E., Simard, B., Corriveau, R., and Tremblay, S.: Guide de l’usager de GIBSI (Version II – 2003), R-549-g2, INRS-ETE, Sainte-Foy (QC), Canada, 2003.
Wischmeier, W. H. and Smith, D. D.: Predicting rainfall erosion losses - A guide to conservation
10
planning, Agricultural Handbook No. 537, U.S. Department of Agriculture, Washington, D.C., 1978.
Wu, J., Zou, R., and Yu, S. L.: Uncertainty analysis for coupled watershed and water quality modeling systems, J. Water Resour. Planning Manage., 132(5), 351–361, 2006.
Yalin, Y. S.: An expression for bed-load transportation, Journal of the Hydraulics Division ASCE,
15
89, 221–250, 1963.
HESSD
4, 1301–1335, 2007
Applications and developments of
GIBSI
R. Quilb ´e and A. N. Rousseau Title Page Abstract Introduction Conclusions References Tables Figures ◭ ◮ ◭ ◮ Back Close
Full Screen / Esc
Printer-friendly Version
Interactive Discussion
Table 1. Probability of exceeding bacteriological WQS (WQSCF=200 CFU/100 mL) and aes-thetic WQS (WQSP=0.03 mg/L) during the summer period from 1982 to 1985 for the three scenarios : base case scenario (Sc A), fertilisation based on crop requirements (Sc B), fertili-sation based on crop requirement and treatment of Saint-Martin wastewater (Sc C).
P([CF]>WQSCF) P([P]>WQSP) 1982 1983 1984 1985 1982–1985 1982 1983 1984 1985 1982–1985 Sc A 1 1 0.84 0.94 0.94 0.36 0.52 0.28 0.20 0.32 Sc B 1 1 0.84 0.94 0.94 0.33 0.46 0.22 0.11 0.27 Sc C 0 0 0 0 0 0.22 0.33 0.17 0.09 0.19 1327
HESSD
4, 1301–1335, 2007
Applications and developments of
GIBSI
R. Quilb ´e and A. N. Rousseau Title Page Abstract Introduction Conclusions References Tables Figures ◭ ◮ ◭ ◮ Back Close
Full Screen / Esc
Printer-friendly Version
Interactive Discussion
Table 2.Results of the environmental benefit-cost analysis. Scenario Management unit Total
Benefits1 ($) Net Benefits2 ($) Net Costs3 ($) Benefit-Cost Ratio Reference Watershed 34,932,318 – – – RRAO Municipalities 39 879 554 4 947 236 13 358 754 0.37 Subwatershed 1 39 343 865 4 411 547 6 017 262 0.73 Subwatershed 2 40 168 706 5 236 388 9 282 867 0.56 1
The benefits are for recreational activities associated with water use for both river segments.
2
That is the difference between the benefits of the scenario RRAO for the management unit with the benefits of the base-case scenario.
3
The costs were calculated for a management period of one-year.
HESSD
4, 1301–1335, 2007
Applications and developments of
GIBSI
R. Quilb ´e and A. N. Rousseau Title Page Abstract Introduction Conclusions References Tables Figures ◭ ◮ ◭ ◮ Back Close
Full Screen / Esc
Printer-friendly Version
Interactive Discussion
Table 3.Q90 values (in µg/L) of Atrazine, MCPB and Metolachlor cumulative frequency curves obtained from GIBSI simulations.
Scenario Base case 1 (1-m filter strip) 2 (application rate) 1+2 Atrazine 0.454 0.080 0.060 0.026 MCPB 1.913 1.086 0.833 0.484 Metolachlor 0.423 0.179 0.133 0.000 1329
HESSD
4, 1301–1335, 2007
Applications and developments of
GIBSI
R. Quilb ´e and A. N. Rousseau Title Page Abstract Introduction Conclusions References Tables Figures ◭ ◮ ◭ ◮ Back Close
Full Screen / Esc
Printer-friendly Version
Interactive Discussion
Database – GIS – Input/Output data processing GRAPHICAL USER INTERFACE
(data visualisation, scenario construction, simulation run and analysis of output data)
Scenario Management Point source management Agricultural management Land use management Reservoir management HYDROTEL Hydrology RUSLE Erosion SWAT / EPIC Chemical transport QUAL2E Water quality Models (daily time step)
Probability of exceeding water quality standards
Benefit-cost analysis Graphics, maps and
statistics
Data Post-Processing Input :
Daily meteorological data (P, Tmin, Tmax)
Output: Daily streamflow and
water quality data
Fig. 1.Representation of GIBSI components and structure.
HESSD
4, 1301–1335, 2007
Applications and developments of
GIBSI
R. Quilb ´e and A. N. Rousseau Title Page Abstract Introduction Conclusions References Tables Figures ◭ ◮ ◭ ◮ Back Close
Full Screen / Esc
Printer-friendly Version
Interactive Discussion
Fig. 2.Example of GIBSI window for the definition of land use management scenario.
HESSD
4, 1301–1335, 2007
Applications and developments of
GIBSI
R. Quilb ´e and A. N. Rousseau Title Page Abstract Introduction Conclusions References Tables Figures ◭ ◮ ◭ ◮ Back Close
Full Screen / Esc
Printer-friendly Version
Interactive Discussion
Fig. 3.Chaudi `ere River watershed.
HESSD
4, 1301–1335, 2007
Applications and developments of
GIBSI
R. Quilb ´e and A. N. Rousseau Title Page Abstract Introduction Conclusions References Tables Figures ◭ ◮ ◭ ◮ Back Close
Full Screen / Esc
Printer-friendly Version
Interactive Discussion
Fig. 4.Peak runoff increase after deforestation for the 1995 meteorological series (from Lavigne
et al., 2004).
HESSD
4, 1301–1335, 2007
Applications and developments of
GIBSI
R. Quilb ´e and A. N. Rousseau Title Page Abstract Introduction Conclusions References Tables Figures ◭ ◮ ◭ ◮ Back Close
Full Screen / Esc
Printer-friendly Version Interactive Discussion 50% 55% 60% 65% 70% 75% 80% 1975 1977 1979 1981 1983 1985 1987 1989 1991 1993 1995 1997 1999 2001 2003 Year 14.6% 13.4% 20.7% 21.0% 16.8% 18.8% 16.9% 0% 5% 10% 15% 20% 1975 1977 1979 1981 1983 1985 1987 1989 1991 1993 1995 1997 1999 2001 2003 Year Pr o p o rti o n o f th e w a te rs h e d (% ) 14.6%13.4%20.7%21.0%16.8%18.8%16.9% 19 75 19 77 19 79 19 81 19 83 19 85 19 87 19 89 19 91 19 93 19 95 19 97 19 99 20 01 20 03 Year Propor tion of the watershed ( %) Agricultural Land Pasture Cereals Corn Forest
Fig. 5.Evolution of land use on the Chaudi `ere River watershed from 1976 to 2004.
HESSD
4, 1301–1335, 2007
Applications and developments of
GIBSI
R. Quilb ´e and A. N. Rousseau Title Page Abstract Introduction Conclusions References Tables Figures ◭ ◮ ◭ ◮ Back Close
Full Screen / Esc
Printer-friendly Version Interactive Discussion 0 20 40 60 80 100 120 140 160 1 2 3 4 5 6 7 8 9 10 11 12 Month M e a n m o n th ly w a te r d is c h a rg e ( m m ) 0 20 40 60 80 100 120 140 160 1 2 3 4 5 6 7 8 9 10 11 12 Month M e a n m o n th ly w a te r d is c h a rg e ( m m ) 1) 2)
Fig. 6. Effect of climate change and land use evolution on mean monthly water discharge.
Only the two GCM/GES combinations that give the extreme effects among all GCM/GES are considered here: HadCM3-A2b (1) and ECHAM4-A2 (2). In both cases, the bold line with squares represents the present conditions as simulated by the model. Other lines represent future water discharge considering base case land use evolution scenario (thin line, circles), scenario A (dotted line, triangles) and scenario B (dotted line, stars).