HAL Id: hal-00299075
https://hal.archives-ouvertes.fr/hal-00299075
Submitted on 9 Mar 2004
HAL is a multi-disciplinary open access
archive for the deposit and dissemination of
sci-entific research documents, whether they are
pub-lished or not. The documents may come from
teaching and research institutions in France or
abroad, or from public or private research centers.
L’archive ouverte pluridisciplinaire HAL, est
destinée au dépôt et à la diffusion de documents
scientifiques de niveau recherche, publiés ou non,
émanant des établissements d’enseignement et de
recherche français ou étrangers, des laboratoires
publics ou privés.
Automated sliding susceptibility mapping of rock slopes
A. Günther, A. Carstensen, W. Pohl
To cite this version:
A. Günther, A. Carstensen, W. Pohl. Automated sliding susceptibility mapping of rock slopes. Natural
Hazards and Earth System Science, Copernicus Publications on behalf of the European Geosciences
Union, 2004, 4 (1), pp.95-102. �hal-00299075�
Natural Hazards and Earth System Sciences (2004) 4: 95–102 SRef-ID: 1684-9981/nhess/2004-4-95
© European Geosciences Union 2004
Natural Hazards
and Earth
System Sciences
Automated sliding susceptibility mapping of rock slopes
A. G ¨unther, A. Carstensen, and W. Pohl
Institut f¨ur Umweltgeologie, Technische Universit¨at Braunschweig, Pockelsstrasse 3, D-38106 Braunschweig, Germany Received: 1 September 2003 – Revised: 19 January 2004 – Accepted: 21 January 2004 – Published: 9 March 2004 Part of Special Issue “Landslide and flood hazards assessment”
Abstract. We present a suite of extensions for ARCVIEW
GISTM(ESRI) that allows to map the spatial distribution of first-order mechanical slope-properties in hard rock terrain, e.g. for large slope areas like water reservoir slopes. Be-sides digital elevation data, this expert-system includes re-gional continuous grid-based data on geological structures that might act as potential sliding or cutoff planes for rock-slides. The system allows rapid automated mapping of geometrical and kinematical slope properties in hard rock, providing the basis for spatially distributed deterministic sliding-susceptibility evaluations on a pixel base. Changing hydrostatic slope conditions and rock mechanical parameters can be implemented and used for simple predictive static sta-bility calculations. Application is demonstrated for a study area in the Harz Mts., Germany.
1 Introduction
GIS-based landslide susceptibility mapping is generally per-formed by two different methodological approaches. Quali-tative heuristic or quantiQuali-tative statistical modeling techniques mostly employ polygon data to define the spatial variabil-ity of geological, geomorphological, and landslide inventory terrain parameters (e.g. Carrara et al., 1995; Atkinson and Massari, 1998; Van Westen et al., 2003). Raster-based deter-ministic mapping techniques involve physically based slope stability calculations on a cell-per-cell basis (e.g. Hammond et al., 1992; Montgomery and Dietrich, 1994; Pack et al., 1998) with grid-based mechanical slope data. These models are commonly calibrated with the use of geotechnical mate-rial parameters as deduced from field- and laboratory exper-iments, or landslide data.
Of fundamental importance for the deterministic evalua-tion of the sliding susceptibility of large slope-areas in hard rock terrain are spatially distributed information about the
in-Correspondence to: A. G¨unther
ternal geometry of the slopes, and data about the geometric relationships between geological structures that might be ac-tivated for rockslides and topography. With this data, simple determinations of slope kinematics can be performed on a pixel base (G¨unther, 2003), providing the basis for spatial slope stability assessments when incorporating hydrological and rock mechanical data.
In this paper, we will present the state of development of RSS-GIS (Rock Slope Stability GIS), an expert-system based on ARCVIEW GISTM software of ESRI (Environ-mental Systems Research Institute inc.). Grid-based RSS-GIS is build of several extensions (modules) for ARCVIEW GISTM that can be used for a rapid automated mapping of geometrical and kinematical slope properties, and spatially distributed, pixel-based stability calculations of rock slopes.
2 Database
The basis for spatially distributed evaluations of slope sta-bility in hard rock terrain consists of continuous orienta-tion data of sliding relevant geological structures (DSM, Digital Structural Models) and topography as derived from DEM (Digital Elevation Model) data. Computation of az-imuth and dip (or “aspect” and “slope”) of topography with raster DEM-data is part of ARCVIEW GISTM basic func-tionalities (e.g., Burrough and McDonnel, 1998). DSM-construction, however, is much more difficult and the suit-able methodology depends on the kind and amount of avail-able data and the specific structural geometry. For exam-ple, DSM (e.g. spatially distributed information about the orientation of a specific geological structure) might be de-rived from i) direct spatial interpolation of irregularly dis-tributed measurements of tectonic orientation data (Meente-meyer and Moody, 2000), ii) direction-cosine interpolation of tectonic fabric measurements (G¨unther, 2003), iii) spa-tial extrapolation of elevation-registered curvilinear geologi-cal features through variable geometric projection techniques (VGP; De Kemp, 1998, 1999), or iv) derivation and spatial
96 A. G¨unther et al.: Automated sliding susceptibility mapping of rock slopes
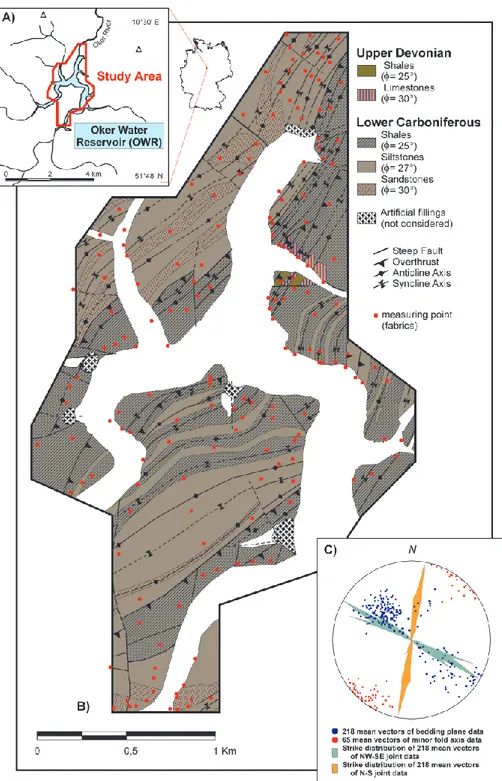
Fig. 1. Locality (A) and tectonic map (B) of the study area in the Harz Mts.,
Germany (based on a modified geo-logical map of Lower Saxony 1:25 000 sheet 4128, Hinze, 1971). The de-formed flyschoid stratigraphic succes-sions reveal prominently evolved sed-imentary bedding planes and are in-tensely folded, jointed and faulted. The overall structural trend is oriented NE– SW with the fold structures facing to the NW. Friction angles for disconti-nuity planes in the different rock units were obtained by RMR-rating (Bieni-awsky, 1989) including Schmidt ham-mer rebound tests at representative out-crop locations. Also shown: loca-tions of fabric measuring points (loca-tions outside study area are not shown).
(C) Fabric diagram (equal area
projec-tion, lower hemisphere) showing direc-tion distribudirec-tion of bedding plane and joint data used for interpolation. Ori-entation of mean vectors of minor fold axis data points to subhorizontal fold geometry.
interpolation of structural contour data from map- and bore-hole data (Groshong, 1999; Kus and Barthel, 2000). Because of the different methodologies and the limited geostatistical and 3-D capabilities of ARCVIEW GISTM, tools for con-struction of DSM are not yet implemented into RSS-GIS.
Besides geometrical data, spatially distributed geotechni-cal data (friction coefficients, cohesion values, etc.) can be used with RSS-GIS on a pixel base, but these parameters may also be estimated and generalized. For static stability calcu-lations, hydrostatic slope conditions are of major importance.
If regional hydrological data for a specific study area is avail-able, the data can be used in RSS-GIS; if not, these data must also be estimated.
In the example data set from a water reservoir in the West-ern Harz Mountains, Germany, dense structural information is available that allows constructions of DSMs with a pixel size of 10 m2for all sliding relevant geological discontinu-ity planes (Fig. 1). The DSMs where constructed by spatial interpolation of direction cosine-converted mean vectors of field measurements of each discontinuity set (see G¨unther,
A. G¨unther et al.: Automated sliding susceptibility mapping of rock slopes 97
2003) using an inverse distance to a power algorithm (Davis, 1986). For interpolation of bedding plane data, the traces of the horizontal folds from the tectonic map (Fig. 1) were incorporated as breaklines (e.g. pre-defined pixeltraces with a dip value zero). The traces of map-scale faults were in-corporated as discontinuities for interpolation due to the fact that the folds are offset by these structures. Orientation data of joint fabrics were interpolated by using the fault traces of the tectonic map as discontinuities and neglecting the fold axes, because field observations indicate that the joints are offset by the faults but do crosscut the fold structures. Mean orientations of NW–SE and N–S striking joints and bedding planes, obtained at 218 observation sites were used to com-pute corresponding DSMs for our study area (Fig. 1, for a more detailed discussion on interpolation of fabric measure-ments see G¨unther, 2003). Structural field mapping was con-ducted at a scale of 1:5 000, the spatial position of the mea-suring points was obtained with a hand held GPS receiver and aerial photographs. The fabric measurements were car-ried out with a double circled geological fabric compass.
Topographic data consist of high-quality elevation data based on a 5 m resolution DEM (ATKIS DGM5) provided by LGN (Landesvermessung und Geobasisinformation Nieder-sachsen, Hannover). Geotechnical information, primarily consisting of friction coefficients of discontinuity planes for each geological unit, was obtained by rock mass classifica-tion (Bieniawski, 1989) procedures at representative field lo-cations including Schmidt hammer rebound tests. Different rock units of the geological map were classified using mean values (Fig. 1). Because at this stage very limited geotechni-cal information is available, it was not possible to determine the spatial variability of friction coefficients within each ge-ological unit. However, if spatially distributed geotechnical data should be available, it can be used with the software on a pixel base. Hydrological data, consisting of conduc-tivity values for different rock units and hydraulic pressure head measurements in boreholes over tens of years, were ob-tained from a sample site located outside the western margin of the study area. Moreover, meteorological measurements have been carried out for a time span of 2 years.
3 Methodology
All applications described below are based on grid calcu-lations on a pixel base. Despite the fact that the system is mainly dealing with 3-D vector data, 3-D analysis environ-ments are not required because vector data are transformed into azimuth and dip values, respectively direction cosines and hence can be handled using multiple 2-D grids (G¨unther, 2003). Simple raster-based calculations were programmed directly within the ARCVIEW GISTM environment, more complex computations have been encoded as externally com-piled routines that are launched from the ARCVIEW GISTM front end.
RSS-GIS consists of three ARCVIEW GISTMextensions: “SlopeMap”, “StereoMap” and “HydroMap”. Each of these
may also be used independently, or combined with other available ARCVIEW GISTMextensions.
3.1 Spatially distributed determination of slope geometry and kinematics
Geometric properties of hard rock hill slopes consists of cut-ting edge- and angular relationships between two DSMs, or one DSM and topography (G¨unther, 2003). Alternatively, Meentemeyer and Moody (2000) presented a technique to calculate either a continuous or a classified index to char-acterize the alignment of geological fabrics with respect to topography (TOBIA, “Topographic-bedding plane intersec-tion angle”). The RSS GIS extension “SlopeMap” allows the rapid automated calculation of azimuth and dip of cutting-edge and angular values between various DSM and DEM data, and calculation of TOBIA index or classes.
In hard rock hill slopes, three main types of failure kine-matics along prominent rock discontinuities can be distin-guished: plane failure, wedge failure and toppling (Hoek and Bray, 1981). In RSS-GIS, the kinematical possibility of these failure-types can be broadly evaluated on a regional scale with the extension “SlopeMap” from geometrical slope data (toppling is not discussed in this paper).
With the RSS-GIS extension “StereoMap”, stereographic analysis with grid- or point-based orientation data can be performed. “StereoMap” is based on enhanced routines of Knox-Robinson and Gardoll (1998). Besides plotting and cross-relation of orientation data, this module also allows sta-tistical and eigenvector analysis after Wallbrecher (1986), ro-tation of vector data, plotting of small circles, and calculation of rose diagrams.
When determining the loci of possible plane failures with “SlopeMap” in RSS-GIS (Fig. 2), initially the conformity of a chosen discontinuity and the slope must be constrained by using either angular values or TOBIA-index. Then, a fric-tion angle can be chosen either globally or for every pixel by defining a corresponding grid-theme. The algorithm evalu-ates at every pixel if the discontinuity dips steeper or equal to the friction angle, and if a user defined classification of ge-ometrical alignment between slope and discontinuity is ful-filled. It produces a corresponding grid, where those parts of slopes are mapped where the slope dips steeper than or equal to the discontinuity (Fig. 2).
For the spatial evaluation of possible wedge failures along two geological discontinuities (Fig. 2), azimuth and dip grids of cutting edges of the regarded planes must first be calcu-lated. Then, a friction angle can be chosen globally or by using a related grid-theme. The algorithm checks at every pixel if the cutting edge of the discontinuities dips within a space that is defined by the slope plane and a friction cone, whose half-opening angle corresponds to the defined friction angle. It produces a grid where the value 1 is given for cells where wedge-failure is kinematically possible, otherwise a no-data-value is returned.
The results of the kinematical analysis can be plotted into stereographic projections with the RSS-GIS “StereoMap”
98 A. G¨unther et al.: Automated sliding susceptibility mapping of rock slopes
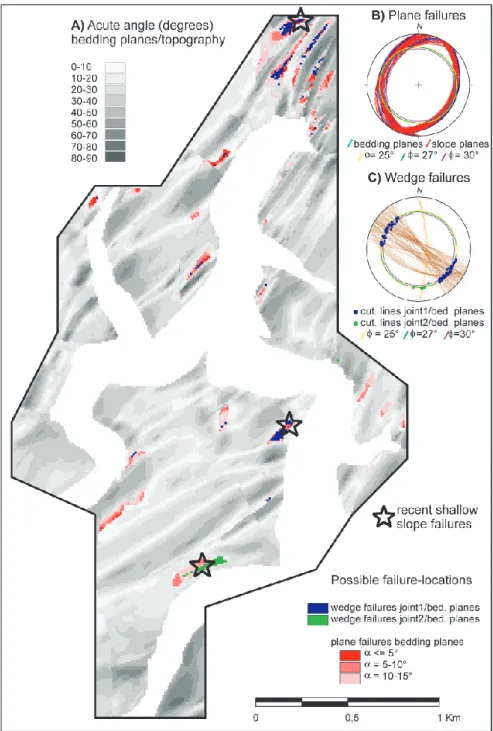
Fig. 2. Geometrical and kinematical
slope analysis. (A) Distribution of the acute angle α between bedding plane DSM and topography. Also shown: Spatial distribution of pixel locations where bedding-plane parallel slope fail-ures are kinematically possible (clas-sified according to angular conformity between the planes, slope angle, and friction angle along potential failure planes), and locations were wedge fail-ures along bedding planes and two joint DSM are kinematically possible. (B) Fabric diagram showing bedding plane and slope orientations of pixel locations kinematically susceptible for bedding plane parallel slope failure with asso-ciated friction cones. (C) Fabric dia-gram showing cutting line linears be-tween joints and bedding planes, and joint planes of pixel locations where wedge failure along joints and bedding planes are kinematically possible. The directions of the cutting lines between the respective discontinuity pairs indi-cate the directions of possible sliding.
extension (Fig. 2) and can be back-related to the map to ex-amine critical regions. In the example shown in Fig. 2, pos-sible locations for slope failures on bedding planes as well as wedge failures on bedding planes and the NW–SE resp. N–S striking joint systems are documented. The validity of this analysis is proven by local rock slides with corresponding mechanisms that recently occurred on these slope portions (Fig. 2, G¨unther et al., 2002).
3.2 Spatially distributed determination of hydrological slope conditions
For spatially distributed static stability calculations in hard rock terrain, groundwater pressures on sliding-relevant
dis-continuity planes must be known or estimated. Towards this goal, the relative degree of water saturation of a specific lithostatic column has to be determined for every pixel of a study area from topographical and meteorological data, as well as from physical slope properties (i.e. hydraulic conduc-tivity). Due to the fact that rock mass relaxation and fracture-opening affected the hillslopes of the study site down to depths of about 20 m (Sch¨oniger, 1991), we preliminarily assume that the bulk direction of shallow groundwater flow from and to each pixel is at a first approximation mainly con-strained by the orientation of the topography. Although we are concerned with slope stability on individual geological structures, we treat the relaxed slope zone as a continuum for hydrological considerations because the direction of shallow
A. G¨unther et al.: Automated sliding susceptibility mapping of rock slopes 99
0 0,5 1 Km
Relative wetness index
WI >= 2 WI = 2-1 WI = 1-0,1 WI <= 0,1 no data
A) Normal precipitation event
(10,1 mm/day) B) High precipitation event(110 mm/day)
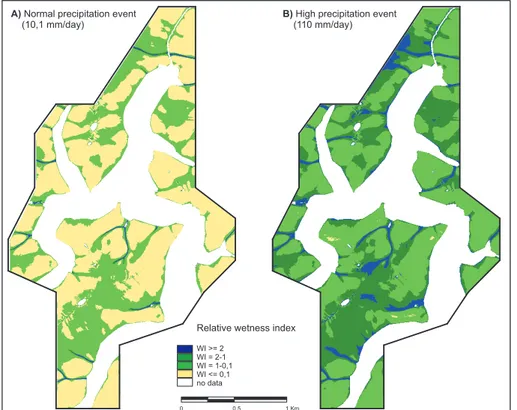
Fig. 3. Relative topographic wetness
index calculations according to Pack et al. (1998). The calculations were per-formed by specifying a thickness of the transmissive layer of 20 m, and by ap-plying a global hydraulic conductivity of 2.7−5m/s.
subsurface flow must be thought not to be governed by the orientation of individual, but all present conductive struc-tures. For the considered regional scale, this assumption is supported by runoff and pressure head measurements in the study area (Carstensen et al., 2003).
In order to determine flow directions and specific catchment areas for each pixel from the DEM-data, the
Dinf−methodology from the TARDEM program suite
pre-sented by Tarboton (1997) was incorporated into the exten-sion “HydroMap” of RSS GIS. A relative topographic wet-ness index (W I ) according to Pack et al. (1998) can then be calculated for a specific thickness of a transmissive layer on a pixel base with
W I = R · a
T ·sin θ (1)
where a = specific catchment area (m2/m), R = steady-state recharge rate (m/hr), T = hydraulic transmissivity (m2/hr), and θ = topographic slope angle (Pack et al, 1998). This in-dex ranges for shallow subsurface flow between 0 and 1 with any excess above saturation inducing overland flow. Thus,
W Ispecifies the relative hydrostatic depths within the trans-missive layer at each pixel location.
Topographic wetness index calculations are based on the following general assumptions: i) shallow lateral subsurface flow follows topographic gradients, ii) lateral discharge at ev-ery pixel location is in equilibrium with steady state recharge
R, iii) the capacity for lateral flux at each point is T sin θ (Montgomery and Dietrich, 1994; Pack et al., 1998). The last assumption implies that a uniform hydraulic conductiv-ity is assumed for the relaxed slope zone, overlying relatively
impermeable bedrock. The steady state assumption for rela-tive saturation calculations implies that transient groundwa-ter fluctuation and infiltration as a response to varying pre-cipitation are not considered.
A global hydraulic conductivity of 2.7−5m/s was set for the whole study area for relative saturation calculations. This value represents a mean value of conductivity data obtained from field- and laboratory analysis within the weathered slope zone west of the study area (Sch¨oniger, 1991). How-ever, it is also possible with “HydroMap” to use spatially distributed conductivity values, if available.
During our meteorological observation period of two years, frequent (“normal”) precipitation events bear about 10.1 mm/day of precipitation. The highest rainfall event measured during our observation period was, however, 10 times higher (110 mm/day) and coincides with a statistical 100 year maximum for the study area. In Fig. 3, the spatial distribution of relative saturation of a transmissive layer of 20 m thickness for both cases is shown.
3.3 Spatially distributed determination of slope stability The stability of kinematically critical slope sections can be evaluated by calculating the slope-orientation dependent lithostatic normal- and shear stress distribution on potential failure planes for each pixel at a specified depth (G¨unther, 2003), and by relating this to a Mohr-Coulomb failure crite-rion formulated as
100 A. G¨unther et al.: Automated sliding susceptibility mapping of rock slopes
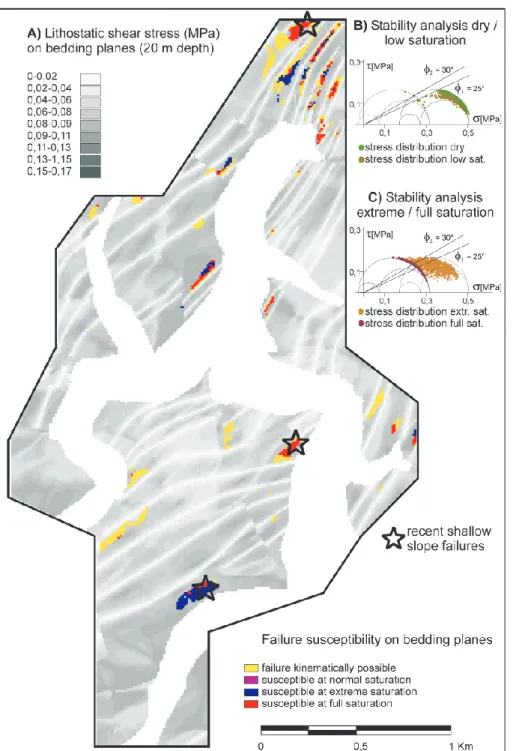
Fig. 4. Spatially distributed
stabil-ity analysis for bedding plane-parallel slope failure. (A) Distribution of litho-statically induced, slope orientation de-pendent shear stress magnitudes on the bedding plane DSM at a depth of 20 m. Also shown: Locations of kinemati-cally possible failure (Fig. 2), and spa-tial distribution of possible instabil-ity due to three different saturation-conditions. (B) Stability analysis in
Mohr diagram of pixel values for the dry case and low saturation. (C) Stabil-ity analysis for high and full saturation. The Mohr circle triplets indicate princi-pal stress magnitudes for dry case and full saturation, respectively.
where τcrit= critical shear stress to exert movement on
discontinuity (MPa), c = cohesion along plane (MPa),
σ =normal stress on the plane (MPa), u = hydrostatic pres-sure (MPa), θ = friction angle along the plane.
In the RSS-GIS extension “SlopeMap”, the effective nor-mal stress (σ0) for each pixel is calculated by subtracting the isotropic hydrostatic stress (u), as resulting from specific slope saturation conditions, from the lithostatically induced normal stress (σ ). Grids of effective normal and shear stress values, and a grid with pixels of τ/σ0 lying above the cell-specific failure-criterion, are produced. Optionally, the pixel values of effective normal and shear stresses can be plotted
into a Mohr-diagram together with the failure criterions. The datapoints in the Mohr-diagram can be cross-related to a map or a stereographic projection.
In Fig. 4, a susceptibility-analysis for slope movements along cohesionless bedding planes at a depth of 20 m with an averaged global rock density of 2.6 g/cm3and a principal stresses ratio R set to 0.3 is shown for the study area. Clearly, most slope regions are stable even at high saturation. For the unrealistic assumption of full saturation of the whole slope region, still not all slope portions kinematically susceptible to failure would fail.
A. G¨unther et al.: Automated sliding susceptibility mapping of rock slopes 101
4 Conclusions
We have presented the stage of development of RSS-GIS, an expert system for distributed deterministic evaluation of slope stability of rock slopes. RSS-GIS is useful for prelim-inary regional stability assessments of large slope areas un-der varying hydrological conditions. Because the approach is concerned with regional evaluations, relatively simple meth-ods are applied. Sensitivity analyses may be performed when geotechnical and hydrological data are completely lacking and can only be estimated. If measured data is available, the obtained models can be calibrated to a certain degree. RSS-GIS offers the possibility for a detailed parameteriza-tion of stability models if the according data is available, however, it should be kept in mind that such models may be-come overparametrized considering the regional modelling approach. In the example data shown here, the results ob-tained with RSS-GIS agree well with recently observed slope instability-phenomena within the study area (Figs. 2 and 4, G¨unther et al., 2002).
For future developments, it is planned to incorporate the effect of changing reservoir lake levels on groundwater height into the groundwater saturation calculations. This was not treated in the presented study because of a lack of data and missing topographic and geological information below the recent water table. Furthermore, it is planned to imple-ment a transient infiltration model into the hydrological mod-elling tool to overcome the limitations of steady state calcula-tions (Iverson, 2000). Next, it is important to develop strate-gies to model multidirectional flow on geological discontinu-ities represented by DSM to make the system applicable in terrains where bulk shallow subsurface flow direction cannot be approximated by the orientation of topography.
To conclude, it is imperative to note that the results pro-duced with RSS-GIS are only models obtained at a regional scale, and one should remember the quality of the database and the limitations of the methods when interpreting the re-sults. Resolution and validity of the models produced with RSS GIS mainly depend on the amount, density, quality and kind of input-data. Nevertheless, even though RSS-GIS can-not substitute detailed stability assessments of critical slope sections at a local scale, it allows regional first-order assess-ments and the identification and mapping of critical slope sections.
Acknowledgements. This study is part of a collaborative project
“Developments of methods for monitoring and prognosis of slope stability of water reservoirs”, funded by the BMBF (German Federal Ministry for Education and Research), grant 02WT0087. Support from LGN (Landesvermessung und Geobasisinformation Niedersachsen), Hannover, the Harzwasserwerke, Hildesheim, and the Straßenbauamt Goslar, Goslar, is gratefully acknowledged. We thank N. S¨ohl for field assistance. We also thank C. J. van Westen and an anonymous reviewer for helpful review of the manuscript.
Edited by: P. Reichenbach
Reviewed by: C. J. van Westen and another referee
References
Atkinson, P. M. and Massari, R.: Generalized linear modelling of susceptibility to landsliding in the Central Apennines, Italy, Computers & Geosciences, 24, 373–385, 1998.
Bieniaswki, Z. T.: Engineering rock mass classifications, Wiley, 1989.
Burrough, P. A. and McDonnel, R. A.: Principles of geographic information systems for land resources assessment, Oxford Uni-versity Press, 1998.
Carrara, A., Cardinali, M., Guzzetti, F., and Reichenbach, P.: GIS technology in mapping landslide hazard, in: Carrara, A. and Guzzetti, F.: Geographical information systems in assessing nat-ural hazards, Kluwer, 135–176, 1995.
Carstensen, A., G¨unther, A., and Pohl, W.: Prognose und Re-gionalisierung niederschlagsabh¨angiger Variationen der Berg-wasserverh¨altnisse als Modul einer fl¨achenhaften Standsicher-heitsbewertung von Festgesteinsh¨angen (in German with English abstract), in: Feeser, V.: Proc. 14. Tagung f¨ur Ingenieurgeologie, Kiel, 367–368, 2003.
Davis, J. C.: Statistics and data analysis in geology, Wiley, 1986. De Kemp, E. A.: Three-dimensional projection of curvilinear
ge-ological features through direction cosine interpolation of struc-tural field observations, Computers & Geosciences, 24, 269–284, 1998.
De Kemp, E. A.: Visualization of complex geological structures using 3-D B´ezier construction tools, Computers & Geosciences, 25, 269–284, 1999.
Groshong, R. H.: 3-D Structural geology, Springer, 1999.
G¨unther, A.: SLOPEMAP: programs for automated mapping of geometrical and kinematical properties of hard rock hill slopes, Computers & Geosciences, 29, 865–875, 2003.
G¨unther, A., Carstensen, A., and Pohl, W.: GIS-applications in slope stability assessments, in: Landslides, Proc. 1st European Conference on Landslides Prague 2002, edited by Rybar, J., Stemberk, J., and Wagner, P., Balkema, 175–184, 2002. Hammond, C., Hall, D., Miller, S., and Swetik, P.: Level 1
sta-bility analysis (LISA) documentation for version 2.0., General technical report INT-285, USDA Forest Service Intermountain Research Station, 1992.
Hinze, C.: Erl¨auterungen zur geologischen Karte von Nieder-sachsen 1:25 000 Blatt 4128 Clausthal-Zellerfeld (in German), Nieders. Landesamt f¨ur Bodenforschung, Hannover, 1971. Hoek, E. and Bray, J. W.: Rock Slope Engineering, The Institution
of Mining and Metallurgy, London, 1981.
Iverson, R. M.: Landslide triggering by rain infiltration, Water re-sources research, 36, 1897–1910, 2000.
Knox-Robinson, C. M. and Gardoll, S. J.: GIS-stereoplot: an inter-active stereonet plotting module for ARCVIEW 3.0 geographic information system, Computers & Geosciences, 24, 243–250, 1998.
Kus, G. and Barthel, R.: GIS-gest¨utzte Analyse von Georisiken und -potentialen unter Verwendung geologischer 3-D-Untergrundmodelle (in German with English abstract), Zeitschrift f¨ur angewandte Geologie, 46, 167–173, 2000. Meentemeyer, R. K. and Moody, A.: Automated mapping of
confor-mity between topographic and geological surfaces, Computers & Geosciences, 26, 815–829, 2000.
Montgomery, D. R. and Dietrich, W. E.: A physically based model for the topographic control on shallow landsliding, Water resources research, 30, 1153–1171, 1994.
102 A. G¨unther et al.: Automated sliding susceptibility mapping of rock slopes
Pack, R. T., Tarboton, D. G., and Goodwin, C. N.: The SINMAP approach to terrain stability mapping, Proc. 8th Congress IAEG, Vancouver, B.C., 1998.
Sch¨oniger, M.: Beitrag zur Abflußbildung und Grundwasserneu-bildung im pal¨aozoischen Festgestein. Landschafts¨okologie und Umweltforschung (in German), 18, Technische Universit¨at Braunschweig, 1991.
Tarboton, D. G.: A new method for the determination of flow direc-tions and upslope areas in grid digital elevation models, Water resources research, 33, 309–319, 1997.
Van Westen, C. J., Rengers, N., and Soeters, R.: Use of geomor-phological information in indirect landslide susceptibility assess-ment, Natural Hazards, 30, 399–419, 2003.
Wallbrecher, E.: Tektonische und Gef¨ugekundliche Arbeitsweisen (in German), Enke-Verlag, Stuttgart, 1986.