HAL Id: hal-00317906
https://hal.archives-ouvertes.fr/hal-00317906
Submitted on 14 Oct 2005
HAL is a multi-disciplinary open access
archive for the deposit and dissemination of
sci-entific research documents, whether they are
pub-lished or not. The documents may come from
teaching and research institutions in France or
abroad, or from public or private research centers.
L’archive ouverte pluridisciplinaire HAL, est
destinée au dépôt et à la diffusion de documents
scientifiques de niveau recherche, publiés ou non,
émanant des établissements d’enseignement et de
recherche français ou étrangers, des laboratoires
publics ou privés.
dynamics related to a cusp auroral transient
K. Oksavik, J. Moen, H. C. Carlson, R. A. Greenwald, S. E. Milan, M. Lester,
W. F. Denig, R. J. Barnes
To cite this version:
K. Oksavik, J. Moen, H. C. Carlson, R. A. Greenwald, S. E. Milan, et al.. Multi-instrument mapping
of the small-scale flow dynamics related to a cusp auroral transient. Annales Geophysicae, European
Geosciences Union, 2005, 23 (7), pp.2657-2670. �hal-00317906�
SRef-ID: 1432-0576/ag/2005-23-2657 © European Geosciences Union 2005
Annales
Geophysicae
Multi-instrument mapping of the small-scale flow dynamics related
to a cusp auroral transient
K. Oksavik1,2, J. Moen1,3, H. C. Carlson4, R. A. Greenwald2, S. E. Milan5, M. Lester5, W. F. Denig6, and R. J. Barnes2
1Department of Physics, University of Oslo, Oslo, Norway
2Applied Physics Laboratory, Johns Hopkins University, Laurel, Maryland, USA 3also at: Arctic Geophysics, University Centre on Svalbard, Longyearbyen, Norway 4Air Force Research Laboratory, AFOSR/CA, Arlington, Virginia, USA
5Department of Physics and Astronomy, University of Leicester, Leicester, UK
6Space Vehicles Directorate, Air Force Research Laboratory, VSBXP, Hanscom AFB, MA, USA
Received: 30 August 2004 – Revised: 22 July 2005 – Accepted: 10 August 2005 – Published: 14 October 2005
Abstract. In this paper we focus on flux transfer events (FTEs) and poleward moving auroral forms (PMAFs) in the cusp region, combining data from the EISCAT Sval-bard radar, SuperDARN HF radars, ground-based optics, and three low-altitude polar-orbiting spacecraft. During an inter-val of southward interplanetary magnetic field the EISCAT Svalbard radar tracked a train of narrow flow channels drift-ing into the polar cap. One 30–60 km wide flow channel sur-rounded by flow running in the opposite direction is studied in great detail from when it formed equatorward of the cusp aurora, near magnetic noon, until it left the field-of-view and disappeared into the polar cap. Satellite data shows that the flow channel was on open field lines. The flow pattern is consistent with field-aligned currents on the sides of the flow channel; with a downward current on the equatorward side, and an upward current on the poleward side. The poleward edge of the flow channel was coincident with a PMAF that separated from the background cusp aurora and drifted into the polar cap. A passage of the DMSP F13 spacecraft con-firms that the FTE flow channel was still discernable over 15 minutes after it formed, as the spacecraft revealed a 30– 40 km wide region of sunward flow within the anti-sunward background convection. From the dimensions of the flow channel we estimate that the magnetic flux contained in the event was at least 1 MWb. This data set also shows that Birkeland current filaments often seen by low-altitude space-craft in the cusp/mantle are really associated with individual FTE events or a train of FTEs in progress. As the region 0 or cusp/mantle current represents the statistical average consis-tent with the large-scale flow pattern, we therefore introduce a new term – FTE currents – to denote the unique pair of Birkeland current sheets that are associated with individual meso-scale FTE flow disturbances. The poleward moving Correspondence to: K. Oksavik
auroral forms (PMAFs), often referred to in the literature, are the optical signature of the upward FTE current.
Keywords. Magnetospheric physics (Current systems;
Magnetopause, cusp and boundary layers) – Ionosphere (plasma convection)
1 Introduction
In a recent paper Oksavik et al. (2004a) demonstrated how the EISCAT Svalbard radar can be used to monitor small-scale flow structures in the polar ionosphere within a large field-of-view. Their technique was used to resolve the flow pattern surrounding a single poleward moving auroral form (PMAF), an optical signature in the cusp ionosphere that is believed to be the visible signature of flux transfer events (FTEs). Oksavik et al. interpreted their observations as supporting experimental evidence for the Southwood (1985, 1987) model, which predicts a twin-vortex flow pattern sur-rounding the footprint of the FTE, flux tube. Birkeland cur-rents are fed along the flanks of the flux tube transferring stress from interplanetary space (Southwood and Hughes, 1983) and set the ionospheric foot of the flux tube in mo-tion (Southwood, 1987). In the ionosphere the currents close horizontally through Pedersen currents parallel to the con-vection electric field. Oksavik et al. (2004a) observed that the PMAF was located on the poleward edge of the FTE flow channel, where the field-aligned Birkeland current is flowing out of the ionosphere. A similar conclusion was reached by Milan et al. (2000).
One major question during the last couple of decades has been whether magnetic reconnection is continuous (quasi-steady) or pulsed (impulsive) (Haerendel et al., 1978; Russell and Elphic, 1978, 1979). The primary transfer mechanism of flux from the solar wind to the magnetosphere is believed
to be impulsive dayside reconnection, also called FTEs (e.g. Cowley and Lockwood, 1992; Lockwood et al., 1995). Tran-sient events in the high-latitude ionosphere are often associ-ated with bursts in the reconnection rate (e.g. Lockwood et al., 2003)1, and Moen et al. (1995) were the first to observe simultaneous pulsed return flow of the dawn and dusk con-vection cells in association with cusp auroral transients. At the magnetopause FTE signatures often have a scale size of one Earth radius in the boundary normal direction (Saunders et al., 1984). In the ionosphere this will correspond to around 100–200 km along the meridian (Southwood, 1985, 1987). A reconnection burst is communicated from the magnetopause to the ionosphere as an Alfv´enic disturbance with an associ-ated system of field-aligned currents (FACs) (Glassmeier and Stellmacher, 1996).
From the ground the first radar observations of FTEs were carried out by van Eyken et al. (1984) and Goertz et al. (1985). Provan et al. (1998, 2002) observed pulsed tran-sients in the plasma flow poleward of the convection rever-sal boundary, and Neudegg et al. (2000) found good corre-spondance between FTEs near the magnetopause and dis-crete flow channels in the ionosphere. Signatures of FTEs have also been identified as poleward moving transients in the dayside aurora (e.g. Sandholt et al., 1990, 1993; Denig et al., 1993; Milan et al., 1999a, 2000; Thorolfsson et al., 2000; Moen et al., 2001a). In HF radar backscatter quite a few examples of poleward moving transients have been re-ported, and depending on their unique characteristics, these cases have been termed: flow channel events (FCE) (Pin-nock et al., 1993, 1995; Chisham et al., 2000; Neudegg et al., 1999, 2000), pulsed ionospheric flows (PIFs) (Provan et al., 1998, 2002; Provan and Yeoman, 1999; McWilliams et al., 2000), or poleward moving radar auroral forms (PMRAFs) (Milan et al., 2000; Davies et al., 2002; Rae et al., 2004). These features are also often related to each other (Wild et al., 2001), and dayside transients typically show repetition rates (e.g. Milan et al., 1999a) comparable to that of FTEs at the magnetopause.
In this paper we present a uniquely comprehensive set of observations of an FTE and its evolution from a vari-ety of instruments. Convection data from the SuperDARN HF radar network gives information on the large-scale back-ground flow, the EISCAT Svalbard radar in a fast scan mode gives high-resolution observations of the small-scale plasma flow surrounding the PMAF transient, a low-altitude po-lar orbiting DMSP spacecraft intersects the transient on its way across the polar cap, and two low-altitude polar orbit-ing NOAA spacecraft confirm that the aurora and the auroral transient are all located on open magnetic field lines.
1Lockwood, M., Davies, J. A., Moen, J., van Eyken, A. P.,
Ok-savik, K., McCrea, I. W., and Lester, M. E.: Motion of the day-side polar cap boundary during substorm cycles: II. Generation of poleward-moving events and polar cap patches by pulses in the magnetopause reconnection rate, Ann. Geophys., submitted, 2003.
2 Instrumentation
The EISCAT Svalbard Radar (ESR) is located at Longyear-byen (78.15◦N, 16.03◦E), corresponding to 75.1◦magnetic latitude. The radar consists of two parabolic antenna sys-tems; a fully steerable 32-m dish and a fixed 42-m dish point-ing along the magnetic field. On 18 December 2001 only the steerable dish was used, to move the radar beam in a fast az-imuth scan. Sweeping continiously at fixed elevation (30◦)
between two azimuth extremes (180 and 300◦) at a speed of
0.625◦/s, a plot of the line-of-sight ion drift within the fan-shaped field-of-view was obtained every 192 s, alternating between clockwise and anticlockwise scans. During a scan data is stored every 3.2 s, giving 60 adjacent beam directions that are 2◦wide in azimuth. The radial resolution (line-of-sight) is around 40 km, and depending on the distance from the radar site, the resolution in azimuth is between 10 and 30 km. This is a type of scan that has previously been used by Carlson et al. (2002, 2004) and Oksavik et al. (2004a).
Ground-based optical observations from Ny- ˚Alesund, Svalbard, were from the all-sky camera of the Air Force Re-search Laboratory (AFRL) and the all-sky camera and merid-ian scanning photometer (MSP) of the University of Oslo (UiO). The MSP measured auroral emissions at two wave-lengths (557.5 and 630.0 nm), scanning north to south, ap-proximately along the magnetic meridian. The AFRL camera obtained images of the 557.7-nm and 630.0-nm lines, every 60 and 30 s, respectively. The UiO camera obtained images at the 630.0-nm line, every 30 s. The all-sky images are trun-cated at 70◦zenith angle and superimposed onto a local ge-ographic map, assuming an emission altitude of 250 km for the 630.0 nm line, and 200 km altitude for the 557.7 nm line. Our reason for choosing 200 km for the green line is that in the cusp the particle fluxes are soft and this altitude gives a better overall correspondence with the location of the red line features after the aurora has been projected onto the map. A similar conclusion has been made by Milan et al. (1999b).
The two CUTLASS (Co-operative UK Twin Located Au-roral Sounding System) radars are located at Hankasalmi, Finland, (62.32◦N, 26.61◦E), and Rykkvibær, Iceland, (63.86◦N, 19.20◦W). Both radars are part of the Super-DARN radar network (Greenwald et al., 1995) and can operate at frequencies between 8 and 20 MHz in the HF band. These radars measure coherent backscatter echoes from field-aligned plasma irregularities in the high-latitude ionosphere. Each radar forms an antenna pattern with 16 azimuthal pointing directions (hereafter called beams), sep-arated by 3.2◦. According to the theoretical calculations of
Greenwald et al. (1985), the two-way half-power beam width depends on the transmitter frequency and varies from 2.5◦
at 20 MHz to 6◦ at 8 MHz. On 18 December 2001 the
transmitter frequency for both CUTLASS radars was 12.2– 12.4 MHz, corresponding to beam widths of 4.7–4.8◦. For CUTLASS the field-of-view includes Svalbard, whenever the ionospheric conditions for radio wave propagation are favourable. To receive ionospheric backscatter over Sval-bard the propagation mode most likely is the 1.5 F mode of
HF radio wave propagation (Milan et al., 1997), and stud-ies have shown that the cusp region and dayside auroral oval behave like a hard target (Milan et al., 1998; Moen et al., 2001b). Transmitting a 7-pulse scheme and analyzing the autocorrelation function of the returning signals gives backscatter Doppler spectra. These spectra are used to derive spectral characteristics, such as power, line-of-sight velocity and spectral width (e.g. Hanuise et al., 1993; Baker et al., 1995). In the F-region the backscattered echo is a trace of the E×B plasma drift (Villain et al., 1985; Ruohoniemi et al., 1987; Davies et al., 1999, 2000). The data we present was recorded in 70 range intervals of 45 km length between 180 and 3330 km from the two radar sites. For both radars each beam direction was sampled for 3 s, and a new sequence stepping through all 16 beam directions was started every 60 s. Within the ESR field-of-view the spatial resolution is expected to be 45 km north/south and 150–200 km east/west for the Finland radar, and 150–200 km north/south and 45 km east/west for the Iceland radar. For comparison the ESR data resolution is around 40 km line-of-sight and 10–30 km in az-imuth (depending on the distance from the radar site).
The DMSP F13 spacecraft flies in a Sun-synchronous cir-cular polar orbit at an altitude of 840 km. The instrumen-tation on DMSP F13 includes energetic particle spectrome-ters (Hardy et al., 1984), an ion drift meter (IDM) (Rich and Hairston, 1994), and a tri-axial magnetometer. The parti-cle spectrometers on DMSP F13 look toward local zenith to measure fluxes of electrons and ions with energies between 30 eV and 30 keV, once per second, in 20 logarithmically spaced steps. The IDM measures the horizontal and verti-cal components of the plasma flow across the trajectory. The horizontal drift (after correcting for the Earth’s co-rotation) is driven by the along-track component of the electric field E, which is calculated using the “frozen-in-flux” condition E=−v×B, where v and B represent the ion drift and the mag-netic field, respectively. The magnetometer measures the full vector field 12 times per second over the range ±68 000 nT with a resolution of 2 nT. Data are presented as differences between actual component measurements and predictions of the International Geophysical Reference Field model IGRF 2000 (Mandea and Macmillan, 2000).
The NOAA spacecraft are operated by the National Oceanic and Atmospheric Administration in low-altitude Sun-synchronous circular polar orbits. NOAA-15 crosses the northern cusp region from east to west at an altitude of 824 km, whilst NOAA-16 crosses the northern cusp region from south to north at an altitude of 866 km. Both space-craft have similar instrumentation, and the present study uses observations of electrons and protons from the Total Energy Detector (TED) and the Medium Energy Proton and Electron Detector (MEPED) instruments. TED measures electrons and ions in 16 energy channels between 0.05 and 20 keV at two viewing directions; one looks toward local zenith, the other looks 30◦ from zenith. Fluxes observed at both look angles are well within the atmospheric loss cone. The TED instrument was primary designed to obtain particle energy flux moments, but it can also provide crude electron and
−20 −10 0 10 20
ACE: Solar Wind Parameters, Dec 18 2001
nT [GSM] Bx+10nT By Bz−10nT 0 45 90 135 180
deg Clock angle
2 2.5 3 3.5 4 4.5 cm −3 Ni 0 5 10 15 20 10 4 K Ti 450 460 470 480 490 500 km/s V 08:00 239.7 27.3 4.8 08:30 239.7 27.4 4.4 09:00 239.7 27.4 4.1 09:30 239.7 27.4 3.9 10:00 239.7 27.4 3.8 UT X Y Z[GSM]
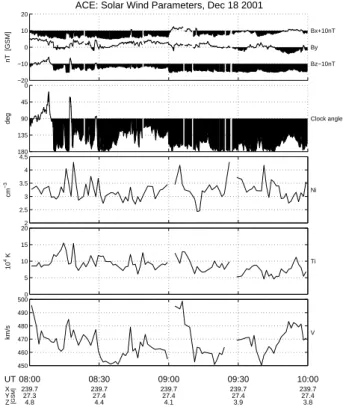
Fig. 1. Interplanetary magnetic field and solar wind parameters from the ACE spacecraft. The panels show from the top: the three components of the interplanetary magnetic field (negative values indicated with shading), the clock angle of the interplanetary
mag-netic field (>90◦or southward field indicated with shading), the
solar wind ion density (Ni), the solar wind ion temperature (Ti), and the solar wind velocity (V).
ion spectra. The MEPED instrument measures protons and electrons at angles of 10 and 80◦to the local vertical, corre-sponding to precipitating and trapped particles in the auroral zone, respectively. Observations from one proton channel (30–80 keV) and one electron channel (>30 keV) are used in this study. A detailed description of the NOAA space-craft and the particle instrumentation is given by Evans and Greer (2000).
Solar wind parameters were obtained from the ACE space-craft (Chiu et al., 1998) located near the L1 point in the so-lar wind upstream of the Earth. On 18 December 2001, the position of the spacecraft was (240, 27, 4) RE in GSM
co-ordinates. For this paper we focus on data from the ACE magnetic fields experiment (Smith et al., 1998) and the Solar Wind Electron Proton Alpha Monitor (SWEPAM) (McCo-mas et al., 1998).
3 Observations
Figure 1 presents an overview of the solar wind parameters from the ACE spacecraft (please note that the data points have not been lagged). The solar wind density and tem-perature were rather constant, with a solar wind velocity of
630.0 nm 557.7 nm N 60 30 0 30 S 60 N 60 30 0 30 S 60 Ny Ålesund MSP --- 18 Dec 2001 Ze ni th A ngl e ( d eg) Ze ni th A ngl e ( d eg) Universal Time 09:30 09:45 10:00 10:15 10:30 4. 0 3. 2 2. 4 1. 6 0. 8 In te nsi ty (k R) 0. 0 5 4 3 2 1 In te nsi ty (k R) 0
1-2
3-4 5-6
1-2
3-4 5-6
Fig. 2. Meridian scanning photometer data from Ny- ˚Alesund, Sval-bard. The upper panel shows the recorded intensities for the 630.0-nm (red line) and the lower panel the 557.7-630.0-nm (green) line. White dotted lines indicate three poleward moving auroral forms (1–2, 3– 4, 5–6) that occurred between the respective flow channels identi-fied in Fig. 3.
450–500 km/s, and the clock angle indicates that the IMF had a significant southward component. The IMF Bx was
mainly negative, By was generally positive, and Bz was
−3 nT prior to 09:00 UT, whereafter there is a step to −5 nT. An expected propagation delay of around 50–55 min means that this increase in the southward component will reach the magnetopause near 09:45 UT. Even though this estimate is only based on the time it takes for the solar wind to travel a radial distance of 240 RE, the timing appears to be consistent
with observed changes in the ground-based data.
Figure 2 shows a one-hour overview of the MSP record-ings from Ny- ˚Alesund, Svalbard. The upper panel shows the 630.0 nm (red line), and the lower panel the 557.7 nm (green line). Throughout the time interval (and in particular, starting around 09:45 UT) the aurora migrated equatorward within the MSP field-of-view, and all-sky images (not shown) con-firm that this is consistent with a general equatorward shift of the cusp aurora. The equatorward motion is assumed to be due to enhanced reconnection from an increased southward IMF. The aurora was also pulsed in intensity. Each bright-ening is separated by 5–10 min, and most brightbright-enings are seen both in the red and green lines. The auroral brightening associated with three poleward moving form events (1–2, 3– 4, and 5–6) is indicated in Fig. 2 with white dotted arrows.
Due to the comprehensive instrumental coverage, later in this paper we will be paying special attention to the feature iden-tified as PMAF event 3–4.
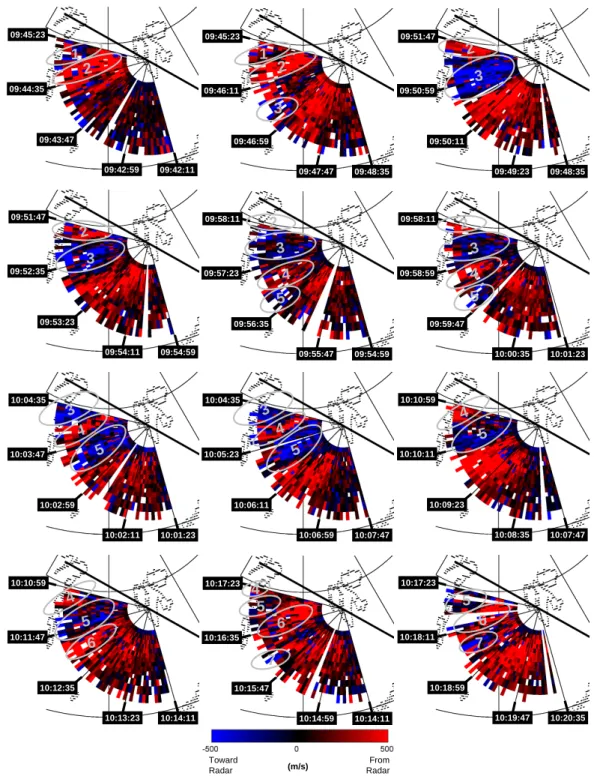
Figure 3 gives an overview of the plasma flow observa-tions from the EISCAT Svalbard radar (ESR). The ESR 32-m dish was scanning back and forth in azimuth at low elevation, looking west of Svalbard, and the observations show how the radar line-of-sight plasma flow evolved as a train of east-west flow channels drifted into the polar cap. Around 09:45 UT a westward flow channel (hereafter called FC2) was observed northwest of Svalbard. FC2 had an area of eastward flow on its poleward side; hereafter this flow area is identified as FC1. Both FC1 and FC2 drifted poleward and were followed by an eastward flow channel FC3. As indicated in Fig. 3, the first clear signature of FC3 was seen around 09:47 UT before it grew stronger around 09:50 UT. At 09:56 UT two more flow channels, FC4 and FC5, were seen equatorward of FC3, and FC2 reached poleward of the field-of-view around 09:58 UT. FC3, FC4 and FC5 also drifted poleward, and became clearly identified features around 10:03 UT. At 10:10 UT FC3 had left poleward of the ESR field-of-view, and a new channel FC6, of westward flow was born equatorward of FC5. By 10:17 UT FC4 had also reached poleward of the field-of-view, FC5 became weaker, and a new eastward flow channel FC7 was formed equatorward of FC6.
The alternation between towards and away velocities is an indication of small vortices in the plasma flow, as predicted by the Southwood (1987) model and supported by observa-tions of Oksavik et al. (2004a). As the FTE flux tube is mov-ing into the polar cap, plasma inside the perimeter of the flux tube is moving in one direction, consistent with a flow chan-nel. Due to the incompressibility of the ionosphere, plasma surrounding the fast-moving flux tube will be pushed away, to the sides, and eventually will close in behind the FTE flux tube, forming one vortex on each side of the flow chan-nel. Consequently, for a single FTE event there will be three flow channels; one flow channel of enhanced flow within the perimeter of the FTE flux tube (like FC4), and two flow chan-nels of reduced or return flow on the sides of the flow channel (like FC3 and FC5). These are all predictions of the South-wood (1987) model. On its poleward boundary FC4 has a velocity reversal driving an outgoing current and a precipita-tion of electrons which will excite an optical auroral feature identified as 3–4 in Fig. 2. The flow reversal on the equator-ward boundary of FC4 has an associated downequator-ward current. All of these boundaries drift poleward with time, as they per-sist in time. For conper-sistency it should also be noted that opti-cal features will exist on the poleward boundary of FC2 (i.e. PMAF event 1–2 in Fig. 2) and FC6 (i.e. PMAF event 5–6 in Fig. 2), however, the remainder of the paper will focus on the characteristics of PMAF event 3–4 and the associated flow channels FC3, FC4, and FC5.
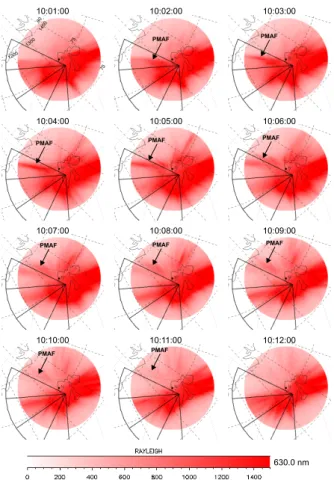
In Figs. 4 and 5 we present all-sky images of the aurora during this event for the auroral lines 630.0 nm and 557.7 nm, respectively. These images are from the high-gain AFRL camera at Ny- ˚Alesund, Svalbard. The 630.0-nm images are projected to 250 km altitude and the 557.7-nm images to
From Radar (m/s) Toward Radar 10:04:35 10:05:23 10:06:59 10:07:47 10:06:11 10:10:59 10:11:47 10:13:23 10:14:11 10:12:35 10:17:23 10:16:35 10:14:59 10:14:11 10:15:47 10:17:23 10:18:11 10:19:47 10:20:35 10:18:59 10:10:59 10:10:11 10:08:35 10:07:47 10:09:23 09:58:11 09:57:23 09:55:47 09:54:59 09:56:35 09:51:47 09:52:35 09:54:11 09:54:59 09:53:23 09:51:47 09:50:59 09:49:23 09:48:35 09:50:11 09:45:23 09:46:11 09:47:47 09:48:35 09:46:59 09:45:23 09:44:35 09:42:59 09:42:11 09:43:47 10:04:35 10:03:47 10:02:11 10:01:23 10:02:59 2 3 3 5 5 5 5 4 09:58:11 09:58:59 10:00:35 10:01:23 09:59:47 4 4 1 3 5 5 5 6 7 6 5 2 2 2 2 3 1 2 3 3 3 4 4 4 6 4 7
Fig. 3. Ion flow observations from a sequence of fast windshield wiper scans of the EISCAT Svalbard Radar. The radar was scanning back and forth in azimuth to the west of Svalbard, and shown with colors is the radar line-of-sight plasma flow, where red corresponds to drift away from the radar and blue is towards the radar. Identified with numbers are seven flow channels, see text for details.
200 km altitude. Indicated with a white arrow is the PMAF that appeared around 10:02 UT and drifted north toward the polar cap, as seen in both the 630.0 and 557.7 nm im-ages. The PMAF was most intense around 10:03–10:05 UT, with intensities reaching above 1 kR in 630.0-nm and around 0.7 kR in 557.7 nm. The PMAF was visible in 557.7-nm (Fig. 5) until 10:09 UT, when the intensity went below the
camera threshold of 0.2 kR. In 630.0 nm (Fig. 4) the PMAF could be followed at least until 10:10 UT, when the DMSP F13 spacecraft entered the field-of-view. The mapped trajec-tory is shown in Fig. 6f.
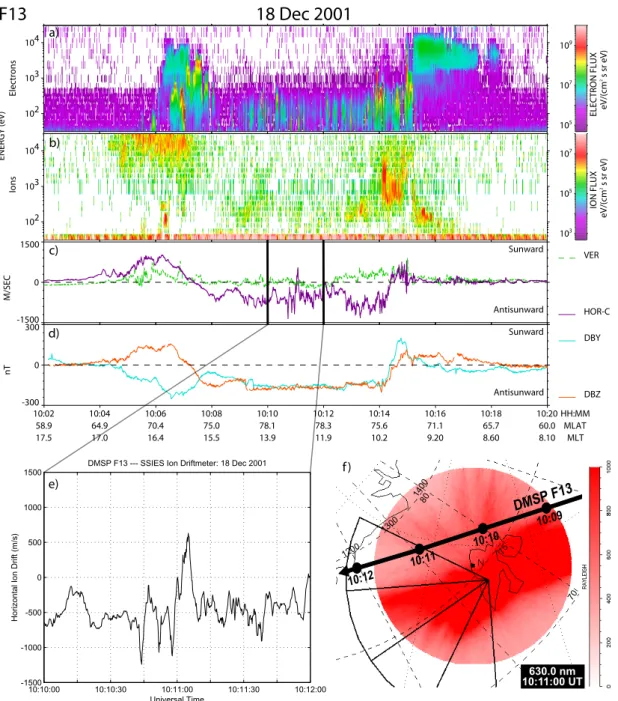
Data from the DMSP F13 is presented in Fig. 6. Figures 6a and b are energy-versus-time spectrograms for electrons and ions. Following the Newell and Meng (1992) classification
10:01:00 10:02:00 10:03:00 10:04:00 10:05:00 10:06:00 10:07:00 10:08:00 10:09:00 10:10:00 10:11:00 10:12:00 1200 1300 1400 70 75 80 PMAF PMAF
PMAF PMAF PMAF
PMAF PMAF PMAF
PMAF PMAF
630.0 nm
Fig. 4. Sequence of 630.0-nm (red line) all-sky images from the
Ny- ˚Alesund AFRL camera showing the motion of the PMAF. The
images are overlaid on a magnetic grid, and shown with solid lines is the EISCAT Svalbard radar’s field-of-view.
scheme, the post-noon BPS was crossed from 10:06:04– 10:08:05 UT, the pre-noon LLBL/BPS from 10:13:50– 10:15:11 UT, followed by the pre-noon CPS from 10:15:12– 10:18:17 UT. In the time interval the spacecraft is within the all-sky field of view, it is also within the dayside polar cap (between the pre-noon BPS and the post-noon LLBL/BPS encounters). Figure 6c depicts the vertical (VER; green curve) and horizontal cross-track (HOR-C; purple curve) components of the plasma drift measured by the IDM. Pos-itive values of the purple curve correspond to a mostly sun-ward drift, i.e. on a gross scale the plasma is drifting sunsun-ward in the pre-noon and post-noon BPSs, and anti-sunward into the polar cap within the all-sky camera field-of-view con-sistent with a standard twin-cell southward IMF convection pattern. Figure 6d plots components of the perturbation mag-netic field in a spacecraft-centered coordinate system, where the perturbation is the difference between the value mea-sured by the onboard tri-axial magnetometer and the IGRF model. The DBY component (light blue curve) points hori-zontal in a direction nearly parallel with the spacecraft’s ve-locity vector, and the DBZ component (red curve) points hor-izontal and perpendicular to the spacecraft trajectory. For
10:01:05 10:02:05 10:03:05 10:04:05 10:05:05 10:06:05 10:07:05 10:08:05 10:09:05 10:10:05 10:11:05 10:12:05 1200 1300 1400 70 75 80 PMAF PMAF
PMAF PMAF PMAF
PMAF PMAF PMAF
557.7 nm
Fig. 5. Sequence of 557.7-nm (green line) all-sky images from the
Ny- ˚Alesund AFRL camera showing the motion of the PMAF. The
images are overlaid on a magnetic grid, and shown with solid lines is the EISCAT Svalbard radar’s field-of-view.
the red curve positive slopes correspond to Birkeland cur-rents into the ionosphere. Consequently, one can see the encounter with the post-noon region 2 current flowing into the ionosphere around 10:05 UT, the post-noon region 1 cur-rent flowing out of the ionosphere around 10:07 UT, and the pre-noon region 1 current flowing into the ionosphere from 10:14–10:15 UT. Figure 6e is an enlargement of the horizon-tal cross-track plasma drift component in Fig. 6c, showing the narrow region in the polar cap of sunward flow around 10:11 UT. In Fig. 6f the DMSP F13 trajectory has been over-laid onto an image of the 630-nm cusp aurora (from the AFRL camera in Ny- ˚Alesund), showing how the spacecraft was located north of the cusp aurora as it traveled from east to west.
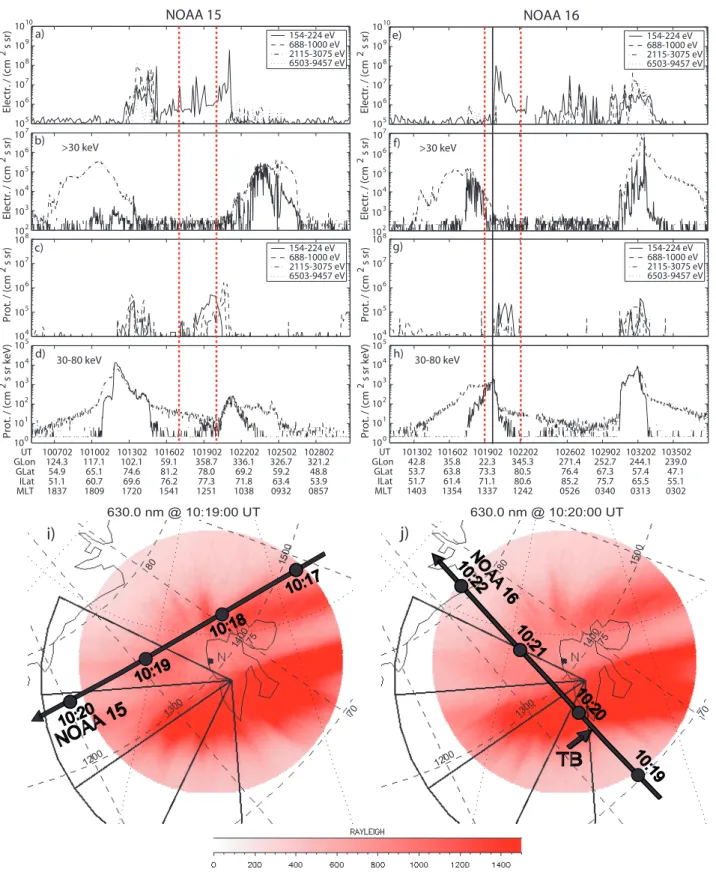
To complement the DMSP observations, in Fig. 7 we present particle data from the NOAA 15 and 16 spacecraft. Figures 7a and e show data of low-energy precipitating elec-trons, Figs. 7b and f of energetic elecelec-trons, Figs. 7c and g of low-energy precipitating ions, and Figs. 7d and h of energetic ions. In panels 7b, d, f and h the solid and dashed curves represent particles with a pitch angle near 10◦ (i.e. precipi-tating particles) and near 80◦(i.e. local mirroring particles),
10:10:00 10:10:30 10:11:00 10:11:30 10:12:00 -1500 -1000 -500 0 500 1000 1500 Universal Time H or iz on ta l I on D rif t ( m /s )
DMSP F13 --- SSIES Ion Driftmeter: 18 Dec 2001
102 103 104 102 103 104 -1500 0 1500 Sunward Antisunward VER HOR-C 105 107 109 EL EC TR O N F LU X eV /( cm 2 s s r e V ) 103 105 107 IO N F LU X eV /( cm 2 s s r e V )
F13
M /S EC18 Dec 2001
EN ER G Y (e V ) El ec tr o n s Io n s 10:02 58.9 17.5 10:04 64.9 17.0 10:06 70.4 16.4 10:08 75.0 15.5 10:10 78.1 13.9 10:12 78.3 11.9 10:14 75.6 10.2 10:16 71.1 9.20 10:18 65.7 8.60 10:20 60.0 8.10 HH:MM MLAT MLT -300 0 300 Sunward Antisunward DBY DBZ n T a) b) c) e) d) DMSP F13 10:12 10:11 10:10 10:09 1200 1300 1400 70 75 80 10:11:00 UT630.0 nm f)Fig. 6. Observations from the DMSP F13 spacecraft and the trajectory overlaid on the 630-nm cusp aurora. Panels (a) and (b) show energy spectrograms for the electron and ion precipitation. Panel (c) plots the vertical (green curve) and horizontal cross-track (purple curve) components of the plasma drift. Panel (d) plots the DBY (light blue curve) and DBZ (red curve) components of the perturbation magnetic field, see text for details. Panel (e) is an enlargement of the horizontal component in panel c, revealing a narrow region of sunward flow in the polar cap around 10:11 UT. Panel (f) shows the spacecraft trajectory relative to an image of the 630.0-nm aurora, the magnetic grid, and the EISCAT Svalbard radar’s field-of-view.
respectively. In Figs. 7i and j the NOAA 15 and 16 trajecto-ries have been overlaid on images of the 630 nm cusp aurora (from the AFRL camera in Ny- ˚Alesund) showing NOAA 15 moving westward and NOAA 16 crossing northward through the midday auroral zone. Indicated with dashed vertical red lines are the time intervals when the two spacecraft were within the camera’s field-of-view. NOAA 15 only detected modest fluxes of soft particle precipitation (electrons with
en-ergies <200 eV, and ions with enen-ergies <3 keV) within the camera’s field-of-view, consistent with the spacecraft being north of the cusp aurora. NOAA 16 observed a transition from energetic to soft particle precipitation while crossing the 30 keV electron trapping boundary, as indicated with a vertical guide line in Figs. 7e−h and a white arrow in Fig. 7j. Please note that the electron trapping boundary (marked by the white arrow and TB in Fig. 7) is located just equatorward
NOAA 16 105 106 107 108 109 1010 El ec tr . / (c m 2s sr ) 154-224 eV 688-1000 eV 2115-3075 eV 6503-9457 eV 102 103 104 105 106 107 >30 keV El ec tr . / (c m 2s sr ) 104 105 106 107 108 Pr o t. / (c m 2s sr ) 154-224 eV 688-1000 eV 2115-3075 eV 6503-9457 eV 100 101 102 103 104 105 30-80 keV Pr o t. / (c m 2s sr k eV ) 101302 42.8 53.7 51.7 1403 101602 35.8 63.8 61.4 1354 101902 22.3 73.3 71.1 1337 102202 345.3 80.5 80.6 1242 102602 271.4 76.4 85.2 0526 102902 252.7 67.3 75.7 0340 103202 244.1 57.4 65.5 0313 103502 239.0 47.1 55.1 0302 UT GLon GLat ILat MLT NOAA 15 105 106 107 108 109 1010 El ec tr . / (c m 2s sr ) 154-224 eV 688-1000 eV 2115-3075 eV 6503-9457 eV 102 103 104 105 106 107 >30 keV El ec tr . / (c m 2s sr ) 104 105 106 107 108 Pr o t. / (c m 2s sr ) 154-224 eV 688-1000 eV 2115-3075 eV 6503-9457 eV 100 101 102 103 104 105 30-80 keV Pr o t. / (c m 2s sr k eV ) 100702 124.3 54.9 51.1 1837 101002 117.1 65.1 60.7 1809 101302 102.1 74.6 69.6 1720 101602 59.1 81.2 76.2 1541 101902 358.7 78.0 77.3 1251 102202 336.1 69.2 71.8 1038 102502 326.7 59.2 63.4 0932 102802 321.2 48.8 53.9 0857 UT GLon GLat ILat MLT a) c) b) d) e) f) g) h) 10:20 10:19 10:18 10:17
NO
AA
15
630.0 nm @ 10:19:00 UT NO AA 16 10 :20 10 :19 10 :21 10 :22TB
630.0 nm @ 10:20:00 UTi)
j)
1200 1300 1400 70 75 80 15 00 1200 1300 1400 70 75 80 15 00Fig. 7. Particle observations from the NOAA 15 and 16 spacecraft and the two trajectories overlaid on the 630-nm cusp aurora. Panels (a) and (e) show precipitating fluxes from four low-energy electron bands, and panels (c) and (g) from four ion bands. Panels (b) and (f) plot fluxes of energetic electrons, and panels (d) and (h) energetic ions. In these four panels (b, d, f, h) solid lines show precipitating fluxes and dashed lines show local mirroring fluxes. Panels (i) and (j) show the two spacecraft trajectories relative to images of the 630.0-nm aurora, the magnetic grid, and the EISCAT Svalbard radar’s field-of-view. In panel j the electron trapping boundary is indicated with TB.
of the cusp aurora. Poleward of the electron trapping bound-ary the electron energies were <200 eV (number flux de-creasing with latitude), and the ion number fluxes were mod-est for energies <1 keV and falling off with latitude for ener-gies >30 keV.
4 Discussion
The global two-cell convection pattern in the high-latitude ionosphere is believed to be driven by the process of mag-netic reconnection (Cowley and Lockwood, 1992). During periods of southward interplanetary magnetic field (IMF), dayside reconnection will produce open flux (Dungey, 1961). This open flux convects over the polar cap and exits by re-connection on the nightside of the magnetosphere. Origi-nally the production, circulation, and removal of magnetic flux in the polar cap were assumed to be steady-state. How-ever, after Russell (1972) sketched the ionospheric flow from a non-steady substorm cycle, dayside and nightside recon-nection have come to be viewed as two separate processes, giving non-steady flows in the high-latitude ionosphere. In this paper we focus on the high degree of temporal and spa-tial variation in the convection that when averaged leads to the standard southward IMF two-cell convection pattern in the cusp region and possibly in the polar cap.
Moen et al. (1995) reported pulsed large-scale convection associated with optical cusp events, and in the last couple of years there have been several studies linking flux transfer events observed by spacecraft near the magnetopause with flow enhancements in the ionosphere. It is also clear that FTEs do occur on many scale sizes. Using the Geotail space-craft McWilliams et al. (2004) estimated a cross section of 6– 7 RE for an FTE flux tube near the magnetopause, and Wild
et al. (2001, 2003) identified FTE perturbations in the mag-netic field at Cluster, followed by pulsed ionospheric flow in both hemispheres, extending over several hours in MLT. Milan et al. (2000) have also seen FTE auroral signatures ex-tending across 7 h of MLT. On the other hand, Marchaudon et al. (2004a) have reported a more localized FTE signature in the ionosphere (30–60 km east-west, and 300 km north-south) with a reasonably good match of the velocities, both at Cluster and in the ionosphere. This size is in excellent agreement with the case we present, where the flow channel is from 30 to 50 km wide in the north-south direction and at least 400 km in the east-west direction. However, our event is elongated in the east-west direction instead of the north-south direction, an orientation that appears to be consistent with other studies (e.g. Provan et al., 1998; Milan et al., 2000; McWilliams et al., 2001). Nevertheless, these studies indi-cate an elongated rather than a circular FTE cross section, and this has recently been confirmed by an in-situ Cluster study (Sonnerup et al., 2004).
Sonnerup et al. (2004) also estimated that the magnetic flux associated by the FTE flux tube on which they
re-port was 2 MWb. By multiplying the area of the flow
channel (50 km×400 km) with the magnetic field strength
(5×10⁴nT) an estimate for our FTE event gives us around 1 MWb, but our estimate should only be regarded as a min-imum. It is quite likely that FC4 in Fig. 3 extended beyond the ESR field-of-view in the east-west direction. It should also be noted that it can make a difference if one chooses to use the optical PMAF signature instead of the associated flow channel to determine the dimensions of an FTE flux tube. It is important to notice that the upward Birkeland current of the PMAF is associated with both 557.7-nm and 630.0-nm auroral emissions. Unfortunately, early studies (e.g. Lock-wood et al., 1989a, 1989b) postulated that the 557.7-nm emissions marked the region of the upward Birkeland cur-rent associated with the FTE, whilst the 630.0-nm emissions were present over a large region, suggesting bulk injection of soft particles over the entire area of newly-opened flux. How-ever, this suggestion was based on observations with a first generation all-sky TV camera that did not have the capabil-ity to resolve fine structure. Furthermore, optical data is, to a larger degree, dependent on the sensitivity threshold of the camera; a more sensitive camera may find the PMAF struc-ture to be wider. The ESR data in Fig. 3 also indicate that the FTE flow channel occupied a larger area than the PMAF. It should also be noted that the spatial resolution of the radar data is an essential factor to be able to resolve the flow chan-nels in Fig. 3. If the footprint of a relatively narrow FTE flux tube falls at the edge between two radar range gates, the flow channel may completely disappear (as each radar range gate contains flow filaments in opposite directions). The same is true if a single radar range gate is larger than the width of the flow channel. In other words, if the spatial resolution is poor, one may be misled to conclude that FTEs are a minor contributor to the polar cap potential, or that pulsed recon-nection is of less importance than it really is. It has also been suggested by Pinnock et al. (1995), Lockwood et al. (1995) and Milan et al. (2000) that several FTEs can occur at the edge of the cusp over several hours in MLT, and that FTEs in this manner can be a significant contributor to the cross-polar cap potential. It is clear that the spatial resolution of the mea-surements is a very critical factor, and with poor resolution the contribution from FTEs may be underestimated.
We can also estimate the duration of the ionospheric signa-ture of this particular FTE. Using the location of the 30 keV electron trapping boundary in Fig. 7 as a marker for the tran-sition between open and closed field lines (e.g. as in Moen et al., 1996; Oksavik et al., 2000) gives an open-closed field line boundary at 73.5◦ magnetic latitude around 10:20 UT.
Consequently, the NOAA data indicate that the cusp aurora was residing entirely on open field lines (both the main east-west elongated arc and the PMAF located further poleward). The structured plasma flow (FC1 to FC7) in Fig. 3 was also observed north of the open-closed field line boundary. These flow channels seemed to head poleward through the ESR field-of-view, one after the other. FC4 was the most distinct flow channel with prominent reverse flow on both sides, and a PMAF on its poleward side, as identified by Oksavik et al. (2004a). A close inspection of the ESR data shows that FC4 first appeared around 09:56 UT with its equatorward
10:00 10:01
10:02 10:03
10:04 10:05
10:06 10:07
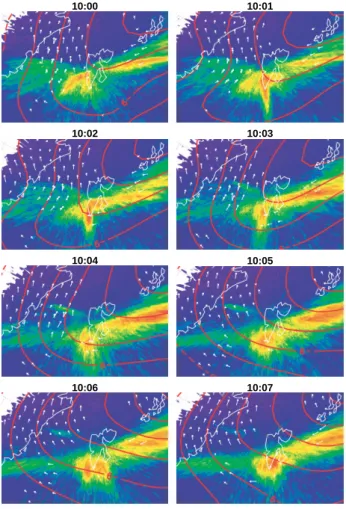
Fig. 8. Sequence of all-sky images of the 630-nm cusp aurora over-laid with the map-potential model output (red contours) and mea-sured flow vectors (white arrows) from the SuperDARN radar net-work.
edge at 74.3◦ magnetic latitude near 12:00 MLT. Around 10:04–10:05 UT the flow channel was located poleward of 77.3–77.5◦ magnetic latitude. The very last remnants of FC4 left the ESR field-of-view around 10:11 UT, just north of 78.2◦ magnetic latitude. This is also confirmed by the DMSP F13 observations (Fig. 6) with the guidance of the all-sky camera images (Fig. 4). Around 10:11 UT DMSP F13 detected a narrow region of sunward flow (Fig. 6e) sur-rounded by anti-sunward flow. From the all-sky images it is clear that this small-scale twin vortex pattern is indeed the FC4 flow channel that the ESR was tracking and is lo-cated very close to the fossil PMAF flux tube. Consequently, this gives a total duration of the ionospheric FTE signature of at least 15 minutes and a poleward motion of at least 4◦ in latitude, corresponding to a phase velocity of around 500 m/s. This number is also consistent with SuperDARN plasma convection data and the PMAF motion presented in Fig. 8. Shown with white arrows are measured flow vec-tors by the Finland and Iceland East SuperDARN radars, and overlaid with red is the contour output from the map-potential model (Ruohoniemi and Baker, 1998), where the
model suggests a total polar cap potential of 60–70 kV. The PMAF is seen in the left half (western part) of the image frames drifting into the polar cap in a direction, and with a velocity, similar to the background convection. Near the PMAF SuperDARN observed a poleward velocity of around 500 m/s, also consistent with the convection seen by DMSP F13. It should be noted that in Fig. 8 there are two vectors at a few locations because (1) one minute of data was used to generate the vectors, (2) the radars were running a scan, and (3) at some locations there are two measurements of the line-of-sight velocity for one of the radars.
This observation suggests that the FTE signature convects with the large-scale flow (Denig et al., 1993). The iono-spheric footprint of an FTE, i.e. the small twin-vortex flow feature that the Southwood (1987) model predicts, is not just a local disturbance near the convection reversal boundary. As time evolves and the twin-vortex flow feature propagates poleward into the polar cap, this small feature continues to disturb the background convection, at least on a spatial scale of a few tens of kilometers. Our observations also demon-strate that the flow disturbance from such individual FTEs may even be present in the local convection within the po-lar cap several minutes after the auroral intensity has faded below the detection threshold of a camera. It is well known that on a gross scale the dayside convection is highly vari-able near the convection reversal boundary, but in the polar cap the convection is thought to be mainly anti-sunward (e.g. Cowley and Lockwood, 1992; Shepherd et al., 2003). This is consistent with the appearance of FTEs; however, our com-prehensive data set shows that if the spatial resolution of the measurements is sufficient, one may observe that the unique FTE flow signatures persist a long time after the FTE flux tube opened. It is also obvious that the observational ge-ometry of the ESR (3-min scan looking west) is ideal to be able to monitor the temporal evolution of these flow chan-nels. There is also an element of good fortune involved in the timing of the scans tracking FC4, since the radar beam visited the flow channel around 10:03:30–10:05:30 UT when the PMAF was at its brightest. The second element of good fortune is the location of the DMSP F13 spacecraft trajectory (Fig. 6), confirming the persistence of the FTE flow pattern. It is also interesting to note that DMSP F13 revealed a 30– 40 km wide channel with net sunward flow associated with the FTE. This shows that even if the gross convection pattern appears to be anti-sunward in the polar cap during periods of southward IMF, individual FTEs are capable of driving the plasma sunward in localized areas of a few tens of kilome-ters. The FTE vortex feature might be thought of as spinning about a centre of gravity which moves antisunward. That the DMSP drift shows sunward flow around 10:11 UT is because the plasma is vortexing faster than the centre of motion, and so for a part of its vortex trajectory the plasma moves faster towards the Sun than the vortex centre is moving away from the Sun.
FTEs may also be the driver for the region 0 current sys-tem in the cusp. The Southwood (1987) model describes how a pair of Birkeland currents will be flowing at the edges of
an individual FTE flow channel. Lockwood et al. (1993) have also predicted that Birkeland currents will be flowing at the boundaries of successive FTEs. In agreement with the Southwood FTE model a recent paper by Marchaudon et al. (2004b) presents data from the Ørsted spacecraft of field-aligned currents on each side of a flow channel seen by SuperDARN. Our data set is also indicative of a fine-scale current system surrounding FC4; an upward current on the poleward side (consistent with the location of the PMAF), and a downward current on the equatorward side (consistent with the absence of electron aurora). Birkeland currents and the associated current carriers in the cusp region represent an area that is not well understood (Yamauchi et al., 1998). Iijima and Potemra (1976a,b) used magnetic field perturba-tions from the Triad spacecraft to study the large-scale cur-rent systems in the high-latitude ionosphere, and they intro-duced the region 1, region 2 and cusp currents. A decade later Erlandson et al. (1988) and Bythrow et al. (1988) sug-gested that the cusp current should be renamed the mantle current, due to the fact that it is usually observed on field lines that map to the plasma mantle poleward of the most in-tense magnetosheath-like electron precipitation. This is also confirmed by Stauning et al. (2001), using high-resolution measurements from the Danish Ørsted satellite, which sug-gests that the region 1 current is located in the LLBL equator-ward of the cusp (Woch et al., 1993). In a recent paper Ok-savik et al. (2004b) combined observations from the FAST spacecraft with ground-based optical images from Svalbard, and they found counterstreaming electrons associated with stepped cusp signatures and southward IMF cusp aurora. Furthermore, the cusp ion steps were associated with thin sheets of fine-scale field-aligned currents flowing near the edges of the ion steps, consistent with the predictions of Lockwood et al. (2001) for pulsed reconnection during pe-riods with large IMF By. All these studies in fact appear
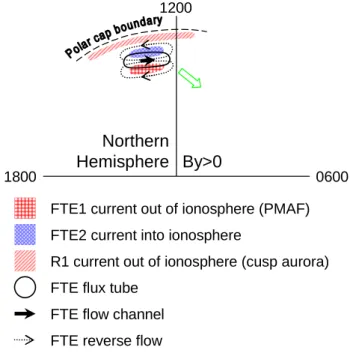
to relate the region 0 or cusp/mantle currents to FTEs. In Fig. 9 we present a sketch showing the location of these field-aligned currents relative to the polar cap boundary and the aurora for the case studied in this paper (Northern Hemi-sphere, IMF By>0 and Bz<0). The open-closed field line
boundary is indicated with a dashed line just equatorward of the east-west elongated background cusp aurora, consis-tent with the post-noon region 1 current flowing out of the ionosphere. The perimeter of the FTE flux tube (i.e. FC4 in Fig. 3) is encircled with a solid line. Located on the pole-ward edge of the FTE flow channel are the PMAF and the associated FTE1 current (flowing out of the ionosphere). On the equatorward side is the associated FTE2 current (flowing into the ionosphere). Whilst the region 1 current system is at a fixed location with respect to the open-closed field line boundary and the convection reversal, the FTE current sys-tem moves with the background convection into the polar cap as a “fossil” signature of FTEs. The westward and poleward motion of the FTE current system described in this paper is indicated with a green arrow. The FTE current system is con-sistent with the Southwood (1987) flux transfer model, and represents the temporal and spatial variability of the region
FTE1 current out of ionosphere (PMAF)
R1 current out of ionosphere (cusp aurora) FTE2 current into ionosphere
FTE flux tube FTE flow channel FTE reverse flow
Northern
Hemisphere By>0
1200
0600 1800
Fig. 9. Sketch showing the location of the FTE currents (former region 0) and the post-noon region 1 current relative to the polar cap
boundary and the aurora for the Northern Hemisphere IMF By>0
and Bz<0 case studied in this paper. The perimeter of the FTE flux
tube is encircled with a solid line, and the FTE current system is moving westward and poleward with the background convection, as indicated with the green arrow.
0 current. High-resolution radar sweeps, as presented here, provide the only means to map the spatial and temporal evo-lution of individual FTE flow disturbances, and hence the spatial distribution and motion of the associated current sys-tem. When we have achieved such a detailed observation of an event class reported in the literature for over two decades, we find it adequate to introduce a new term – FTE currents – that should be used strictly when describing such individual events. In the past most observations have been snapshots from passing spacecraft, giving only a spatial view of this highly temporal-varying poleward-moving small-scale cur-rent system.
5 Conclusion
In this paper we have presented a comprehensive set of ob-servations of the ionospheric footprint of an FTE using the EISCAT Svalbard radar, the SuperDARN HF radar network, ground-based optics, and three low-altitude polar orbiting spacecraft. During an interval of southward IMF the EIS-CAT Svalbard radar was tracking a train of narrow flow chan-nels drifting into the polar cap. One of these flow chanchan-nels was measured with unprecedented completeness. It was sur-rounded by reverse flow and joined by a PMAF on its pole-ward edge, consistent with a small-scale twin vortex flow pattern and field-aligned currents on the sides of the flow channel, a downward current on the equatorward side, and
an upward current on the poleward side (Southwood, 1987; Oksavik et al., 2004a). The high spatial resolution of the observations made it possible to track this particular flow channel and its persistence in time and space from where it was launched (equatorward of the cusp aurora) until it left the field-of-view some 15 minutes later and 4◦ of latitude deeper into the polar cap. On a gross scale the convection pattern across the polar cap may look like a two-cell pat-tern, however, on spatial scales of a few tens of kilometers one may see flow distortions due to individual FTEs super-imposed onto the background convection. The dimensions of the flow channel indicate that the magnetic flux of the event was at least 1 MWb. We also suggest that the Birkeland current filaments often seen by low-altitude spacecraft in the cusp/mantle are really associated with FTEs in progress. In order to put these high-resolution observations in contrast to classical region 0 or cusp/mantle currents inferred from satel-lites, we suggest the new term – FTE currents – to describe the Birkeland currents of individual flux transfer events.
Acknowledgements. EISCAT is an international association
sup-ported by Finland (SA), France (CNRS), Germany (MPG), Japan (NIPR), Norway (NFR), Sweden (NFR), and the United King-dom (PPARC). CUTLASS is supported by the UK Particle Physics and Astronomy Research Council (PPARC), the Swedish Insti-tute for Space Physics, and the Finnish Meteorological InstiInsti-tute in Helsinki. We thank the ACE Science Center and the ACE MAG and SWEPAM instrument teams for providing solar wind data from the ACE spacecraft. Financial support has been provided by the Nor-wegian Research Council, AFOSR task 2311AS, and NSF Grant ATM-0418101.
Topical Editor in chief thanks J. Rae and another referee for their help in evaluating this paper.
References
Baker, K. B., Dudeney, J. R., Greenwald, R. A., Pinnock, M., Newell, P. T., Rodger, A. S., Mattin, N., and Meng, C.-I.: HF radar signatures of the cusp and low-latitude boundary layer, J. Geophys. Res., 100, 7671–7696, 1995.
Bythrow, P. F., Potemra, T. A., Erlandson, R. E., Zanetti, L. J., and Klumpar, D. M.: Birkeland currents and charged particles in the high-latitude pre-noon region: A new interpretation, J. Geophys. Res., 93, 9791–9803, 1988.
Carlson, H. C., Oksavik, K., Moen, J., van Eyken, A. P., and Guio, P.: ESR mapping of polar-cap patches in the dark cusp, Geophys. Res. Lett., 29 (10), 1386, doi:10.1029/2001GL014087, 2002. Carlson, H. C., Oksavik, K., Moen, J., and Pedersen, T.:
Iono-spheric patch formation: Direct measurements of the origin of a polar cap patch, Geophys. Res. Lett., 31 (8), L08806, doi:10.1029/2003GL018166, 2004.
Chisham, G., Pinnock, M., and Rodger, A. S.: Poleward-moving HF radar flow bursts in the cusp: Transient changes in flow speed or direction?, Geophys. Res. Lett., 27, 919–922, 2000.
Chiu, M. C., Von-Mehlem, U. I., Willey, C. E., Betenbaugh, T. M., Maynard, J. J., Krein, J. A., Conde, R. F., Gray, W. T., Hunt Jr., J. W., Mosher, L. E., McCullough, M. G., Panneton, P. E., Staiger, J. P., and Rodberg, E. H.: ACE spacecraft, Space Sci. Rev., 86, 257–284, 1998.
Cowley, S. W. H. and Lockwood, M.: Excitation and decay of so-lar wind-driven flows in the magnetosphere-ionosphere system, Ann. Geophys., 10, 103–115, 1992.
Davies, J. A., Lester, M., Milan, S. E., and Yeoman, T. K.: A com-parison of velocity measurements from the CUTLASS Finland radar and the EISCAT UHF system, Ann. Geophys., 17, 892– 902, 1999,
SRef-ID: 1432-0576/ag/1999-17-892.
Davies, J. A., Yeoman, T. K., Lester, M., and Milan, S. E.: A com-parison of F-region ion velocity observations from the EISCAT Svalbard and VHF radars with irregularity drift velocity mea-surements from the CUTLASS Finland HF radar, Ann. Geo-phys., 18, 589–594, 2000,
SRef-ID: 1432-0576/ag/2000-18-589.
Davies, J. A., Yeoman, T. K., Rae, I. J., Milan, S. E., Lester, M., Lockwood, M., and McWilliams, A.: Ground-based observa-tions of the auroral zone and polar cap ionospheric responses to dayside transient reconnection, Ann. Geophys., 20, 781–794, 2002,
SRef-ID: 1432-0576/ag/2002-20-781.
Denig, W. F., Burke, W. J., Maynard, N. C., Rich, F. J., Jacobsen, B., Sandholt, P. E., Egeland, A., Leontjev, S., and Vorobjev, V. G.: Ionospheric signatures of dayside magnetopause transients: A case study using satellite and ground measurements, J. Geophys. Res., 98, 5969–5980, 1993.
Dungey, J.W.: Interplanetary magnetic field and the auroral zones, Phys. Rev. Lett., 6, 47–49, 1961.
Erlandson, R. E., Zanetti, L. J., Potemra, T. A., Bythrow, P. F., and Lundin, R.: IMF By dependence of region 1 Birkeland currents near noon, J. Geophys. Res., 93, 9804–9814, 1988.
Evans, D. S. and Greer, M. S.: Polar orbiting environmental satel-lite space environment monitor - 2: Instrument descriptions and archive data documentation, NOAA Technical Memorandum OAR SEC-93, Space Environment Center, Boulder, Colorado, 2000.
Glassmeier, K.-H. and Stellmacher, M.: Mapping flux transfer events to the ionosphere, Adv. Space Res., 18(8), 151–160, 1996. Goertz, C. K., Nielsen, E., Korth, A., Glassmeier, K. H., Hal-doupis, C., Hoeg, P., and Hayward, D.: Observations of a pos-sible ground signature of flux transfer events, J. Geophys. Res., 90, 4069–4078, 1985.
Greenwald, R. A., Baker, K. B., Hutchins, R. A., and Hanuise, C.: An HF phased-array radar for studying small-scale structure in the high-latitude ionosphere, Radio Science, 20, 63–79, 1985. Greenwald, R. A., Baker, K. B., Dudeney, J. R., Pinnock, M., Jones,
T. B., Thomas, E. C., Villain, J.-P., Cerisier, J.-C., Senior, C., Hanuise, C., Hunsucker, R. D., Sofko, G., Koehler, J., Nielsen, E., Pellinen, R., Walker, A. D. M., Sato, N., and Yamagishi, H.: DARN/SuperDARN a global view of the dynamics of high-latitude convection, Space Sci. Rev., 71, 761–796, 1995. Haerendel, G., Paschmann, G., Sckopke, N., Rosenbauer, H., and
Hedgecock, P. C.: The frontside boundary layer of the magne-tosphere and the problem of reconnection, J. Geophys. Res., 83, 3195–3216, 1978.
Hanuise, C., Villain, J. P., Gresillon, D., Cabrit, B., Greenwald, R. A., and Baker, K. B.: Interpretation of HF radar ionospheric Doppler spectra by collective wave scattering theory, Ann. Geo-phys., 11, 29–39, 1993.
Hardy, D. A., Schmidt, L. K., Gussenhoven, M. S., Marshall, F. J., Yeh, H. C., Schumaker, T. L., Huber, A., and Pan-tazis, J.: Precipitating electron and ion detectors (SSJ/4) for the block, 5D/Flights 4–10 DMSP satellites: Calibration and data
presentation, Rep. AFGL-TR-84-0317, Air Force Geophys. Lab., Hanscom Air Force Base, Mass., 1984.
Iijima, T. and Potemra, T. A.: The amplitude distribution of field aligned currents at northern high latitudes observed by Triad, J. Geophys. Res., 81, 2165–2174, 1976a.
Iijima, T. and Potemra, T. A.: Field-aligned currents in the dayside cusp observed by Triad, J. Geophys. Res., 81, 5971–5979, 1976b. Lockwood, M., Sandholt, P. E., and Cowley, S. W. H.: Dayside auroral activity and magnetic flux transfer from the solar wind, Geophys. Res. Lett., 16, 33–36, 1989a.
Lockwood, M., Sandholt, P. E., Cowley, S. W. H., and Oguti, T.: Interplanetary magnetic field control of dayside auroral activity and the transfer of momentum across the dayside magnetopause, Planet. Space Sci., 37, 1347–1365, 1989b.
Lockwood, M., Carlson Jr., H. C., and Sandholt, P. E.: Implications of the altitude of transient 630-nm dayside auroral emissions, J. Geophys. Res., 98, 15 571–15 587, 1993.
Lockwood, M., Cowley, S. W. H., Smith, M. F., Rijnbeek, R. P., and Elphic, R. C.: The contribution of flux transfer events to convection, Geophys. Res. Lett., 22, 1185–1188, 1995. Lockwood, M., Milan, S. E., Onsager, T., Perry, C. H., Scudder,
J. A., Russell, C. T., and Brittnacher, M.: Cusp ion steps, field aligned currents and poleward moving auroral forms, J. Geophys. Res., 106, 29 555–29 569, 2001.
Mandea, M. and S. Macmillan: International Geomagnetic Ref-erence Field – the eighth generation, Earth Planets Space, 52, 1119–1124, 2000.
Marchaudon, A., Cerisier, J.-C., Bosqued, J.-M., Dunlop, M. W., Wild, J. A., D´ecr´eau, P. M. E., F¨orster, M., Fontaine, D., and Laakso, H.: Transient plasma injections in the dayside magne-tosphere: one-to-one correlated observations by Cluster and Su-perDARN, Ann. Geophys., 22, 141–158, 2004a,
SRef-ID: 1432-0576/ag/2004-22-141.
Marchaudon, A., Cerisier, J.-C., Greenwald, R. A., and Sofko, G. J.: Electrodynamics of a flux transfer event: Experimental test of the Southwood model, Geophys. Res. Lett., 31, L09809, doi:10.1029/2004GL019922, 2004b.
McComas, D. J., Bame, S. J., Barker, P., Feldman, W. C., Phillips, J. L., Riley, P., and Griffee, J. W.: Solar Wind Electron Proton Alpha Monitor (SWEPAM) for the Advanced Composition Ex-plorer, Space Sci. Rev., 86, 563–612, 1998.
McWilliams, K. A., Yeoman, T. K., and Provan, G.: A statistical survey of dayside pulsed ionospheric flows as seen by the CUT-LASS Finland HF radar, Ann. Geophys., 18, 445–453, 2000, SRef-ID: 1432-0576/ag/2000-18-445.
McWilliams, K. A., Yeoman, T. K., and Cowley, S. W. H.: Two-dimensional electric field measurements in the ionospheric foot-print of a flux transfer event, Ann. Geophys., 18, 1584–1598, 2001,
SRef-ID: 1432-0576/ag/2000-18-1584.
McWilliams, K. A., Sofko, G. J., Yeoman, T. K., Milan, S. E., Sibeck, D. G., Nagai, T., Mukai, T., Coleman, I. J., Hori, T., and Rich, F. J.: Simultaneous observations of magnetopause flux transfer events and of their associated signatures at ionospheric altitudes, Ann. Geophys., 22, 2181–2199, 2004,
SRef-ID: 1432-0576/ag/2004-22-2181.
Milan, S. E., Yeoman, T. K., Lester, M., Thomas, E. C., and Jones, T. B.: Initial backscatter occurrence statistics from the CUT-LASS HF radars, Ann. Geophys., 15, 703–718, 1997,
SRef-ID: 1432-0576/ag/1997-15-703.
Milan, S. E., Yeoman, T. K., and Lester, M.: The dayside auroral zone as a hard target for coherent HF radars, Geophys. Res. Lett.,
25, 3717–3720, 1998.
Milan, S. E., Lester, M., Cowley, S. W. H., Moen, J., Sandholt, P. E., and Owen, C. J.: Meridian-scanning photometer observations of the cusp: a case study, Ann. Geophys., 17, 159–172, 1999a, SRef-ID: 1432-0576/ag/1999-17-159.
Milan, S. E., Yeoman, T. K., Lester, M., Moen, J., and Sandholt, P. E.: Post-noon two-minute period pulsating aurora and their relationship to the dayside convection pattern, Ann. Geophys., 17, 877–891, 1999b,
SRef-ID: 1432-0576/ag/1999-17-877.
Milan, S. E., Lester, M., Cowley, S. W. H., and Brittnacher, M.: The convection and auroral response to a southward turning of the IMF: POLAR UVI, CUTLASS, and IMAGE signatures of transient magnetic flux transfer at the magnetopause, J. Geophys. Res., 105, 15 741–15 755, 2000.
Moen, J., Sandholt, P. E., Lockwood, M., Denig, W. F., Løvhaug, U. P., Lybekk, B., Egeland, A., Opsvik, D., and Friis-Christensen, E.: Events of enhanced convection and related dayside auroral activity, J. Geophys. Res., 100, 23 917–23 934, 1995.
Moen, J., Evans, D., Carlson, H. C., and Lockwood, M.: Dayside moving auroral transients related to LLBL dynamics, Geophys. Res. Lett., 23, 3247–3250, 1996.
Moen, J., van Eyken, A. P., and Carlson, H. C.: EISCAT Svalbard Radar observations of ionospheric plasma dynamics in relation to dayside auroral transients, J. Geophys. Res., 106, 21 453–21 461, 2001a.
Moen, J., Carlson, H. C., Milan, S. E., Shumilov, N., Lybekk, B., Sandholt, P. E., and Lester, M., On the collocation between day-side auroral activity and coherent HF radar backscatter, Ann. Geophys., 18, 1531–1549, 2001b.
Neudegg, D. A., Yeoman, T. K., Cowley, S. W. H., Provan, G., Haerendel, G., Baumjohann, W., Auster, U., Fornacon, K.-H., Georgescu, E., and Owen, C. J.: A flux transfer event observed at the magnetopause by the Equator-S spacecraft and in the iono-sphere by the CUTLASS HF radar, Ann. Geophys., 17, 707–711, 1999,
SRef-ID: 1432-0576/ag/1999-17-707.
Neudegg, D. A., Cowley, S. W. H., Milan, S. E., Yeoman, T. K., Lester, M., Provan, G., Haerendel, G., Baumjohann, W., Nikutowski, B., B¨uchner, J., Auster, U., Fornacon, K.-H., and Georgescu, E.: A survey of magnetopause FTEs and associated flow bursts in the polar ionosphere, Ann. Geophys., 18, 416–435, 2000,
SRef-ID: 1432-0576/ag/2000-18-416.
Newell, P. T. and Meng, C.-I.: Mapping the dayside ionosphere to the magnetosphere according to particle-precipitation character-istics, Geophys. Res. Lett., 19 (6): 609–612, 1992.
Oksavik, K., Søraas, F., Moen, J., and Burke, W. J.: Optical and particle signatures of magnetospheric boundary layers near mag-netic noon: Satellite and ground-based observations, J. Geophys. Res., 105, 27 555–27 568, 2000.
Oksavik, K., Moen, J., and Carlson, H. C.: High-resolution observa-tions of the small-scale flow pattern associated with a poleward moving auroral form in the cusp, Geophys. Res. Lett., 31(11), L11807, doi:10.1029/2004GL019838, 2004a.
Oksavik, K., Søraas, F., Moen, J., Pfaff, R., Davies, J. A., and Lester, M.: Simultaneous optical, CUTLASS HF radar, and FAST spacecraft observations: Signatures of boundary layer pro-cesses in the cusp, Ann. Geophys., 22(2), 511–525, 2004b, SRef-ID: 1432-0576/ag/2004-22-511.
Pinnock, M., Rodger, A. S., Dudeney, J. R., Baker, K. B., Newell, P. T., Greenwald, R. A., and Greenspan, M. E.: Observations of an
enhanced convection channel in the cusp ionosphere, J. Geophys. Res., 98, 3767–3776, 1993.
Pinnock, M., Rodger, A. S., Dudeney, J. R., Rich, F., and Baker, K. B.: High spatial and temporal resolution observations of the ionospheric cusp, Ann. Geophys., 13, 919–925, 1995,
SRef-ID: 1432-0576/ag/1995-13-919.
Provan, G. and T. K. Yeoman: Statistical observations of the MLT, latitude and size of pulsed ionospheric flows with the CUTLASS Finland radar, Ann. Geophys., 17, 855–867, 1999,
SRef-ID: 1432-0576/ag/1999-17-855.
Provan, G., Yeoman, T. K., and Milan, S. E.: CUTLASS Finland radar observations of the ionospheric signature of flux transfer events and the resulting plasma flow, Ann. Geophys., 16, 1411– 1422, 1998,
SRef-ID: 1432-0576/ag/1998-16-1411.
Provan, G., Milan, S. E., Lester, M., Yeoman, T. K., and Khan, H.: Simultaneous observations of the ionospheric footprint of flux transfer events and dispersed ion signatures, Ann. Geophys., 20, 281–287, 2002,
SRef-ID: 1432-0576/ag/2002-20-281.
Rae, I. J., Fenrich, F. R., Lester, M., McWilliams, K. A., and Scud-der, J. D.: Solar wind modulation of cusp particle signatures and their associated ionospheric flows, J. Geophys. Res., 109, A03223, doi:10.1029/2003JA010188, 2004.
Rich, F. J. and Hairston, M.: Large-scale convection patterns ob-served by DMSP, J. Geophys. Res., 99, 3827–3844, 1994. Ruohoniemi, J. M., Greenwald, R. A., Baker, K. B., Villain, J. P.,
and McCready, M. A.: Drift motions of small-scale irregularities in the high-latitude F region: An experimental comparison with plasma drift motions, J. Geophys. Res., 92, 4553–4564, 1987. Ruohoniemi, J. M. and Baker, K. B.: Large-scale imaging of
high-latitude convection with Super Dual Auroral Radar Network HF radar observations, J. Geophys. Res., 103, 20 797–20 811, 1998. Russell, C. T.: The configuration of the magnetosphere, in Critical Problems of Magnetospheric Physics, (Ed.) Dyer, E. R., 1–16, IUCSTP Secretariat, c/o National Academy of Sciences, Wash-ington, D. C., 1972.
Russell, C. T. and Elphic, R. C.: Initial ISEE magnetometer results: magnetopause observations, Space Sci. Rev., 22, 681–715, 1978. Russell, C. T. and Elphic, R. C.: ISEE observations of flux transfer events at the dayside magnetopause, Geophys. Res. Lett., 6, 33– 36, 1979.
Sandholt, P. E., Lockwood, M., Oguti, T., Cowley, S. W. H., Free-man, K. S. C., Lybekk, B., Egeland, A., and Willis, D. M.: Mid-day auroral breakup events and related energy and momentum transfer from the magnetosheath, J. Geophys. Res., 95, 1039– 1060, 1990.
Sandholt, P. E., Moen, J., Opsvik, D., Denig, W. F., and Burke, W. J.: Auroral event sequence at the dayside polar cap boundary: signature of time-varying solar wind-magnetosphere-ionosphere coupling, Adv. Space. Res., 13, (4)7–15, 1993.
Saunders, M. A., Russell, C. T., and Sckopke, N.: Flux transfer events: scale size and interior structure, Geophys. Res. Lett., 11, 131–134, 1984.
Shepherd, S. G., Ruohoniemi, J. M., and Greenwald, R. A.: Direct measurements of the ionospheric convection variabil-ity near the cusp/throat, Geophys. Res. Lett., 30(21), 2109, doi:10.1029/2003GL017668, 2003.
Smith, C. W., L’Heureux, J., Ness, N. F., Acu˜na ,M. H., Burlaga, L. F., and Scheifele, J.: The ACE magnetic fields experiment, Space Sci. Rev., 86, 613–632, 1998.
Sonnerup, B. U. ¨O., Hasegawa, H., and Paschmann, G., Anatomy
of a flux transfer event seen by Cluster, Geophys. Res. Lett., 31, L11803, doi:10.1029/2004GL020134, 2004.
Southwood, D. J.: Theoretical aspects of
ionosphere-magnetosphere-solar wind coupling, Adv. Space Res., 5(4), 7–14, 1985.
Southwood, D. J.: The ionospheric signature of flux transfer events, J. Geophys. Res., 92, 3207–3213, 1987.
Southwood, D. J. and Hughes, W. J.: Theory of hydromagnetic waves in the magnetosphere, Space Sci. Rev., 35, 301–366, 1983. Stauning, P., Primdahl, F., Watermann, J., and Rasmussen, O.: IMF By-related cusp currents observed from the Ørsted satellite and from ground, Geophys. Res. Lett., 28, 99–102, 2001.
Thorolfsson, A., Cerisier, J.-C., Lockwood, M., Sandholt, P. E., Senior, C., and Lester, M.: Simultaneous optical and radar sig-natures of poleward-moving auroral forms, Ann. Geophys., 18, 1054–1066, 2000,
SRef-ID: 1432-0576/ag/2000-18-1054.
van Eyken, A. P., Rishbeth, H., Willis, D. M., and Cowley, S. W. H.: Initial EISCAT observations of plasma convection at invariant
latitudes 70◦–77◦, J. Atm. Terr. Phys, 46, 635–641, 1984.
Villain, J. P., Caudal, G., and Hanuise, C.: A SAFARI-EISCAT comparison between the velocity of F region small-scale irregu-larities and the ion drift, J. Geophys. Res., 90, 8433–8443, 1985. Wild, J. A., Cowley, S. W. H., Davies, J. A., Khan, H., Lester, M., Milan, S. E., Provan, G., Yeoman, T. K., Balogh, A., Dunlop, M. W., Fornacon, K.-H., and Georgescu, E.: First simultaneous observations of flux transfer events at the high-latitude magne-topause by the Cluster spacecraft and pulsed radar signatures in the conjugate ionosphere by the CUTLASS and EISCAT radars, Ann. Geophys., 19, 1491–1508, 2001,
SRef-ID: 1432-0576/ag/2001-19-1491.
Wild, J. A., Milan, S. E., Cowley, S. W. H., Dunlop, M. W., Owen, C. J., Bosqued, J. M., Taylor, M. G. G. T., Davies, J. A., Lester, M., Sato, N., Yukimatu, A. S., Fazakerley, A. N., Balogh, A., and R`eme, H.: Coordinated interhemispheric SuperDARN radar observations of the ionospheric response to flux transfer events observed by the Cluster spacecraft at the high-latitude magne-topause, Ann. Geophys., 21, 1807–1826, 2003,
SRef-ID: 1432-0576/ag/2003-21-1807.
Woch, J., Yamauchi, M., Lundin, R., Potemra, T. A., and Zanetti, L. J.: The low-latitude boundary layer at mid-altitudes: Relation to large-scale Birkeland currents, Geophys. Res. Lett., 20, 2251– 2254, 1993.
Yamauchi, M., Lundin, R., Eliasson, L., Ohtani, S., and Clemmons, J. H.: Relationship between large-, meso-, and small-scale field aligned currents and their current carriers, in: Polar Cap Bound-ary Phenomena, (Eds.) Moen, J., Egeland, A., and Lockwood, M., 173, Kluwer Acad., Norwell, Mass., 1998.