HAL Id: hal-02993414
https://hal.archives-ouvertes.fr/hal-02993414
Submitted on 6 Nov 2020
HAL is a multi-disciplinary open access
archive for the deposit and dissemination of
sci-entific research documents, whether they are
pub-lished or not. The documents may come from
teaching and research institutions in France or
abroad, or from public or private research centers.
L’archive ouverte pluridisciplinaire HAL, est
destinée au dépôt et à la diffusion de documents
scientifiques de niveau recherche, publiés ou non,
émanant des établissements d’enseignement et de
recherche français ou étrangers, des laboratoires
publics ou privés.
The Blue Compact Dwarf Galaxy VCC 848 Formed by
Dwarf–Dwarf Merging: H i Gas, Star Formation, and
Numerical Simulations
Hong-Xin Zhang, Rory Smith, Se-Heon Oh, Sanjaya Paudel, Pierre-Alain
Duc, Alessandro Boselli, Patrick Côté, Laura Ferrarese, Yu Gao, Deidre
Hunter, et al.
To cite this version:
Hong-Xin Zhang, Rory Smith, Se-Heon Oh, Sanjaya Paudel, Pierre-Alain Duc, et al.. The Blue
Compact Dwarf Galaxy VCC 848 Formed by Dwarf–Dwarf Merging: H i Gas, Star Formation, and
Numerical Simulations. The Astrophysical Journal, American Astronomical Society, 2020, 900 (2),
pp.152. �10.3847/1538-4357/abab96�. �hal-02993414�
Typeset using LATEX twocolumn style in AASTeX63
The Blue Compact Dwarf Galaxy VCC 848 Formed by Dwarf-Dwarf Merging: Hi Gas, Star Formation and Numerical Simulations
Hong-Xin Zhang,1, 2 Rory Smith,3Se-Heon Oh,4Sanjaya Paudel,5 Pierre-Alain Duc,6 Alessandro Boselli,7
Patrick Cˆot´e,8 Laura Ferrarese,8Yu Gao,9, 10 Deidre A. Hunter,11 Thomas H. Puzia,12 Eric W. Peng,13, 14
Yu Rong,12 Jihye Shin,3 and Yinghe Zhao15
1Key Laboratory for Research in Galaxies and Cosmology, Department of Astronomy, University of Science and Technology of China, Hefei, Anhui 230026, China
2School of Astronomy and Space Science, University of Science and Technology of China, Hefei, Anhui 230026, China 3Korea Astronomy and Space Science Institute (KASI), 776 Daedeokdae-ro, Yuseong-gu, Daejeon 34055, Republic of Korea
4Department of Physics and Astronomy, Sejong University, 209 Neungdong-ro, Gwangjin-gu, Seoul, Republic of Korea 5Department of Astronomy and Center for Galaxy Evolution Research, Yonsei University, Seoul 03722, Republic of Korea
6Universit de Strasbourg, CNRS, Observatoire astronomique de Strasbourg, UMR 7550, F-67000 Strasbourg, France 7Aix Marseille Universit, CNRS, LAM (Laboratoire dAstrophysique de Marseille) UMR 7326, F-13388 Marseille, France 8National Research Council of Canada, Herzberg Astronomy and Astrophysics Program, 5071 West Saanich Road, Victoria, BC V9E
2E7, Canada
9Department of Astronomy, Xiamen University, Xiamen, Fujian 361005, China
10Purple Mountain Observatory, Chinese Academy of Sciences, 10 Yuanhua Road, Nanjing 210023, China 11Lowell Observatory, 1400 West Mars Hill Road, Flagstaff, AZ 86001, USA
12Instituto de Astrofsica, Pontificia Universidad Catlica de Chile, 7820436 Macul, Santiago, Chile 13Department of Astronomy, Peking University, Beijing 100871, China
14Kavli Institute for Astronomy and Astrophysics, Peking University, Beijing 100871, China 15Yunnan Observatories, Chinese Academy of Sciences, Kunming 650011, China
(Accepted July 30, 2020) Accepted to ApJ
ABSTRACT
A clear link between a dwarf-dwarf merger event and enhanced star formation (SF) in the recent pastwas recently identified in the gas-dominated merger remnant VCC 848, offering by far the clearest view of a gas-rich late-stage dwarf-dwarf merger. We present a joint analysis of JVLA H i emission-line mapping, optical imaging and numerical simulations of VCC 848, in order to examine the impact of the merger on the stellar and gaseous distributions. VCC 848 has less than 30% of its H i gas concentrated within the central high-surface-brightness star-forming region, while the remaining H i is entrained in outlying tidal features. Particularly, a well-defined tidal arm reaches N (H i) comparable to the galaxy center but lacks SF. The molecular gas mass inferred from the current SF rate (SFR) dominates over the atomic gas mass in the central∼ 1.5 kpc. VCC 848 is consistent with being a main-sequence star-forming galaxy for its current stellar mass and SFR. The H ii region luminosity distribution largely agrees with that of normal dwarf irregulars with similar luminosities, except that the brightest H ii re-gion is extraordinarily luminous. Our N -body/hydrodynamical simulations imply that VCC 848 is a merger between a gas-dominated primary progenitor and a gas-bearing star-dominated secondary. The progenitors had their first passage on a near-radial non-coplanar orbit more than 1 Gyr ago. The merger did not build up a core as compact as typical compact dwarfs with centralized starburst, which may be partly ascribed to the star-dominated nature of the secondary, and in a general sense, a negative stellar feedback following intense starbursts triggered at early stages of the merger.
Keywords: galaxies: evolution — galaxies: dwarf — galaxies: starburst — galaxies: interactions — galaxies: ISM — galaxies: kinematics and dynamics — galaxies: individual(VCC 848) 1. INTRODUCTION
In the standard Λ cold dark matter (ΛCDM) paradigm, dark matter halos, together with visible galaxies sitting close to their centers, assemble hierar-chically under the influence of gravity. Galaxy mergers, especially those involving gas-rich galaxies of compara-ble masses (i.e. “wet” major mergers with primary-to-secondary mass ratios . 4), can dramatically change galaxy morphologies (e.g. Toomre & Toomre 1972;
Barnes & Hernquist 1991;Mihos & Hernquist 1994),
en-hance star formation activities (e.g. Sanders & Mirabel
1996;Mihos & Hernquist 1996;Duc et al. 1997;Zhang et
al. 2010;Luo et al. 2014;Cibinel et al. 2019) and trigger
active galactic nuclei (e.g.Ellison et al. 2011;Treister et
al. 2012;Weston et al. 2017) in short timescales.
Obser-vational studies in the past decade have established that the galaxy merger rates increase steadily with redshift at least up to z ∼ 2-3 (e.g. Lotz et al. 2011;
Lopez-Sanjuan et al. 2015; Mundy et al. 2017; Duncan et al.
2019;Ventou et al. 2019).
Although galaxy merging events in the local universe are not as common as in the early universe, nearby galaxy mergers provide unique laboratories for detailed investigations of the influence of merging process on galaxy evolution. A vast majority of studies of galaxy mergers so far have focused on relatively massive galax-ies, while mergers between dwarf galaxies (M? < 109 M ) received little attention until very recently, which is partly due to the limited depth of most existing sur-veys. Being close to the bottom of the hierarchical struc-ture formation, dwarf galaxy mergers are expected to be more common than their massive counterparts. Recent cosmological zoom-in simulations suggest that about 10%-20% of Local Group satellite galaxies with M? > 106 M
have experienced a major merger event since z = 1 (Deason et al. 2014).
The first systematic study of gas-rich dwarf-dwarf in-teracting pairs was presented byStierwalt et al.(2015), who found that most of their isolated dwarf pairs are as gas-rich as unpaired dwarfs of similar stellar masses, and that the current star formation rate (SFR) of dwarf pairs is enhanced by a factor of∼ 2 on average at rel-atively small projected separations, similar to what has been found for massive galaxy pairs (e.g. Ellison et al.
2013; Silva et al. 2018; Pearson et al. 2019). Pearson
et al. (2016) further showed that dwarfs involved in
in-teracting pairs tend to have more extended atomic gas distribution than their unpaired analogues. By searching
for low surface brightness merger signatures,Paudel et
al.(2018a) compiled a catalog of 177 relatively low mass
merger candidates (M?< 1010M ), most of which turn out to be star-forming galaxies.Kado-Fong et al.(2020) found that 15%-20% of nearby dwarf galaxies with ex-treme starburst activities show signs of tidal debris. In addition to the above relatively systematic studies, a few more case studies of gas-rich dwarf pairs have also been carried out (Annibali et al. 2016; Privon et al.
2017; Paudel & Sengupta 2017b; Paudel et al. 2018b;
Makarova et al. 2018;Johnston et al. 2019).
Previous studies of gas-rich dwarf pairs are biased to-ward systems at relatively early merging stages (e.g.
Stierwalt et al. 2015). It remains unclear how
dwarf-dwarf merging events impact the overall star formation activities and re-shape the gaseous and stellar distribu-tions of the merger remnants. Particularly, it has long been conjectured that many blue compact dwarf galax-ies (BCD), which are characterized by having bluer col-ors, more intense star formation activities and unusually higher central surface brightness compared to ordinary dwarf irregular galaxies (e.g. Gil de Paz et al. 2003), might be formed through gas-rich dwarf-dwarf merging (e.g., van Zee et al. 1998;Noeske et al. 2001; Ostlin et
al. 2001; Bekki 2008; Lelli et al. 2012, 2014; Watts &
Bekki 2016). Other plausible formation mechanisms for
the compact stellar distributions of BCDs include inspi-raling of giant star formation clumps driven by dynami-cal friction (Elmegreen, Zhang & Hunter 2012) and cen-tral starburst sustained by pristine gas accretion from the local environs or even the cosmic web (e.g.
John-son et al. 2012;Lopez-Sanchez et al. 2012;Ashley et al.
2014;Verbeke et al. 2014). BCD galaxies are the closest
local analogues to UV-luminous galaxies such as Lyman break galaxies and Lyα emitters detected at high red-shift (e.g., Gawiser et al. 2007; Finkelstein et al. 2011;
Shibuya et al. 2019). It is generally difficult to
differ-entiate the above mentioned formation mechanisms for BCDs and other starburst dwarf galaxies, partly due to the often morphologically irregular appearance of star-forming dwarf galaxies.
In a recent work (Zhang et al. 2020, hereafter Paper I), we report a discovery of remarkably extended stel-lar shells around the BCD galaxy VCC 848 located in the outskirts of the Virgo cluster, based on deep optical imaging data from the Next Generation Virgo Cluster Survey (NGVS; Ferrarese et al. 2012). This discovery confirms that VCC 848 is the remnant of a merger
be-tween dwarf galaxies. VCC 848 is perhaps the clearest known example of a star-forming dwarf galaxy resulting from a gas-rich merger. Paper I shows that VCC 848 is likely formed by merging between two dwarf galaxies with comparable masses within a factor of a few, and the merging event has significantly enhanced the star formation activities in the past∼ 1 Gyr. In the rest of the current paper, we present interferometric observa-tions of H i gas in VCC 848, study the recent star for-mation activities and discuss the merging process by in-voking numerical simulations. Some relevant properties of VCC 848, which are either from the literature or de-rived in this work, are summarized in Table1. Through-out this paper, we adopt a distance of 16.5 Mpc for VCC 848 (Mei et al. 2007;Blakeslee et al. 2009) and use the
Schlafly & Finkbeiner(2011) Galactic extinction map to
correct the photometry.
2. OBSERVATIONS AND DATA REDUCTION 2.1. Optical and Far-infrared Images
Broadband u-, g-, i-, and z-band images of VCC 848 were obtained by NGVS with the MegaCam in-strument on the Canada-France-Hawaii Telescope. With a dedicated data acquisition strategy and processing pipeline, the NGVS reaches a 2σ surface brightness limit of µg ' 29 mag arcsec−2. The processed NGVS images have a pixel scale of 0.00186. The full width at half maxi-mums (FWHM) of the point spread function (PSF) are 0.0078, 0.0071, 0.0053, and 0.0062, respectively, for the u, g, i, and z passbands of the VCC 848 field. An in-depth analysis of these broadband images of VCC 848 has been presented in Paper I.
Narrow-band Hα imaging of VCC 848 was obtained with the Las Campanas 100-inch du Pont telescope by
Gil de Paz et al.(2003), as part of a large imaging
ob-servational campaign for nearby BCDs. The total expo-sure time for VCC 848 was 45 minutes and the seeing FWHM was∼ 1.004 (pixel scale = 0.0026).Gil de Paz et al. (2003) did continuum subtraction of their narrow-band images by using the R broadband images. We correct the continuum-subtracted fluxes for the contamination of [N ii] lines by adopting a [N ii]λ6584/Hα line ratio of 0.069 determined byVilchez et al.(2003).
Archival far-UV (FUV) image from the Galaxy Evolu-tion Explorer(GALEX) All-sky Imaging survey is avail-able for VCC 848. With an exposure time of 112s, the FUV emission is detected only in the central high sur-face brightness region of VCC 848, and the integrated FUV magnitude is 16.9 ± 0.05 (Voyer et al. 2014). We do not use the shallow FUV image in the work, except that we calculate an integrated SFR by combining the
FUV (corrected for the Galactic extinction) and infrared (see below) photometry (Table1).
HerschelPhotodetector Array Camera and Spectrom-eter (PACS) 100 µm, 160 µm and Spectral and Pho-tometric Imaging Receiver (SPIRE) 250 µm, 350 µm, 500 µm observations of VCC 848 were presented by
Grossi et al.(2015), as part of the Herschel Virgo
Clus-ter Survey (Auld et al. 2013). Among these far-infrared (FIR) images, the PACS 100 µm has the highest spatial resolution (FWHM = 9.004), and more importantly has been shown to be the most reliable monochromatic es-timator of total IR (TIR) luminosity among all of the Spitzer or Herschel wavebands, with a scatter of 0.05 dex (Galametz et al. 2013). We will therefore use the 100 µm image to evaluate the contribution of obscured star formation to the total star formation budget at local scales of VCC 848 .
2.2. JVLA H i Emission Line Mapping 2.2.1. Observations
VCC 848 was observed in B, C, and D array configu-rations of the Jansky Very Large Array (JVLA;Perley
et al. 2011) radio interferometer. The observations were
performed in the 1-2 GHz L-band (primary beam' 300) through multiple scheduling blocks (SBs) between 2016 May and 2017 Apr (Project ID: 16A-074; PI: Zhang; Table2). The JVLA WIDAR correlator was configured with two 1-GHz baseband IF pairs (A0/C0 and B0/D0) and the 8-bit sampler. The correlator integration time is 3 seconds. Each baseband was divided into 22 sub-bands with dual polarization products (RR and LL) each. Only one 4 MHz wide sub-band of the A0/C0 baseband was used for H i emission line observations presented in this paper. The 4 MHz sub-band was tuned to a central fre-quency corresponding to the systemic velocity of VCC 848. By using a recirculation factor of 4, the 4-MHz wide sub-band consists of 512 spectral channels, with a chan-nel width of 7.81kHz (∼1.7 km s−1 for a rest frequency of 1420.4 MHz).
Each SB of our observations began and ended with a 10- to 15-minute scan on the primary flux calibrator 3C286. The primary flux calibrator was used to calibrate the flux scale and bandpass. In between the observa-tions of the primary flux calibrator, the phase calibrator J1254+1141 was observed for 5-6 minutes before and af-ter each scan (10-25 minutes) on our target galaxy. VCC 848 was observed for a total on-source time of 4.0 hrs in the B array, 2.0 hrs in the C array, and 0.9 hrs in the D array (Table2).
2.2.2. Calibration
The multi-configuration data sets from the spectral line sub-band were calibrated and imaged using the
Table 1. Properties of VCC 848
Property Value Reference
Other name . . . A1223+06 · · · Morphological classification iI,M BCD 1 Distance . . . 16.5 Mpc 2 Heliocentric radial velocity. . . 1532 km s−1 This work
Angular distance from M87 . . . 6.7◦ · · · Angular distance from M49 . . . 2.4◦ · · · Absolute B magnitude . . . −16.05 mag b 1 Absolute g magnitude . . . −16.46 mag This work (g− i) color . . . 0.46 mag This work 12+log(O/H) . . . 8.03 3 i-band scale length of stellar main body 0.67 kpc This work µ0,g. . . 20.8 mag arcsec−2 a This work
µ0,g− µ0,i. . . 0.3 maga This work
Stellar mass . . . 2.1× 10⁸ M
This work
H i mass . . . 4.2× 10⁸ M
b 4
Vmax. . . 41.5 km s−1 This work
Radius of Vmax. . . 1.6 kpc This work
Hα luminosity . . . 3.9× 1039ergs s−1 b
1 Total IR luminosity . . . 4.0× 10⁷ L
b,c 5
SFRFUV+IR. . . 0.025 M yr−1 d This work
SFRHα+IR. . . 0.023 M yr−1 d This work
SFRIR. . . 0.002 M yr−1 d This work
aCentral surface brightness and color measured within the central 1 arcsec in semi-major axis
b Value has been adjusted to our adopted distance
c Total IR luminosity derived by combining the Herschel 100 µm, 160 µm and 250 µm photometry ofGrossi et al.(2015), following the recipe of Galametz et al.(2013)
dSFR derived from the observed FUV, Hα or IR luminosity by adopting equa-tions 8 and 10 ofCatalan-Torrecilla et al.(2015)
References: (1)Gil de Paz et al. 2003; (2)Mei et al. 2007;Blakeslee et al. 2009; (3)Vilchez et al. 2003;Lee et al. 2003;Zhao et al. 2013; (4)Haynes et al. 2011; (5)Grossi et al. 2015
CASA software package (McMullin et al. 2007). The ba-sic calibration procedure is as follows. (1) the raw science data from each observed SB were converted into a CASA Measurement Set (MS) using the task importevla with online flags and other deterministic flags applied; (2) a phase reference antenna close to the central part of the array was chosen from either the east or west arms; (3) problematic data points were located (plotms) and flagged (flagdata); (4) derive the ITRF antenna posi-tion correcposi-tions (gencal); (5) set the model visibility amplitude and phase of the flux calibrator (setjy), and
derives the initial phase and delay calibration of flux calibrator (gaincal); (6) derive the bandpass calibra-tion for the flux calibrator (bandpass); (7) derive the complex gain calibrations for the flux and phase tors (gaincal), and set the flux scale of phase calibra-tor (fluxscale); (8) apply the above-generated various calibrations to MS of calibrators and target; (9) repeat steps 3-8 for the calibrated MS until no further flagging is needed.
Table 2. The JVLA H i Observations of VCC 848
Array Date TOS a No. of Channels Ch Width
(yy-mm-dd) (hr) (km s−1) (1) (2) (3) (4) (5) B 2016-05-30 0.27 512 1.7 B 2016-07-02 0.17 512 1.7 B 2016-07-12 0.30 512 1.7 B 2016-07-21 0.30 512 1.7 B 2016-07-22 0.17 512 1.7 B 2016-07-29 1.20 512 1.7 B 2016-07-31 1.60 512 1.7 C 2016-03-06 2.04 512 1.7 D 2017-04-02 0.90 512 1.7
a Time on source (TOS)
Before combining the calibrated multi-configuration MSs using the CASA task concat, the (relative) weight of visibilities in each calibrated MSs was first determined based on line-free channels (statwt) and then the task cvel2 was used to transform channel coordinates to a common heliocentric velocity reference frame with a 1.7 km s−1 channel width. Spectral continuum was sub-tracted from the combined MS (uvcontsub) with a first-order polynomial fit to visibilities in the line-free channels.
The continuum subtracted MS was deconvolved using tclean, with a cell size of 1.005× 1.005, a robust parameter of 0.7, and a circular clean region of 40 in radius around the target. A robust parameter of 0.7 leads to a restoring beam size of 7.001 × 6.006 (PA = 56.78◦) and rms noise of 0.64 mJy beam−1. The multi-scale clean algorithm was used for recovering emission structures on different spatial scales. After several tests, a set of scale sizes of 600, 1200, 2400and 3600and a “smallscalebias” parameter of 0.7 were adopted for cleaning, down to a global stopping threshold of 2 times the rms noise. The residual maps were checked to make sure all the flux has been retrieved. The H i data cube was blanked in order to separate fea-tures of genuine emission from pure noise, following sim-ilar procedures adopted in previous studies (e.g.Walter
et al. 2008;Hunter et al. 2012). In particular, the
origi-nal data cube was first smoothed to a spatial resolution of 1500×1500, then pixels that belong to spatial features appearing in at least 3 consecutive channels and above 2× the rms noise of the smoothed cube were masked as area of real emission (imager.drawmask). The blank-ing mask thus generated was applied to the original data cube (immath). The blanked data cube at the original
Table 3. H i mapping parameters of VCC 848
Parameters Value
Briggs robustness parameter . . . 0.7 Multiscale parameter. . . 600, 1200, 2400, 3600 Pixel size . . . 1.005 Synthesized beam . . . 7.001
× 6.006 Beam position angle . . . 56.8◦ rms noise (mJy beam−1ch−1) . . . . 0.64 N (H i) rms noise (×1019cm−2beam−1ch−1) 1.5
resolution will be used for the following analysis in this paper.
2.2.4. Comparison with ALFALFA Observation The spatially integrated JVLA H i line profile of VCC 848 is plotted together with that from the single-dish Arecibo Legacy Fast ALfa Survey (ALFALFA; Haynes
et al. 2011) observation in Figure1. The JVLA line
pro-file has been smoothed to the 11 km s−1 spectral res-olution of ALFALFA data. The rms noise σrms of the ALFALFA spectrum is about 2.6 mJy. The two profiles are in good agreement, except that the JVLA line profile is slightly (< 2σrms) lower than the ALFALFA profile on the high-velocity side. It is worth noting that the JVLA H i detection covers virtually the same velocity range as the ALFALFA detection. The total H i flux density mea-sured on the JVLA line profile is 6.30± 0.06 Jy km s−1, accounting for∼ 94% of that (6.68 ± 0.09 Jy km s−1) from the ALFALFA observation.
3. H i GAS DISTRIBUTIONS
In contrast to the stellar component, the gaseous com-ponent of galaxies is collisional and can dissipate its orbital energy via shocks. This may lead to diverged dynamical evolution of gas and stars during a violent merging process. The H i 21-cm emission has proven to provide indispensable clues to the evolutionary status of merging systems (e.g.Hibbard et al. 2001).
3.1. Integrated H i Line Profile
The ALFALFA H i velocity profile of VCC 848 has a∼ 160 km s−1velocity width1measured at 20% of the peak intensity W20(Haynes et al. 2011). This velocity width is larger than that (∼ 130 km s−1) expected for its bary-onic mass (approximated as M?+1.36MHI = 7.4×10⁸
1It is not straightforward to apply an inclination correction to this observed velocity width, as we will show that the H i gas in VCC 848 appears not to have a simple planar spatial distribution.
1350 1400 1450 1500 1550 1600 1650 1700 Velocity (km/s) 0 15 30 45 60 75 SHI (mJy) ALFALFA
JVLA (smoothed to ALFALFA spectral resolution)
JVLA profile mirroring of the approaching side to the receding side
Figure 1. Integrated H i line profile of VCC 848. Results from ALFALFA and our JVLA observations are plotted as black dashed curve and red solid curve, respectively. The red dashed curve represents the mirroring of the JVLA profile from the approaching side (< 1532 km s−1) to the receding
side. The JVLA H i line profile has been smoothed to the 11 km s−1spectral resolution of ALFALFA.
M ), based on the baryonic Tully-Fisher relation (e.g.,
McGaugh 2012). The H i velocity profile is asymmetric
with respect to the systemic velocity (1532 km s−1). As we will show later, the approaching half (V < 1532 km s−1) of the H i distribution follows a more regular rota-tion pattern than the receding half (V > 1532 km s−1). So we mirror the H i profile of the approaching half to the receding side, and compare the mirrored profile with the observed profile at the receding side in Figure1. It can be seen that the receding side shows a deficit of H i at V . 1570 km s−1 whereas an excess of H i at V & 1570 km s−1, indicating significant tidal forces that disturbed the gas velocity distribution. W20 measured on the mir-rored line profile is' 140 km s−1, which is close to that predicted by the Tully-Fisher relation.
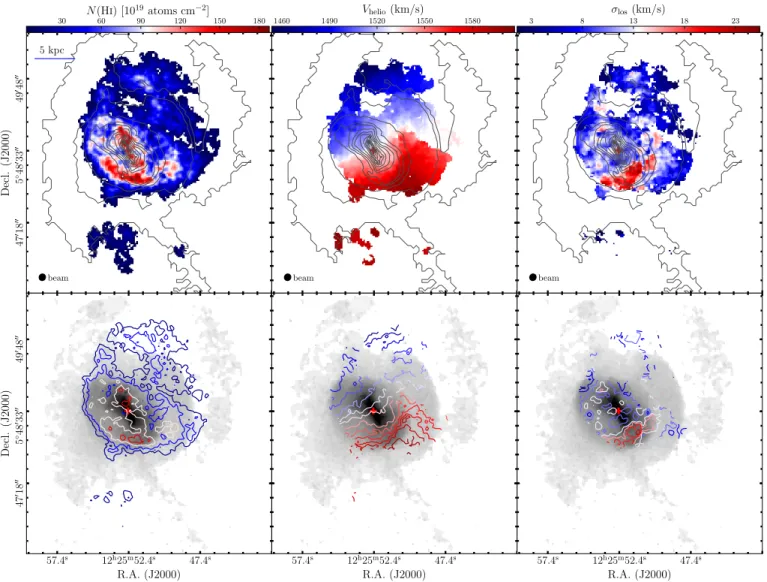
3.2. H i Maps and Comparison with the Stellar Light Distribution
Figure 2 shows the column density map, intensity-weighted velocity field and velocity dispersion maps of VCC 848. To help visualise the spatial association be-tween stellar light and H i gas, the g-band surface bright-ness contours are overlaid on the H i maps in the upper row, while the H i distributions are contoured on the g-band image in the lower row. The g band image has been adaptively smoothed to achieve a minimum signal-to-noise ratio of 5 pixel−1 (Paper I).
The H i gas spatial distribution is asymmetric with re-spect to the photometric center of the stellar main body, and it appears to be confined within the inner edges of the two outermost stellar shells. Moreover, the H i dis-tribution is bounded on the southeast by a near-circular outer edge of the stellar tidal arm that wraps nearly 180◦ around the galaxy center (Figure 2 in Paper I).2 Clear-cut edges of the H i distribution in the southeastern half are manifested by the closely crowded H i intensity con-tour lines. H i gas distribution in the northwestern half of VCC 848 extends slightly further north than the de-tected stellar light distribution and has typical N (H i) . 1020cm−2 (0.8 M
pc−2). High column density H i gas (N (H i) & 1021 cm−2), corresponding to the yellowish contours in the lower left panel of Figure2), is mainly concentrated in two distinct spatial areas. One is broadly associated with the central (twisted) stellar disk of VCC 848 and accounts for ' 15% of the total H i flux of the system, while the other one is associated with the above mentioned stellar tidal arm and accounts for ' 13% of the total H i flux. We point out that the general associ-ation between the H i and stellar features, together with the gas-dominated nature of VCC 848, suggest that ram pressure stripping, if any, does not have an appreciable influence on the H i morphology.
The overall H i velocity gradient is approximately along the direction of the major axis of the stellar main body, but there exist remarkable local deviations from this overall trend. In particular, while the velocity field at the approaching side (Vlos < 1532 km s−1) is largely consistent with a solid-body rotation (see below), veloc-ity contours of the receding side are closely crowded (i.e. steep velocity gradient) and twisted towards the south-west edge of the stellar main body, giving rise to the apparent high line-of-sight velocity dispersion (up to∼ 25 km s−1) of the H i gas there. The velocity contours at the receding half is consistent with being affected by tidal forces largely along the plane of sky. The above mentioned high column density H i associated with the tidal arm is mainly at the receding side, where the arm appears to be launched from.
By performing multi-gaussian line profile fitting to the H i data cube of VCC 848 (see Section4), we find that, except for sporadic locations with high column densities
2The spatial association of atomic gas with the stream-like feature reported in Paper I suggests that this feature is a tidal arm em-anating from the primary progenitor rather than a stellar shell or stream stripped from the secondary progenitor, because the H i gas of the secondary, if any, should have been completely de-tached from the secondary’s stellar component and assimilated by the primary after the first two to three periapsis passages, as will be demonstrated by computer modeling in Section6.
47 018 00 5 ◦48 033 00 49 048 00 Decl. (J2000) beam 5 kpc beam beam 30 N (Hi) [1060 90 120 150 180 19atoms cm−2] 1460 1490 1520 1550 1580 Vhelio(km/s) 3 8 13 18 23 σlos(km/s) 57.4s 12h25m52.4s 47.4s R.A. (J2000) 47 018 00 5 ◦48 033 00 49 048 00 Decl. (J2000) 57.4s 12h25m52.4s 47.4s R.A. (J2000) 57.4s 12h25m52.4s 47.4s R.A. (J2000)
Figure 2. H i gas column density map (left), intensity-weighted velocity field (middle) and velocity dispersion map (right) of VCC 848. The g-band image is contoured onto the H i distributions in the top panels, while the H i distributions are contoured onto the g-band image in the bottom panels. The g-band contour levels run from 19.8 to 25.3 mag arcsec−2 with a 0.5 mag
interval, and from 25.3 to 28.3 mag arcsec−2 with a 1.0 mag interval. Only pixels with velocity-integrated intensities≥ 3 times the rms noise are displayed in the velocity field and≥ 5 times the rms noise in the velocity dispersion map. The H i column density contours are at levels of (2, 5, 10, 15) × 1020 cm−2. The velocity field contours are drawn with 10 km s−1 intervals,
and the systemic velocity of 1532 km s−1is drawn as the yellowish contour lines. The red plus symbol in each panel marks the
photometric center of the system. The beam size (7.001
× 6.006, PA = 56.78◦) is indicated in the bottom-left of the top panels.
near the central disk region, nearly all the other spatial locations have H i line profiles that each are adequately fitted by a single Gaussian component. This suggests that the intensity-weighted velocity field shown in Fig-ure2 is largely a reasonable representation of the large scale motion (along the line of sight) of the H i gas. The H i channel maps (binned by a factor of 3 along the velocity dimension) are presented in Figure A1 of the Appendix.
4. ROTATION CURVES AND MASS PROFILES 4.1. Derivation of Rotation Curves
We use the 2D Bayesian Automated Tilted-ring fitter (2dbat) recently developed by Oh et al. (2018) to ex-tract rotation curves from the H i velocity field. Instead of using the first moment map which could be affected by the disturbed motions from the merging process, we extract a bulk velocity field for the underlying circular rotation of the galaxy in an iterative manner. In partic-ular, we perform profile decomposition analysis of the individual velocity profiles of the H i data cubes as de-scribed inOh et al.(2019) and extract the decomposed components whose central velocities are close to a refer-ence velocity field (e.g., single Gaussian velocity field). We call this a bulk velocity field, and classify the other
ones deviating from the bulk motions as disturbed, non-circular motions. We then improve the reference velocity field for profile decomposition with a new model velocity field from the 2dbat analysis of the first reference veloc-ity field and repeat the profile decomposition described above. In this way, we extract the bulk velocity field of VCC 848 for the rotation curve analysis. Next, we cre-ate a mask for the bulk velocity field to isolcre-ate a more or less elliptical region encompassing the main body of VCC 848 (left panel of Figure 3). This quasi-elliptical region has a semi-major axis length of Rmaj ' 3000 and accounts for∼ 30% of the total H i flux of the system. The approaching half of this region largely follows the characteristic spider-shaped velocity field expected for an inclined rotating disk.
We fit the velocity field of the masked quasi-elliptical region with 2dbat by fixing the center position to the one obtained from our stellar isophotal analysis (Table1; Paper I). The systemic velocity Vsys, kinematic PA and inclination angle are fitted as free parameters but are kept constant with radius. 2dbat iteratively searches for the tilted-ring parameters that give the best fit to the observed velocity field. The rotation velocities (filled circles in the right panel of Figure3) are extracted with a 7.005 ring width that is chosen to be slightly larger than the beam size. The best-fit kinematic parameters are indicated in the caption of Figure 3. Lastly, we apply asymmetric drift correction to the extracted rotation velocities, following the method described in Bureau &
Carignan(2002) (see also Oh et al. 2011). As is shown
in Figure 3, the asymmetric drift correction is < 2 km s−1 across the probed radial range.
4.2. Rotation Curves
Rotation velocities extracted from the approaching side increase nearly linearly with radius at Rmaj . 2000, beyond which the rotation curve appears to flatten out. At the receding side, where the velocity field is sub-stantially disturbed by the ongoing merging, the derived circular velocities are about half that of the approach-ing side at Rmaj . 2500, beyond which the radial trend steepens and reaches velocities comparable to that of the approaching side at Rmaj ∼ 3000. Projected radial veloc-ities derived based on the extracted rotation velocveloc-ities are over-plotted on the H i position-velocity diagrams in Figure 4, where the largely regular rotation pattern in the inner 3000 is clearly illustrated.
In order to quantify the radial trend of rotation veloci-ties extracted from the approaching side, we parameter-ize the rotation curve with the same functional form as that used inBarrera-Ballesteros et al.(2018) (see their Equation 4). The functional form is defined by three
parameters: the maximum velocity (Vmax), the transi-tion radius (Rturn) where the rotation curve transitions from a solid-body inner part to a flat outer part and the sharpness (α) of the transition. We obtain a best-fit Vmax = 41.5±0.5 km s−1, Rturn = 19.600±0.900 (∼ 1.6 kpc) and α = 130.1±1.0. The large α value indicates a sharp transition at Rturn. The corresponding best-fit curve is over-plotted in the right panel of Figure3.
Based on the above parametrized fitting, we obtain a slope of 26.5±3.9 km s−1 kpc−1 (V
max/Rturn) for the solid-body rising part of the rotation curve, where the uncertainty is determined based on repeat fitting to ran-domly disturbed rotation velocities for 1000 times. This slope of rotation curve falls within the range of ordinary dwarf irregular galaxies or BCDs with off-centered star-burst that have inclination-corrected central brightness (µg,corr= 22.6 mag arcsec−2 for a kinematic inclination = 45.2◦) comparable to VCC 848 (Lelli et al. 2014). Because the rotation velocity gradient slope is propor-tional to the square root of local matter density for a solid-body rotation curve, we can infer that the merg-ing event of VCC 848 has not built up an exceptionally compact core.
4.3. Dynamical and Baryonic Mass Profiles We use the rotation curve of the approaching half to determine the cumulative dynamical mass profiles (= Vrot(R)2R/G), which is shown in Figure5. We also over-plot mass profiles of the baryonic components, including stars, atomic and molecular gas in Figure5. All of the profiles are extracted using the same geometric param-eters as determined from the 2dbat kinematic fitting. The stellar mass is estimated by using the (g −i)−mass-to-light relation calibrated for Local Group dwarf galax-ies (Zhang et al. 2017). Details about the procedure of stellar mass estimation are given in Paper I. We adopt a logarithmic stellar mass uncertainty of 0.2 dex which is applicable to color-based mass estimation for low-dust-extinction cases (Zhang et al. 2017). The atomic gas mass is equal to the H i gas mass multiplied by a factor of 1.36 to account for helium. The molecular gas mass is indirectly inferred from the SFR estimated with Hα luminosities (Catalan-Torrecilla et al. 2015, Equation 10), by adopting a constant molecular gas consumption timescale of (5.25± 2.5) × 10−10 yr−1 found for nearby
54.4s 12h25m52.4s 50.4s R.A. (J2000) 48 03 00 5 ◦48 033 00 49 03 00 Decl. (J2000) 0 10 20 30 40 Rmaj [arcsec] 0 10 20 30 40 50 60 VR OT [km s − 1 ] approaching side receding side 0 1 2 3 Rmaj [kpc]
Figure 3. Results of the H i velocity field modeling with the 2dbat algorithm. The left panel shows the model velocity field constructed using the best-fit tilted-ring parameters, where Vsys= 1532 km s−1, PA = 21.8◦and inclination angle = 45.2◦. The
same velocity contours shown in Figure2for the observed velocity field are overlaid on the model velocity field. The right panel shows the rotation velocities determined for the approaching (blue) and receding (red) sides separately. Note that the receding side (to the southwest) is severely distorted by the ongoing merging event. The approaching side is largely consistent with a solid-body rotation that can be reasonably modeled. The filled symbols represent the extracted rotation velocities, and the open circular symbols represent the asymmetric drift corrected rotation velocities. The blue curve represents a parametric fitting to the rotation curve of the approaching side by adopting the same functional form used inBarrera-Ballesteros et al.(2018). See Section4.2for details.
disk galaxies at (sub-)kpc scales (Bigiel et al. 2008;Leroy
et al. 2008).3
As is illustrated in Figure 5, the stellar and atomic gas components together account for' 20% of the dy-namical mass enclosed within the central 3000, and the fraction increases to ∼ 24% if including molecular gas in the baryon budget. Stars constitute more than half (54%) of the baryonic mass, which is in contrast to the overwhelmingly gas-rich nature of the system as a whole.
3Another method of estimating the molecular gas mass is based on a metallicity-dependent gas-to-dust ratio (G/D). According to the G/D−metallicity relation fromR´emy-Ruyer et al.(2014), VCC 848 is expected to have a log(G/D) of 3.00 ± 0.37 for 12+ log(O/H) = 8.03 (Table1). In addition,Grossi et al.(2015) determined a total dust mass of 105.01 M (the value has been adjusted to reflect our adopted distance) within the central ∼ 3000 of VCC 848. Therefore, the total gas mass (atomic plus molecular) within the central 3000is estimated to be 108.01±0.37 M and hence the most likely molecular gas mass be∼ 107.5 M by subtracting the atomic gas contribution (Figure5). This molecular gas mass is in reasonable agreement with that (107.6 M ) inferred from the SFR-based method shown in Figure 5. We choose to use the SFR-based method in this paper. This is because, besides their low spatial resolution, the Herschel im-ages of VCC 848 generally have signal-to-noise ratios that are too low (except for the brightest star-forming sites) to allow for constructing a robust radial profile of dust mass densities.
This might be partly attributed to a highly efficient star formation toward the stellar main body and a less se-vere tidal stripping of the stellar component than the gas during the merging. Lastly, it is also notable that the molecular gas appears to dominate over the atomic gas in mass within the central∼1600−2000(1.3−1.6 kpc; accounting for the uncertainties of molecular gas mass estimate) in radius. Similarly high fraction of molecular gas was also indirectly inferred for some nearby BCD or starburst dwarf galaxies (Hunter et al. 2019).
5. STAR FORMATION ACTIVITIES 5.1. Specific SFR and Star Formation Efficiencies The global logarithmic specific SFR (SFR per unit stellar mass, sSFR) of VCC 848 is −9.87 (see Table1
for the total SFR and stellar mass), which is 0.19 dex higher than that expected for normal star-forming galax-ies of similar stellar masses (Shin et al. 2019, Equation 19). However, given a 0.27 dex scatter of the Shin et al.(2019) relation, VCC 848 is consistent with being a main sequence star-forming galaxy for its stellar mass. The (g− i) and Hα maps of the central 1.5×1.5 arcmin are shown in Figure6. The Herschel 100 µm continuum emission, which traces the dust obscured star forma-tion, is contoured in red color on the Hα map. A vast
56.4s 12h25m52.4s 48.4s R.A. (J2000) 47 033 00 5 ◦48 033 00 49 033 00 Decl. (J2000) beam PV1 PV2 PV3 PV4 30 60 90 120 150 180 N (H i) [10 19 atoms cm − 2] 1475 1505 1535 1565 1595 Vhelio (km/s) PV1 1460 1485 1510 1535 1560 1585 1610 Vhelio (km/s) PV2 -60 -40 -20 0 20 40 60 Offset (arcsec) PV3 -60 -40 -20 0 20 40 60 Offset (arcsec) 1460 1485 1510 1535 1560 1585 1610 Vhelio (km/s) PV4
Figure 4. H i position-velocity diagrams (right panels) extracted along four 700-wide pseudo-slits oriented at PA = 38.3◦(PV1),
83.3◦(PV2), 128.3◦(PV3) and 173.3◦(PV4), respectively, where 38.3◦is the PA of the best-fit kinematic major axis of VCC 848
(Figure3). The four pseudo-slits (centered at the galaxy center) are indicated as long magenta lines overlaid on the H i column density map (left panel). Every 2000 along the pseudo-slit direction is marked with a 700-long line perpendicular to the slit
direction. Also overlaid on the column density map are the intensity-weighted H i velocity contours, with 15 km s−1 intervals. In the right panels, the dot-connected red curves are the projected radial velocities based on rotation curves determined for the central 3000of VCC 848 (Figure3).
majority (' 90%) of current star formation traced by Hα and 100 µm is confined to the central high surface brightness regions enclosed by the N (H i) = 1021 cm−2 contour. Although the tidal arm in the southeast reaches similar N (H i) to the central region, the SFR there ac-counts for merely ' 6% of the total. The most intense star-forming site of the system is located ∼ 1000 offset toward the northeast of the photometric center, and is associated with the brightest star cluster (Paper I) and H ii region (Section5.2) in VCC 848.
It is remarkable that the youngest stellar populations in the central∼ 1000(in radius) are confined to a straight narrow strip that appears to trace the symmetry axis of the twisted disk. The age spread of star clusters de-tected along this narrow strip suggest that it has existed for at least∼ 1 Gyr (Paper I). We note that this linear stellar structure is not likely a bar, because the associ-ated H i velocity field does not show the characteristic S-shaped isovelocity contours expected for a bar struc-ture (e.g.,Athanassoula 1992).
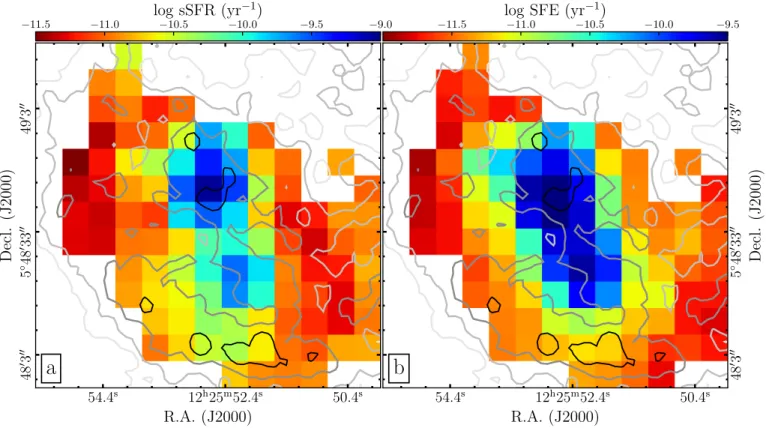
To further illustrate the relative strength of star for-mation activities across the system, we show spatial dis-tributions of sSFR and star formation efficiency (SFE) with respect to the atomic plus molecular gas (see Sec-tion4for the inference of molecular gas mass) in Figure
7, where the involved input images, including the g, i, Hα and H i, have been smoothed to match the beam size
of H i map and rebinned to 700×700 (560×560 pc) pixel sizes. The SFR is estimated from the Hα luminosities. Note that we have ignored the contribution of dust ob-scured star formation in Figure 7 for a high resolution view of the overall distribution of star formation. This practice is justified by the fact that the TIR inferred from the 100 µm (Galametz et al. 2013) accounts for at most ∼ 10% of the local SFR at spatial scales com-parable to the resolution of 100 µm, according to the hybrid Hα+FIR recipe for SFR estimation presented in
Catalan-Torrecilla et al. (2015). This is probably not
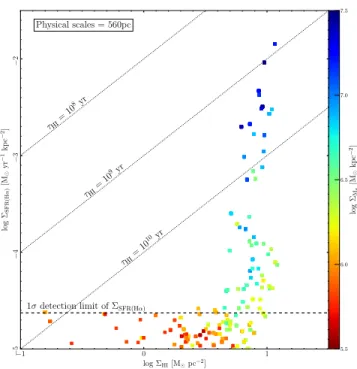
surprising given the low metallicities of VCC 848. As is shown in Figure 7, the sSFR and SFE reach their logarithmic maximum of ' −9.1 yr−1 and −9.4 yr−1 respectively at the most intense (and also bluest) star-forming site of the system. The H i tidal arm has typical sSFR and SFE that are more than one order of magnitude lower than the central high surface bright-ness regions. In Figure 8, the SFR surface densities of individual pixels shown in Figure7are plotted as a func-tion of the H i mass surface densities. Above a detecfunc-tion limit of 10−4.6 M yr−1 kpc−2 for ΣSFR(Hα), the indi-vidual regions fall into two groups which are separated by a∼ 0.3 dex gap in log ΣSFR(Hα) from−3.6 to −3.3. The regions in the higher-ΣSFR(Hα)group belong to the central high surface brightness regions, whereas those in the lower-ΣSFR(Hα) group and with logΣHI & 0.88
be-10 20 30 Rmaj[arcsec] 6 7 8 9 10 log M( < Rma j ) [M ]
atomic gas mass molecular gas mass stellar mass dynamical mass
1 2
Rmaj[kpc]
Figure 5. Accumulated radial profiles of the dynamical mass as well as the stellar, atomic and molecular gas masses within the central 3000. The same geometric parameters
de-rived from the 2dbat fitting of the H i velocity field (Figure
3) are used for extracting all of the profiles. The atomic gas mass is calculated as the H i gas mass multiplied by a factor of 1.36 to account for the contribution of helium. Estima-tion of the molecular gas mass is described in SecEstima-tion 4.3
The gray-shaded region represents the uncertainties of the estimation of molecular gas mass.
long to the H i concentration along the tidal arm (Figure
2). The lack of a direct connection between star forma-tion and H i gas and the apparent relevance of stellar surface densities are vividly demonstrated in VCC 848 (see, e.g.,Ekta et al. 2008for similar examples).
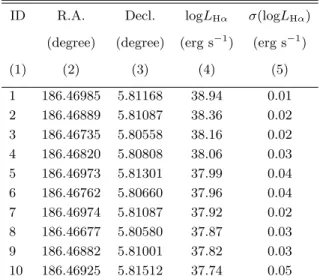
5.2. Hα Luminosity Distribution of H ii Regions 5.2.1. Detection of Hii Regions
H ii regions trace massive stars (& 10 M ) formed in the recent (∼ 10−20 Myr) past, and their spatial and lu-minosity distributions reflect the mode and strength of star-forming activities. We use the Sextractor soft-ware (Bertin & Arnouts 1996) to detect H ii regions based on the Hα image of VCC 848. With a detection threshold of 2.5 times the rms noise, we detect 23 H ii re-gions in total. To determine the detection completeness, we repeatedly add artificial point sources (one at a time) that are convolved with a 1.800 FWHM Gaussian
(Sec-tion 5.2.2) and span a uniform range of flux densities
at 1000 randomly selected positions within the central main body of VCC 848 (delineated by the dotted el-lipse overplotted on the Hα image in Figure 9), and then run Sextractor for detection with the same pa-rameters as for the original image. This test suggests
Table 4. Hα luminosities of the brightest H ii re-gions in VCC 848
ID R.A. Decl. logLHα σ(logLHα)
(degree) (degree) (erg s−1) (erg s−1)
(1) (2) (3) (4) (5) 1 186.46985 5.81168 38.94 0.01 2 186.46889 5.81087 38.36 0.02 3 186.46735 5.80558 38.16 0.02 4 186.46820 5.80808 38.06 0.03 5 186.46973 5.81301 37.99 0.04 6 186.46762 5.80660 37.96 0.04 7 186.46974 5.81087 37.92 0.02 8 186.46677 5.80580 37.87 0.03 9 186.46882 5.81001 37.82 0.03 10 186.46925 5.81512 37.74 0.05
that our H ii region detection reaches ≥ 90% recovery rate (our completeness limit) at log L(Hα) [erg s−1] & 37.7. Among the 23 H ii regions detected in VCC 848, 10 have L(Hα) above the 90% limit. The following analysis in this section will focus on the 10 brightest H ii regions.
5.2.2. Aperture Photometry of Hii Regions An inspection of the radial light distributions of the 10 brightest H ii regions suggests that they have FWHMs ranging from 1.700 to 1.900 and nearly all of them are reasonably described by single Gaussian profiles4. We perform photometry for each region with a 2.100 (8 pix-els) diameter circular aperture and subtract a local me-dian background using an 8-pixel wide annulus that is sufficiently far away from the center of the H ii region in question. The aperture size is chosen to be larger than the FWHM but at the same time to avoid sig-nificant contamination from neighboring regions. Pixels belonging to neighboring H ii regions are excluded when determining local background and noise. For the two H ii regions close to the brightest H ii region (left panel of Figure9), we manually select background regions that are at the same distance from the brightest H ii region but in different directions. The total Hα flux of each re-gion, as expected for a Gaussian profile with FWHM of 1.800, is obtained by applying a multiplicative aperture
4The similar radial profiles might not be very surprising given that our H ii regions are only marginally resolved in the Hα image and that the intrinsic light profiles of H ii regions are found to have nearly invariant gradients at log L(Hα) [erg s−1] . 38.6 (Rozas
54.4s 12h25m52.4s 50.4s
R.A. (J2000)
48 03 00 5 ◦48 033 00 49 03 00Decl.
(J2000)
a
54.4s 12h25m52.4s 50.4sR.A. (J2000)
48 03 00 5 ◦48 033 00 49 03 00Decl.
(J2000)
b
−0.5 −0.2g
− i (mag)
0.1 0.4 0.7 −3.0 −2.5 −2.0 −1.5 −1.0log Σsfr(hα) (M
yr
−1kpc
−2)
Figure 6. g− i color map (left) and Hα flux density map (right) of the central 1.5×1.5 arcmin of VCC 848. The color bar for the Hα map is labeled with the corresponding SFR surface density, by adopting the recipe fromCatalan-Torrecilla et al.(2015). The same H i column density contours shown in Figure2are overlaid in both panels here. The Herschel 100µm is overlaid as red contours (2σ, 3σ and 4σ above the sky background) on the Hα flux density map. Note that the dust IR emission contributes at most∼ 10% of the total SFR budget (Hα+TIR) across the system at spatial scales comparable to the resolution (9.00
4) of the 100 µm image.
correction factor of 1.77 to the background-subtracted aperture photometry. The derived Hα flux densities and uncertainties of the 10 H ii regions are given in Table4. We note that the marginally-resolved nature of our de-tections means that more sophisticated procedures for H ii region photometry such as HIIphot (Thilker et al. 2000) cannot play their advantages.
5.2.3. Hii Region Distributions
The H ii region distributions are shown in Figure 9, where the left panel marks the spatial distribution while the right panel presents the cumulative Hα luminosity distribution above the 90% completeness limit. No bin-ning in luminosity is used for constructing the cumula-tive distribution. The variation of detection complete-ness with luminosities are also overplotted in the right panel. To provide some perspective on the H ii regions detected in VCC 848, the 90% completeness limit of L(Hα) is∼ 5 times that of the Orion nebula (Kennicutt 1984), and for a Case B recombination, this corresponds to a Lyman continuum photon emission rate of 1049.6 s−1, which is equivalent to ∼ 13 O9V stars (Sternberg
et al. 2003). The brightest H ii region is associated with
the brightest star cluster in VCC 848 (Paper I) and has a Hα luminosity (1038.94 erg s−1) slightly higher than the brightest H ii region N66 (1038.78 erg s−1,Kennicutt
1984) in the Small Magellanic Cloud (SMC). We note that the Hα luminosity of the brightest H ii region may be excited by the associated (and the brightest) star cluster which has an age of∼ 6 − 8 Myr and mass of ' 105M
(Paper I).
We perform a least-squares fitting to the completeness-corrected cumulative Hα luminosity dis-tribution of VCC 848 by adopting a power-law form for the (probability) luminosity distribution (dN (L)/dL∝ L−α) that has been widely used in the literature. We find a best-fit power-law index α = 2.6+0.7−0.5, where the uncertainties correspond to the range of α with reduced χ2≤ χ2
min+1. As is illustrated in Figure9, the luminos-ity distribution is well described by a single power-law form, except for the brightest H ii region which is∼ 0.2 dex more luminous than that expected for the power-law fitting.
Considering the uncertainties, the power-law index de-termined above for VCC 848 falls in the broad range of values found for nearby spiral galaxies (∼ 2.0 ± 0.5; e.g.
54.4s 12h25m52.4s 50.4s
R.A. (J2000)
48 03 00 5 ◦48 033 00 49 03 00Decl.
(J2000)
a
54.4s 12h25m52.4s 50.4sR.A. (J2000)
48 03 00 5 ◦48 033 00 49 03 00Decl.
(J2000)
b
−11.5 −11.0log sSFR (yr
−10.5 −10.0 −9.5 −9.0 −1)
−11.5
log SFE (yr
−11.0 −10.5 −10.0 −9.5 −1)
Figure 7. Maps of specific SFR (sSFR, left) and star formation efficiency (SFE) with respect to atomic plus molecular gas (right) of the central 1.5×1.5 arcmin of VCC 848. As in Figure6, the SFR is estimated based on the observed Hα flux intensities. The Hα and optical images have been smoothed to match the spatial resolution of H i data and re-binned to a 700
×700pixel size
before deriving the maps shown here. The same H i column density contours shown in Figure2are overlaid in both panels. See Section5.1for details.
Kennicutt et al. 1989;Helmboldt et al. 2005;Liu et al.
2013), but appears to be at the upper bound for dIrr galaxies (∼ 1.5 ± 0.5; e.g.Strobel et al. 1991;Miller &
Hodge 1994;Youngblood & Hunter 1999;van Zee 2000).
However, it has been shown that measurements of α are in many cases dependent on the L(Hα) range used in the power-law fitting, in the sense that α measured at higher luminosities tends to be similar to or larger than that at lower luminosities (e.g.,Youngblood & Hunter 1999). The H ii region detection limit for VCC 848 is relatively high compared to most previous studies of dIrr galax-ies in the literature, so the large α measured for VCC 848 may not be surprising. We shall return to this point when comparing VCC 848 with ordinary dIrr galaxies in the next section.
5.2.4. Comparison with Isolated dIrr Galaxies To probe the impact of galaxy merging, we compare the Hα luminosity distribution of VCC 848 to that of or-dinary late-type dwarf galaxies with similar luminosities.
Youngblood & Hunter(1999) andvan Zee(2000)
stud-ied H ii region luminosity distributions for the largest samples of relatively isolated gas-rich dIrr galaxies so far. In particular, the samples ofYoungblood & Hunter
(1999) andvan Zee (2000) include 4 and 6 dIrr galax-ies, respectively, that have MB within ± 0.5 mag of VCC 848 and at the same time have H ii regions with maximum log L(Hα) ≥ 37.7. We note that all of the 4 galaxies from Youngblood & Hunter(1999) happen to be fainter than VCC 848 while all of the 6 from van Zee(2000) are brighter than VCC 848. These 10 galax-ies constitute our comparison sample. Cumulative Hα luminosity distributions of the 10 galaxies are shown in Figure 9. In addition, we construct a composite lumi-nosity distribution by co-adding the H ii region catalogs of the 10 galaxies at log L(Hα)≥ 37.7, and show the re-sultant cumulative luminosity distribution in Figure9. For the sake of comparison, the co-added distribution is normalized such that the total number of H ii regions at log L(Hα)≥ 37.7 is equal to that of VCC 848.
The cumulative Hα luminosity distribution of VCC 848 is in reasonable agreement with the co-added dis-tribution of the comparison sample. This general agree-ment is remarkable and may imply that the galaxy merg-ing does not significantly affect the birth mass distribu-tion of star clusters, at least at the current stage of the merger and for the most massive ones. We note that, once the full catalogs of H ii regions down to their
re-−1 0 1 log ΣHI[M pc−2] − 5 − 4 − 3 − 2 log ΣSFR(H α ) [M yr − 1kp c − 2] 1σ detection limit of ΣSFR(Hα) τHI =10 8yr τHI =10 9yr τHI= 1010 yr Physical scales = 560pc 5.5 6.0 6.5 7.0 7.5 log ΣM ? [M kp c − 2]
Figure 8. ΣSFR(Hα) is plotted as a function of ΣHI at
560 pc resolution. The data points correspond to the indi-vidual pixels plotted in Figures6and7, and are color-coded according to their stellar mass surface densities. Note that only data points that fall within the 5×1020 cm−2 contours
(Figure 2) are plotted. The diagonal dotted lines represent lines of constant SFE(H i) and thus constant H i gas deple-tion (by star formadeple-tion after transideple-tioning to the molecular phase) times τHI(108, 109and 1010yr). Above the detection
limit of SFR(Hα), the data points fall into two groups which are separated by a 0.3 dex gap in log ΣSFR(Hα) from −3.6
to−3.3. Data points of the group with higher log ΣSFR(Hα)
belong to the central high surface brightness star-forming regions, whereas those of the lower-ΣSFR(Hα)group with log
ΣHI& 0.88 are from the southeast H i tidal arm (Figure2).
spective detection limit are used for the power-law fit-ting, the galaxies in the comparison sample have a me-dian α = 1.5± 0.5, which is in fair agreement with the typical values found for dIrr galaxies and suggests that the Hα luminosity distributions tend to flatten toward fainter luminosities.
Besides exploring the overall shape of the Hα lumi-nosity distribution above the detection limit, we can also compare the fractional luminosity contribution of the de-tected H ii regions in VCC 848 and the comparison sam-ple. In particular, at log L(Hα)≥ 37.7, the H ii regions collectively contribute 47% of the total Hα emission of VCC 848, which is higher than any of the galaxies in the comparison sample (∼ 15% ± 10%). The extraordinary high fractional contribution in VCC 848 is largely driven by the single brightest H ii region that contributes 22% of the total Hα emission. As has been shown in Paper I, the brightest star cluster, which is associated with the
brightest H ii region in VCC 848, is also exceptionally luminous for the current SFR of VCC 848.
6. NUMERICAL SIMULATIONS
We use hybrid N -body/hydrodynamical simulations to gain insight into the merging process of VCC 848. In particular, we make use of a Treecode-smoothed particle hydrodynamics (SPH) algorithm that largely follows the techniques described inHernquist & Katz(1989), where the Treecode allows rapid calculation of gravitational accelerations and the SPH code allows for modeling the collisional gas component. The relevant Treecode-SPH parameters used in our simulations, such as the grav-itational softening length, time-step scheme, Treecode opening angle and viscosity prescription, are the same as that adopted inSmith, Davies & Nelson(2010). This Treecode-SPH code has been extensively used for model-ing galaxy interactions and environmental effects actmodel-ing on dwarf galaxies (e.g., Smith et al. 2012a,b, 2013a,b,
2015).
We build multi-component models of a pair of other-wise isolated dwarf galaxies using the publicly available code DICE (Perret 2016). In particular, each galaxy con-sists of a spherical dark matter halo with a NFW den-sity profile (Navarro et al. 1996), an exponential stel-lar disk and, if there is gas, an exponential gas disk. The dark matter halo component consists of 400,000 particles, while the stellar and gas components consist of 50,000 particles each. The gas component is treated isothermally, with a constant sound speed of 7.5 km s−1 (roughly equivalent to a temperature of 104 K). This has been shown to be a valid approximation of a rigor-ous treatment of warm interstellar atomic gas that has a highly efficient (inefficient) cooling efficiency at T > (≤) 104 K (e.g.,Barnes 2002). The gas-to-stellar disk scale-length ratio is fixed to 1.5, which can be compared to the typical ratio of∼ 1.3 for nearby star-forming dwarf galaxies (e.g.,Hunter et al. 2012). The scale height is 0.3 times the scale length for both the stellar and gas disks. Lastly, the dark matter halos have a concentration pa-rameter c = 10 and their masses (Mh) are linked to M? following the relation derived from abundance matching technique (e.g.,Guo et al. 2010).
Given the above simulation ingredients, there is a large parameter space that involves the progenitor mass ratios, gas fractions, disk sizes, orbit geometries, etc. It is beyond the scope of the current work to conduct a complete search for all possible combinations of these parameters to match every detail of the observations. As elaborated below, our choice of the parameters is largely guided by the observed stellar distribution of VCC 848. The primary goal of our simulation is to infer the merger
54.4s 12h25m52.4s R.A. (J2000) 5 ◦48 033 00 49 03 00 Decl. (J2000) 37 38 39 log L(Hα) [erg s−1] 0 5 10 15 Num b er (> L(H α ))
dIrrs with comparable MB
co-added dIrrs
power-law fit for VCC848 VCC848 (detected) VCC848 (completeness-corrected 0.2 0.4 0.6 0.8 1.0 Detection completeness
Figure 9. Central 1×1 arcmin of the Hα image of VCC 848 (left) and cumulative Hα luminosity distribution of H ii regions (right). In the left panel, the green and red circular apertures mark the H ii regions brighter and fainter than the 90% completeness limit (> 1037.7 erg s−1), respectively. The big dotted ellipse encloses the region used for completeness estimation. In the right
panel, the cumulative Hα luminosity distribution of VCC 848 above the 90% completeness limit is shown as red filled circles while the completeness-corrected distribution as red open circles. The red solid curve corresponds to a power-law fit to the completeness-corrected Hα luminosity distribution of VCC 848, and the red shaded region represents the uncertainties of the power-law fit. The green dotted curve delineates the completeness limit (marked in the right y-axis) as a function of Hα luminosities, and the gray shaded region represents the regime below the 90% completeness limit. Cumulative Hα luminosity distributions for 10 relatively isolated dIrr galaxies whose MBare within± 0.5 mag of VCC 848 are plotted as gray curves. The
black dashed curve corresponds to the normalized co-added distribution of the 10 dIrr galaxies. stage by qualitatively reproducing the most prominent
stellar features. While our simulations are not meant to match the observed H i gas distribution of VCC 848, we will try to discuss the response of the gas component and its impact on the merging process that may gener-ally apply to gas-dominated mergers of dwarf galaxies.
6.1. Parameter Setup
6.1.1. Stellar Mass and Size of Progenitor Galaxies An upper limit of the primary-to-secondary progenitor stellar mass ratio (. 5) of VCC 848 has been estimated in Paper I. This upper limit was obtained by ignoring the contribution of the secondary progenitor to the cen-tral exponentially declining part of the stellar light dis-tribution of VCC 848, and the mass estimate for the secondary only takes into account of the stellar light ex-cess (mainly) caused by stellar shells towards large radii. Since the outlying stellar shells of the merger remnant consist of the least bounded stars stripped from the out-skirts of the secondary progenitor (e.g., Quinn 1984), it is plausible that at least a similar fraction of stars that initially inhabited smaller radii of the secondary has been deposited into the inner part of the remnant. Therefore, the true primary-to-secondary stellar mass
ratio may be something close to 2 (i.e., 5-1:1+1), which is adopted in our simulations, with M?,primary= 1.4×10⁸ M and M?,secondary= 0.7×10⁸M . The corresponding dark matter halo mass ratio is' 1.3, with Mh,primary= 5.3×10¹⁰M
and Mh,secondary= 4.2×10¹⁰M . We note that the stellar to dark matter halo mass ratio decreases steeply with decreasing stellar (or halo) mass towards the low mass end and the dark matter halo accounts for ≥ 99% of the total mass budget (and hence the grav-itational force) of each galaxy in our simulations. This means that the halo mass ratio and merging timescale are not very sensitive to the exact choice of stellar mass ratio. For example, an increase of the stellar mass ra-tio by a factor of 2 leads to merely a ∼ 20% increase in the halo mass ratio. Lastly, the exponential stellar disk scalelength of the simulated primary progenitor is set to 1.0 kpc while the scalelength of the secondary is set to be 0.8 kpc, in general accord with the luminosity-scalelength relation followed by nearby dwarf irregular galaxies (e.g.,Hunter et al. 2006).
6.1.2. Orbit Geometry
The setup for the orbit geometry of the merging pair is guided by the observed stellar light distribution of VCC
848 (Paper I). Firstly, the remarkably extended outlying stellar shells that are largely aligned along the east-west direction implies a nearly radial encounter that is largely perpendicular to the line of sight direction. Secondly, the stellar main body of VCC 848 is twisted by∼ 10◦ from the center to larger radii, which implies a moderately off-center collision. Thirdly, the major axis of the stellar main body is highly inclined with respect to the direc-tion of shell alignment, which implies a non-coplanar collision. Given these observational hints, we adopt the following initial orbit geometry and disk orientation in our simulations. The two progenitor galaxies are initially 50 kpc apart, and they approach each other with a rel-ative velocity of 50 km s−1 along the collision direction and a sideways velocity of 10 km s−1. Regarding the rel-ative orientation of the galaxy disks, we ran several tests and achieve the best match to the observations when the disk plane of the primary (secondary) progenitor is in-clined at ' 60◦ (90◦) with respect to the orbital plane and the disk planes of both progenitors are parallel with the sideways direction. An illustration of the 3D view of the star particle distribution at a pre-encounter moment is shown in Figures10.
We note that the relative approaching velocity is cho-sen to be smaller than the primary’s escape velocity (∼ 77 km s−1 at a virial radius of∼ 75 kpc). A larger ap-proaching velocity delays the instant when the coales-cence occurs and shells start to form, but makes little difference to the number of passages after coalescence nor to the final appearance. In addition, after testing with several different sideways velocities, we find that, while a sideways velocity is needed to make off-center collision and asymmetrical distribution of shells along the collision direction, the choice of its exact value is not crucial, due to a rapid orbital decay of the secondary caused by dynamical friction.
6.2. Results of the Simulations
We invoke two representative simulations to discuss the progenitor properties and the merging process of VCC 848. Both simulations adopt a 2:1 gas-to-stellar mass ratio for the primary progenitor, but they differ in the gas content of the secondary progenitor. Specifically, the secondary progenitor is gas-free in the first simula-tion (hereafter S1) but has a 1:1 gas-to-stellar mass ratio in the second simulation (hereafter S2). As we will show, it is not possible to constrain the exact gas richness of the secondary, but we can use a 1:1 ratio in the S2 simu-lation to demonstrate whether the secondary is expected to be star or gas dominated. Figures11and13show the projected spatial distributions of star/gas particles at selected snapshots of the S1 and S2 simulations,
respec-tively. In the following subsections, we will first invoke the S1 simulation to discuss the merging stage of VCC 848 and then the S2 simulation to discuss the impact of a gas-bearing secondary progenitor on the merger.
6.2.1. Reproducing the Stellar Shells of VCC 848 The most prominent tidal features in VCC 848 are the three outlying interleaved stellar shells, among which the innermost one has significantly higher stellar sur-face densities, sharper outer edges and smaller opening angle than the other two. Based on the S1 simulation, the projected star particle density distributions around ' 1.4 Gyr since the first close encounter of the two sim-ulated galaxies match the above-described tidal features of VCC 848 best (Figure11). We however note that the two outermost shells of VCC 848 have somewhat less smooth outer edges than do the ones in the S1 simu-lation. This may be ascribed to the secondary progen-itor of VCC 848 being gas-bearing rather than gas-free as assumed in the S1 simulation (see the next two sec-tions for more discussion). By the best-match moment, the progressively disassembled secondary progenitor has crossed through the primary for more than 7 times. The secondary starts to be dismantled after making the 3rd passage through the primary, and since then, one new stellar shell is produced every time the secondary crosses though the primary. While the outlying extended stellar shells are largely aligned along the east-west direction, as is observed in VCC 848, the direction of alignment of the shells produced near or after the best-match moment ap-pears to be tilted toward the major-axis direction of the primary. This may partly explain the observed isophotal twist of the stellar main body of VCC 848.
6.2.2. Response of the Gas Component
The gas and stellar components of the primary pro-genitor respond to the gravitational disturbances in a similar manner, except that the gas component de-velops much narrower tidal features than the stellar component, in general agreement with previous simu-lations of star-dominated galaxy mergers (e.g., Barnes
& Hernquist 1996). By the moment that the
simula-tion matches the stellar light distribusimula-tion of VCC 848, the gas component has largely settled into the warped central disk, with few gas particles associated with the extra-planar stellar tidal arms emanating from the pri-mary, which should be attributed to orbital energy dissi-pation (through shock heating and radiative cooling) of the gas entrained in (self-)intersecting tidal arms. The fraction of gas particles with relatively high local (vol-ume) number densities, as is illustrated in Figure 12, increases steadily during the course of merging. About 7% of the 50,000 gas particles end up in the central 0.1