HAL Id: hal-00302789
https://hal.archives-ouvertes.fr/hal-00302789
Submitted on 21 May 2007HAL is a multi-disciplinary open access
archive for the deposit and dissemination of sci-entific research documents, whether they are pub-lished or not. The documents may come from teaching and research institutions in France or abroad, or from public or private research centers.
L’archive ouverte pluridisciplinaire HAL, est destinée au dépôt et à la diffusion de documents scientifiques de niveau recherche, publiés ou non, émanant des établissements d’enseignement et de recherche français ou étrangers, des laboratoires publics ou privés.
Lightning and convection parameterisations ?
uncertainties in global modelling
H. Tost, P. Jöckel, J. Lelieveld
To cite this version:
H. Tost, P. Jöckel, J. Lelieveld. Lightning and convection parameterisations ? uncertainties in global modelling. Atmospheric Chemistry and Physics Discussions, European Geosciences Union, 2007, 7 (3), pp.6767-6801. �hal-00302789�
ACPD
7, 6767–6801, 2007 Lightning and convection parameterisation uncertainties H. Tost et al. Title Page Abstract Introduction Conclusions References Tables Figures ◭ ◮ ◭ ◮ Back Close Full Screen / EscPrinter-friendly Version Interactive Discussion Atmos. Chem. Phys. Discuss., 7, 6767–6801, 2007
www.atmos-chem-phys-discuss.net/7/6767/2007/ © Author(s) 2007. This work is licensed
under a Creative Commons License.
Atmospheric Chemistry and Physics Discussions
Lightning and convection
parameterisations – uncertainties in
global modelling
H. Tost, P. J ¨ockel, and J. Lelieveld
Atmospheric Chemistry Department, Max-Planck Institute for Chemistry, P.O. Box 3060, 55020 Mainz, Germany
Received: 13 April 2007 – Accepted: 4 May 2007 – Published: 21 May 2007 Correspondence to: H. Tost ([email protected])
ACPD
7, 6767–6801, 2007 Lightning and convection parameterisation uncertainties H. Tost et al. Title Page Abstract Introduction Conclusions References Tables Figures ◭ ◮ ◭ ◮ Back Close Full Screen / EscPrinter-friendly Version Interactive Discussion
Abstract
The simulation of convection, lightning and subsequent NOx emissions with global
at-mospheric chemistry models is associated with large uncertainties since these pro-cesses are heavily parameterised. Each parameterisation by itself has deficiencies while the combination substantially increases the uncertainties from the individual pa-5
rameterisations. In this study several combinations of state-of-the-art convection and lightning parameterisations are used in model simulations with the global atmospheric chemistry model ECHAM5/MESSy and are evaluated against lightning observations. A wide range in the spatial and temporal variability of the simulated flash densities is found, attributed to both types of parameterisations. Some combinations perform well, 10
whereas others are hardly applicable. In addition to resolution dependent rescaling parameters, each combination of lightning and convection schemes requires individual scaling to reproduce the observed flash frequencies. The resulting NOx profiles are
inter-compared, but definite conclusions about the most realistic profiles can currently not be provided.
15
1 Introduction
Lightning represents one of the most energetic phenomena in the Earth’s atmosphere. In the troposphere flashes are the only natural process that can break up the highly sta-ble triple bonds of molecular nitrogen, transforming N2 into reactive nitrogen species which strongly influence the chemistry of the upper troposphere (e.g.Labrador et al., 20
2005;Schumann and Huntrieser,2007, and references therein). Therefore, an accu-rate representation of lightning in global models of the atmosphere is crucial. Addition-ally, lightning represents an important factor in the ignition of wild fires (e.g.Jacobson, 2002).
In contrast to small scale process models (e.g. Barthe et al., 2005) atmospheric 25
ACPD
7, 6767–6801, 2007 Lightning and convection parameterisation uncertainties H. Tost et al. Title Page Abstract Introduction Conclusions References Tables Figures ◭ ◮ ◭ ◮ Back Close Full Screen / EscPrinter-friendly Version Interactive Discussion electrical circuit, e.g. the electrical field and the detailed processes involved in cloud
electrification and discharges. Instead the lightning and the subsequent NOxformation are determined with the help of (semi-)empirical parameterisations. Since it is difficult to measure such emissions in situ or by remote sensing, there is a high uncertainty in the total amount of NOx produced by lightning, i.e. ranging from 2 to 12 Tg N/yr (e.g. 5
Beirle et al.,2004;Schumann and Huntrieser,2007). The occurrence of flashes on the other hand can be observed from satellites, e.g. the LIS/OTD missions (Christian et al.,1999, 2003; Thomas et al., 2000), and an extensive climatology over the last decade has been established and used for comparisons with parameterisations. Even if the occurrence of flashes could be predicted accurately by the model, uncertainties 10
in the NOx emissions remain, since the amount of NOx produced per flash is not a constant. It varies with flash strength, extension, type, branching, and additional as-pects. The amount of NOxper flash in a “typical thunderstorm” varies by more than an
order of magnitude ((2−40)×1025NO molecules per flash) (Schumann and Huntrieser, 2007). Nevertheless, the accurate prediction of flash occurrence is a prerequisite to 15
estimate lightning produced NOx emissions in the upper troposphere. A problem with
most parameterisations (some will be described in detail below) is that they are mainly derived empirically from correlations between other observable quantities. However, their applicability to the global scale and extended time periods of several years is limited since the heterogeneity of phenomena can only be represented approximately. 20
Nevertheless, these parameterisations are used in global AC-GCMs since simulated lightning events should coincide with the occurrence of convection and the assimila-tion of observed flashes at every model timestep is computaassimila-tionally not feasible and not necessarily consistent with the occurrence of convection in the model. Further-more, for calculation of future scenarios such techniques are not applicable and the 25
lightning has to be parameterised. Petersen and Rutledge(1998) found a relationship between convective precipitation and lighting with the goal to estimate the rain rate from observed flashes. Even though a precipitation estimate can be made from light-ning events, this study concludes that this is only valid for long-term averages, and not
ACPD
7, 6767–6801, 2007 Lightning and convection parameterisation uncertainties H. Tost et al. Title Page Abstract Introduction Conclusions References Tables Figures ◭ ◮ ◭ ◮ Back Close Full Screen / EscPrinter-friendly Version Interactive Discussion to individual precipitation and related lightning events (Petersen and Rutledge,1998).
Further studies ofPetersen et al.(2005) combining satellite observations of precipita-tion ice water content and flashes show that the correlaprecipita-tion of these two parameters can be applied globally, almost for individual events, but unfortunately convection pa-rameterisations include too strongly simplified cloud microphysics so that the ice water 5
content is difficult to determine accurately. Therefore, the implementation of a lightning parameterisation for GCMs based on the ice water content is not straight-forward. On the other hand, the simulation of lightning based on convection parameterisations offers the possibility to investigate how realistic these schemes describe the processes. In a previous study (Tost et al.,2006) we analysed convection on a global scale with respect 10
to temperature and the hydrological cycle using several convection parameterisations, but did not discuss the convective dynamics, e.g. the convective mass fluxes. With the help of the updraft based lightning schemes (details below), the updraft strength can be correlated to the observable quantity of flashes.
The next section introduces the model and the parameterisations used, Sect.3 the 15
simulation setup. Section 4 presents the analysed results, and the conclusions are given in Sect.5.
2 Model description
In this study the AC-GCM ECHAM5/MESSy (E5/M1) (J ¨ockel et al., 2006) has been applied. It is based on the general circulation model ECHAM5 (Roeckner et al.,2006) 20
(version 5.3) and the Modular Earth Submodel System (J ¨ockel et al., 2005) (version 1.3).
Most of the meteorological processes are calculated by ECHAM5 based on a spec-tral representation of the prognostic variables vorticity, divergence, temperature, and the logarithm of the surface pressure, as well as grid point representations of specific 25
humidity, cloud water, and cloud ice. In the vertical a hybrid pressure coordinate sys-tem is applied. The processes of radiation and cloud microphysics are parameterised,
ACPD
7, 6767–6801, 2007 Lightning and convection parameterisation uncertainties H. Tost et al. Title Page Abstract Introduction Conclusions References Tables Figures ◭ ◮ ◭ ◮ Back Close Full Screen / EscPrinter-friendly Version Interactive Discussion as described in the ECHAM5 documentation (Roeckner et al.,2003,2004).
Additionally, the MESSy infrastructure and some of the submodels, i.e. an extended convection submodel (Tost et al., 2006) containing additional parameterisations, an extended lightning NOxemission submodel (LNOX) and the diagnostic tropopause and planetary boundary layer height submodel (TROPOP) have been used.
5
2.1 Convection parameterisations
The convection parameterisations included in the CONVECT submodel are:
– The Tiedtke (1989) scheme with modifications by Nordeng (1994) (further de-noted as T1). This scheme is used as the default convection parameterisation.
– The convection parameterisation of the operational ECMWF model (IFS cycle
10
29r1b, further denoted as EC) (Bechtold et al., 2004, and references therein), which is a further development of theTiedtke(1989) scheme;
– The Zhang-McFarlane-Hack scheme (Zhang and McFarlane,1995;Hack,1994) (ZH) as applied in the MATCH model (Rasch et al.,1997;Lawrence et al.,1999) and a version with an extended evaporation scheme (Wilcox,2003), denoted as 15
ZHW;
– The scheme ofBechtold et al.(2001), further denoted as B1.
For a more detailed comparison of these schemes, their detailed configurations and extensions, and their influence on the hydrological cycle we refer toTost et al.(2006) andTost(2006).
20
2.2 Lightning parameterisations
The LNOX submodel applied in this study encompasses the widely used lightning NOx parameterisation byPrice and Rind(1992) with further updates (Price and Rind,1993,
ACPD
7, 6767–6801, 2007 Lightning and convection parameterisation uncertainties H. Tost et al. Title Page Abstract Introduction Conclusions References Tables Figures ◭ ◮ ◭ ◮ Back Close Full Screen / EscPrinter-friendly Version Interactive Discussion 1994;Price et al.,1997a,b) based on the correlation between the convective cloud top
height and the occurrence of flashes derived from regional observations (P cth):
Fc= 3.44 × 10⁻⁵
· H4.90 (1)
Fo= 6.40 × 10⁻⁴· H1.73,
with Fc representing the continental and Fo the oceanic flash frequencies and H the
5
convective cloud top height in kilometres above ground. For each grid box the total flash frequency is determined by weighting with the fractional land-sea mask. In addition, the parameterisation by Grewe et al. (2001) is included, linking updraft velocity as a measure of convective strength and associated cloud electrification with the flash frequency (G updr): 10 F = 1.54 × 10⁻⁵ · (w · d0.5)4.9, with : (2) d = cloud topX i =cloud bottom hi w = cloud topX i =cloud bottom Mi/ρi(hi/d ),
withF the flash frequency, w the updraft velocity, hi the grid box height, d the cloud
thickness, Mi the updraft mass flux and ρi the air density. Note that there is no dif-15
ferentiation between land and sea, assuming that the weaker intensity of convection (and consequently less intense cloud electrification) over the ocean is represented ad-equately by the convection parameterisation. Allen and Pickering(2002) propose two additional polynomial parameterisations for lightning occurrence, one also based on the updraft strength at a specific altitude (A updr):
20
Fcg=a + b · M+c · M2+d · M3+e · M4, (3)
and another on the amount of convective precipitation at the surface (A prec):
ACPD
7, 6767–6801, 2007 Lightning and convection parameterisation uncertainties H. Tost et al. Title Page Abstract Introduction Conclusions References Tables Figures ◭ ◮ ◭ ◮ Back Close Full Screen / EscPrinter-friendly Version Interactive Discussion with M the updraft mass flux at 0.44 σ, and P the convective precipitation
at the surface (only for precipitation stronger than 7 mm/day). The parameters
a, b, c, d , e, ai, bi, ci, di, ei are constant, but the parameters for the precipitation based approach depend on land or ocean surface. For the total flashes (over both land and ocean) calculated with the A prec scheme a weighting with the fractional land-sea 5
mask has been applied (similar to the P cth scheme). Note that these polynomial parameterisations determine the cloud-to-ground flashes (Fcg) only, whereas the first two approaches give the total flash frequency (cloud-to-ground and in-cloud). Nev-ertheless, with the help of the relationship between cloud-to-ground and total flash frequency by Price and Rind(1993), for all four schemes the total amount of flashes 10
and the fractionation into cloud-to-ground and in-cloud can be determined.
3 Simulation setup
A set of five simulations has been performed in a horizontal resolution of T42 (≈2.8◦
×2.8◦ of the corresponding quadratic Gaussian grid) and 31 layers in the ver-tical direction (the midpoint of the uppermost layer is at 10 hPa). In each simulation all 15
four lightning parameterisations are applied simultaneously and the emitted NOxis
ver-tically distributed according to a parameterisation ofPickering et al.(1998). Horizontal resolution dependent scaling factors for the flash densities have been applied as pro-posed in the original articles describing the lightning parameterisation schemes. The individual simulation setups differ only with respect to the convection scheme selected 20
via a namelist. Consequently, all simulations have been performed with the same ex-ecutable. Because of the feedback of the convection on the atmospheric dynamics the meteorology is different for each simulation. The simulation is performed for the year 1999, with several months of model spin-up. To overcome the issues of different meteorology in the various simulations the “nudging” (Newtonian relaxation) technique 25
(Jeuken et al.,1996;van Aalst et al.,2004;J ¨ockel et al.,2006) with ECMWF – oper-ational analysis data of vorticity, divergence, temperature and surface pressure for the
ACPD
7, 6767–6801, 2007 Lightning and convection parameterisation uncertainties H. Tost et al. Title Page Abstract Introduction Conclusions References Tables Figures ◭ ◮ ◭ ◮ Back Close Full Screen / EscPrinter-friendly Version Interactive Discussion year 1999 is applied. Even though the influence of the nudging is relatively small, it is
sufficient to achieve similar meteorological patterns as observed in this specific year.
4 Results
Observational datasets
Observed lightning data is used from the LIS (Christian et al., 1999; Thomas et al., 5
2000) and OTD (Christian et al.,2003) satellite instruments1. In this study the gridded products of the time series for the year 1999 are applied as well as annual and daily climatologies (both at high (0.5◦) and low (2.5◦) resolution).
Additionally, satellite data from the Tropical Rainfall Measuring Mission (TRMM) (Kummerow et al.,2000), i.e. the 3A25 product2, are used for the comparison of light-10
ning data with observed convective cloud properties (convective precipitation, cloud top height). This is suitable since all satellite products are obtained from the same space platform.
4.1 Annual average lightning distributions
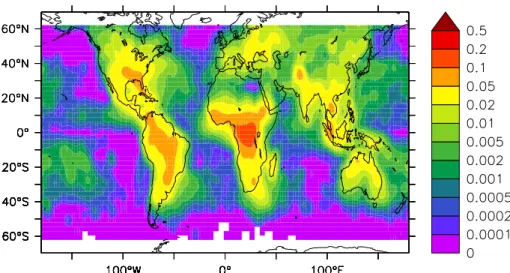
Figure 1 shows the annual average flash density for the year 1999 taken from the 15
long-term time series of observed flashes from combined LIS and OTD data, i.e. the LISOTD LRTS V2.2 dataset. The displayed region is restricted to 60◦S to 60◦N
be-cause of the viewing angle of the satellite. The observed maxima occur over the con-tinents, especially in Central Africa, with secondary maxima over South America and
1
obtained from the Global Hydrology Resource Centre: http://thunder.msfc.nasa.gov/data/
2
monthly mean gridded data from the precipitation radar, a 13.8 GHz radar, one of three rain instruments carried on board the TRMM satellite, with the ability to retrieve three-dimensional precipitation characteristics
ACPD
7, 6767–6801, 2007 Lightning and convection parameterisation uncertainties H. Tost et al. Title Page Abstract Introduction Conclusions References Tables Figures ◭ ◮ ◭ ◮ Back Close Full Screen / EscPrinter-friendly Version Interactive Discussion the islands of the maritime continent. Note that the colour scale of Fig.1is logarithmic,
because of the large contrast in flash densities over the continents and the oceans. Figure2shows the simulated flash densities with the different convection and light-ning parameterisations. The colour scale is identical to that of Fig.1. However, the simulated flash frequency had to be rescaled with the average number of flashes per 5
second over the globe (48.81 flashes/s for the year 1999, regridded on the model coor-dinates, from 60◦S to 60◦
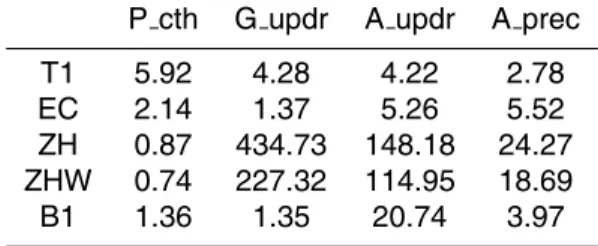
N). The scaling factors for the different model setups are listed in Table1. This scaling, in addition to the resolution dependent rescaling mentioned above in the formulation of the lightning parameterisation, is needed for comparison and forces the results into the same range as observed.
10
These scaling factors differ by almost three orders of magnitude, showing the large variation of the input data from the different convection schemes for each of the light-ning parameterisations. Using the convective cloud top height based parameterisation (P cth, Eq.1) (first column of Fig.2) all simulations show the strong contrast between ocean and land. However, the oceanic flash densities are systematically too low by 15
approximately a factor of 2 to 10. The maximum values occur mainly over South Amer-ica whereas the high flash densities over AfrAmer-ica are captured only with the ZH, the ZHW and the B1 simulation (lower three panels of the first column). Except for the EC simulation the simulated lightning activity over the maritime continent is substan-tially overestimated. In the midlatitudes of the northern hemisphere the simulated flash 20
density is lower than observed, most pronounced in the southern part of the USA. The updraft based lightning parameterisation of Grewe et al.(2001) (Eq. 2) (second column of Fig. 2) results in an overestimated lightning activity over the ocean com-pared to the observations. In combination with the T1 and EC convection schemes the simulated flash density represents the observed patterns, whereas the African maxi-25
mum is not captured accurately. However, the T1/G updr combination (second panel in the first row) yields higher values in the Southern USA, whereas in Siberia the oc-currence of flashes is significantly underestimated. Even though the lightning activity over the ocean is overestimated, very high lightning activity over the continents occurs
ACPD
7, 6767–6801, 2007 Lightning and convection parameterisation uncertainties H. Tost et al. Title Page Abstract Introduction Conclusions References Tables Figures ◭ ◮ ◭ ◮ Back Close Full Screen / EscPrinter-friendly Version Interactive Discussion less frequently and less localised in combination with T1 and EC. The simulations with
the ZH and ZHW convection schemes are characterised by significant lightning in the midlatitude storm tracks, where a weaker land-sea contrast occurs, and stronger dif-ferences over land and sea in the tropics and subtropics. In some regions, especially over mountain slopes (Himalaya, Andes) very high flash densities are calculated. The 5
latter effect results partly from the convection scheme which computes high convective mass fluxes at these locations. The combination of the B1 convection with the G updr lightning results in very spotty flash occurrences. The observed flash distribution is not well reproduced. This is obviously caused by the strong exponential dependency of the lightning frequency on the vertical velocity, because applying the same mass fluxes 10
with the A updr scheme, these spikes do not occur (compare third panel of the last row). Additionally, the possible occurrence of unrealistically strong shallow convection can affect the mean vertical velocity within the cloud, whereas for the A updr scheme the updraft strength at 0.44σ, i.e. approx. 500 hPa is used.
Using the polynomial fit of updraft for the flash frequency (A updr, Eq.3), the lightning 15
over the ocean is even more strongly overestimated as with G updr, and the continen-tal maxima are substantially underestimated when it is applied in combination with the T1 and EC convection (upper two panels of the third row of Fig.2). Furthermore, the extratropical continental lightning density is too low. In combination with the ZH and ZHW convection a similar distribution as with the G updr occurs with the maxima in the 20
same locations, not capturing the observed ones, especially over the continents. This cannot be attributed to shallow convection, but rather to the total number of convective events. Moreover, the updrafts in the middle and upper troposphere are substantially weaker compared to the other schemes, which results in the high rescaling factors for these combinations in Table1, but they are more widely distributed over large regions 25
of the globe. The strong activity in the storm tracks results from the setup of the con-vection parameterisation: in the midlatitudes the adjustment scheme following the ap-proach ofHack(1994) instead of the deep convection ofZhang and McFarlane(1995) is activated. This results in an overestimation of the convection and consequently an
ACPD
7, 6767–6801, 2007 Lightning and convection parameterisation uncertainties H. Tost et al. Title Page Abstract Introduction Conclusions References Tables Figures ◭ ◮ ◭ ◮ Back Close Full Screen / EscPrinter-friendly Version Interactive Discussion underestimation of large scale condensation processes (compare Tost et al., 2006).
Additionally, this might be partly caused by the nudging, since the boundary layer sta-bility is directly involved in the triggering of the convection algorithm. The nudging causes slightly enhanced stability, since for the nudged temperature profile, convection and boundary layer parameterisations have been applied at data generation. This can 5
cause a decrease of the convective activity. A simulation without nudging showed sub-stantially stronger mass fluxes in the middle and upper troposphere (Tost,2006). In contrast, the combination with the B1 convection results in a much smoother lightning distribution. The absolute maximum in Central Africa is shifted too far northward, and the flash density is overestimated over the tropical oceans, while localised events such 10
as with G updr do not occur (as mentioned above) if the mass flux at about 500 hPa is used to determine the number of flashes. The precipitation based approach ofAllen and Pickering (2002) (Eq.4) combined with the T1 convection (upper panel in the last row) does not reproduce the observed land-sea contrasts. The maximum in Central Africa is underestimated as well as the flash densities in Europe, North America and 15
Siberia. On the other hand, the values in the ITCZ over all oceans, the warm pool region and the SPCZ are overestimated by a factor of 5 to 10. Some of these high values over the ocean do not occur when used with the EC convection scheme, but still the oceanic flash density is overestimated compared to the observations. This re-sults from the lower total amount of convective precipitation than with T1 produced in 20
this regions (compare Tost et al., 2006). However, in South America, higher values than observed are simulated, and the maximum over Central Africa is poorly repro-duced. Similarly to T1, the occurrence of lightning in the continental midlatitudes of the Northern hemisphere is underestimated, since the contribution of convective precipi-tation during frontal passages may be too low, i.e. the nimbostratus clouds associated 25
with midlatitude precipitation are not formed by the convection but by the large-scale condensation scheme. The ZH and ZHW convection schemes, which yield a strong difference between precipitation over land and sea (Tost et al.,2006), capture the dis-tribution slightly better, but strongly overestimate the flash frequency over the tropical
ACPD
7, 6767–6801, 2007 Lightning and convection parameterisation uncertainties H. Tost et al. Title Page Abstract Introduction Conclusions References Tables Figures ◭ ◮ ◭ ◮ Back Close Full Screen / EscPrinter-friendly Version Interactive Discussion continents (especially ZH). On the other hand, in the midlatitudes continental lightning
is underestimated, though less compared with the other convection schemes. The combination of B1 and A prec results in a more realistic distribution of the annual av-erage flash density. Even though the maximum over Central Africa is underestimated, and the values over the tropical oceans overestimated, the general patterns are cap-5
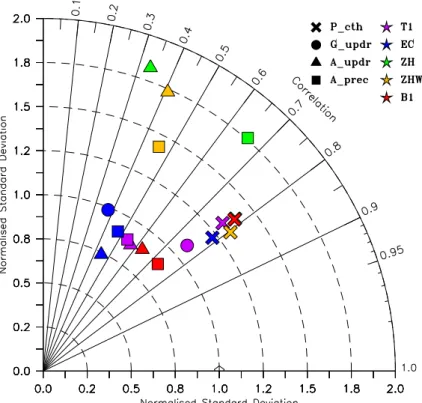
tured quite well, and especially the extreme values over specific locations do not occur. A statistical comparison of the observed and simulated annual average flash densi-ties is shown with the help of a Taylor diagram in Fig.3(Taylor,2001). In combination with the P cth scheme the overall performance of all convection schemes is very sim-ilar (all “X”s are closely together, the green and the red ones mainly overlay). This 10
indicates a very robust behaviour of this approach. However, even though the cloud top height differs and depends on the scheme, the average distribution agrees well in all simulations. The correlation (R≈0.75 to 0.8) is highest for these combinations,
but the spatial variation is slightly overestimated (σ⋆≈1.2 to 1.4 with σ⋆=σsim/σobs).
The T1/G updr combination achieves a similar correlation, but a lowerσ⋆ indicating a 15
better performance in this simulation setup. However, it must be considered that this approach is not working well with the other convection parameterisations since it is highly dependent on the vertical updraft velocity. WhileR is much lower for EC/G updr, σ⋆is close to one, whereas the symbols for ZH, ZHW and B1 are out of scale (σ⋆>2).
The polynomial fit of lightning and mass fluxes at about 500 hPa is slightly more robust, 20
but shows a large scatter in combination with the convection parameterisations. None works as well as the P cth approach, with respect to both correlation and spatial varia-tion. The precipitation based approach underestimates the spatial variation for T1, EC, and B1, but overestimates it for ZH and ZHW, resulting from a worse agreement of the precipitation distributions of the latter two schemes (Tost et al.,2006). Especially the 25
combination B1/A prec works almost as well as T1/G updr in capturing the observed flash density distribution.
ACPD
7, 6767–6801, 2007 Lightning and convection parameterisation uncertainties H. Tost et al. Title Page Abstract Introduction Conclusions References Tables Figures ◭ ◮ ◭ ◮ Back Close Full Screen / EscPrinter-friendly Version Interactive Discussion 4.2 Applicability of lightning parameterisations
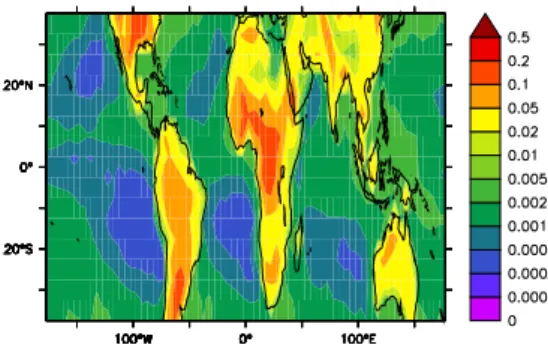
To check the applicability of the lightning parameterisations monthly mean TRMM ob-servations between 40◦N and 40◦S are used with the P cth scheme as depicted in
Fig.4.
Using the cloud top based parameterisation with the observed cloud top heights (5 5
and 0.5 degree resolution) and applying a similar rescaling (for the high resolution data figure not shown) the maximum in Central Africa is well reproduced with respect to shape, position and strength for the low resolution data (for the high resolution data, the maximum is located too far northward), whereas in the northern part of South America lower values than observed are calculated. Additionally, the highest values 10
for the flash occurrence over South America are shifted southward and to the Andes. In North America the highest flash density is not calculated only in the Southeast, but also more to the West. In Indonesia, flash rates similar to the observed are calculated from the observed cloud top height. The flash densities over the ocean are much smaller than over the continents, in agreement with the observed land-sea contrast. 15
Even though high cloud top heights in the Himalaya region are observed from TRMM the resulting flash densities are relatively low due to the high surface elevation which leads to a smaller vertical extension of the cloud. The land-sea contrast and the main features of the spatial distribution can be reproduced with these calculations. However the correlation of the observed flash densities with the calculated flash densities from 20
the observed cloud top heights is not better than for the model results, withR=0.74
for the low resolution andR=0.69 for the high resolution TRMM convective cloud top data, indicating that the monthly mean cloud top heights are probably not sufficient to reproduce the observed flash frequencies.
A similar comparison of offline calculated flash frequencies with the A prec param-25
eterisation is not possible since it is designed for strong individual precipitation events with a threshold value of more than 7 mm/day, which is hardly reached in the monthly averaged TRMM data. Nevertheless, the correlation between the annual average
con-ACPD
7, 6767–6801, 2007 Lightning and convection parameterisation uncertainties H. Tost et al. Title Page Abstract Introduction Conclusions References Tables Figures ◭ ◮ ◭ ◮ Back Close Full Screen / EscPrinter-friendly Version Interactive Discussion vective precipitation and flash densities is determined to analyse, if the spatial
distri-bution can be correctly reproduced as stated byPetersen and Rutledge(1998). The correlation isR=0.33 for the low resolution and R=0.32 for the high resolution annual
average TRMM convective precipitation fields with the annual average observed flash densities for the year 1999. Consequently, a significant correlation, as seen in Fig.3 5
for the precipitation based lightning scheme, results mainly from the suitable fit of the strong precipitation events (stronger than 7 mm/day) and only to a minor degree from the average precipitation distribution.
4.3 Annual cycle of lightning
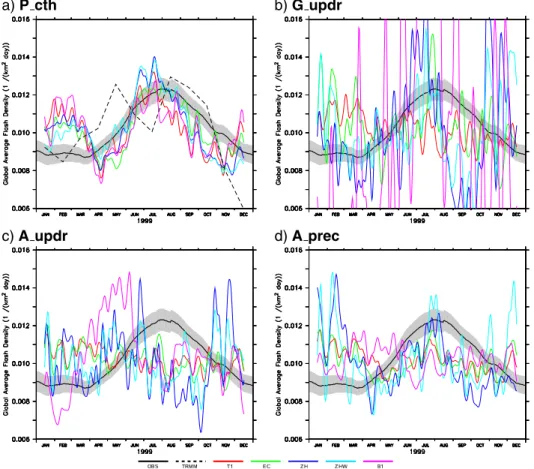
Figure5 depicts the annual cycle of the spatially averaged (from 60◦S to 60◦N) flash
10
densities in the different simulations. As expected from Fig.3using the P cth lightning parameterisation yields a similar annual cycle for all simulations (upper left panel). The black line, depicting the observed annual cycle and the grey shaded area (showing the oneσ spatial variation), show a strong maximum in boreal summer. This is also
cap-tured by the simulations, but the model calculates the highest flash densities about one 15
month earlier than observed, independent of the choice of the convection scheme. Ad-ditionally, slightly higher values than observed are simulated. Only in January, February and March, during which slightly enhanced lightning occurrence is observed, all simu-lations substantially overestimate the global average flash frequency (∼30%). Due to the scaling this leads to slightly lower values during most of the rest of the year. The 20
overestimation at the beginning of the year results mainly from the tropics (10◦S to
10◦N), since the observations show a substantially smaller maximum during the first
crossing of the equator by the ITCZ in boreal spring compared to the second maximum in autumn, whereas in the simulations both crossing events result in similar lightning activity. The lightning activity during the summer periods in each hemisphere (10◦ to
25
30◦) is captured in agreement with the observations. However, even if the observed
TRMM cloud top height is used with the P cth flash parameterisation, the annual cycle cannot be reproduced correctly, since double peaked maxima in May and August are
ACPD
7, 6767–6801, 2007 Lightning and convection parameterisation uncertainties H. Tost et al. Title Page Abstract Introduction Conclusions References Tables Figures ◭ ◮ ◭ ◮ Back Close Full Screen / EscPrinter-friendly Version Interactive Discussion calculated with significantly lower values in July (dashed line in the upper left panel of
Fig. 5). The G updr (upper right panel of Fig.5) scheme has much greater difficulty to reproduce the observed annual cycle of lightning activity. In combination with T1 the temporal variability of the simulated flash densities does not have shape features in common with the observations. Even though the variability ranges from 0.008 to 5
0.012 it does not reproduce the annual cycle. As for the P cth scheme, the largest differences between the observed and simulated annual cycle originate from the cen-tral tropics (10◦S to 10◦N) showing relatively poor agreement. The changing location
of the ITCZ with time cannot be detected in the lightning densities calculated with this parameterisation, largely independent of the convection scheme. T1 and EC show a 10
smaller variability over the year compared to ZH, ZHW and B1. Especially the latter is characterised by very large temporal extremes. In combination with the poor cor-relation, indicated by the spatial analysis in Fig. 2, this leads to the conclusion that local extrema govern the flash densities in this simulation setup. Even though the ab-solute variability is much lower when the A updr scheme is used (lower left panel of 15
Fig.5), the annual cycle cannot be reproduced with this parameterisation, either. T1 and EC show a similar behaviour as in the upper right panel, with hardly any annual cycle. The other three convection parameterisations are characterised by low values during the maximum of the observations (July, August, September) and higher values during the rest of the year. The reason for this can again be found in the central tropics, 20
where the annual cycle is not captured, or is even inverse to the observations. A sim-ilar conclusion is drawn based on the lower right panel of Fig.5, again showing large discrepancies for all convection schemes when used with the A prec flash frequency parameterisation. As before, the major differences occur between 10◦S and 10◦N, the
region with the strongest precipitation, and therefore (with this scheme) also lightning 25
activity. Comparing the annual cycle of precipitation of TRMM data in this region with the simulated flash densities from the A prec parameterisation overall agreement is found, apart from a forward shift of one month in the simulated flashes. Monthly mean precipitation data from the simulations show a very different annual cycle when T1 and
ACPD
7, 6767–6801, 2007 Lightning and convection parameterisation uncertainties H. Tost et al. Title Page Abstract Introduction Conclusions References Tables Figures ◭ ◮ ◭ ◮ Back Close Full Screen / EscPrinter-friendly Version Interactive Discussion EC are used (explaining the absence of an annual cycle), whereas ZH, ZHW and B1
capture one maximum almost correctly, but all fail in accurately describing the annual precipitation cycle.
4.4 Diurnal cycle of lightning
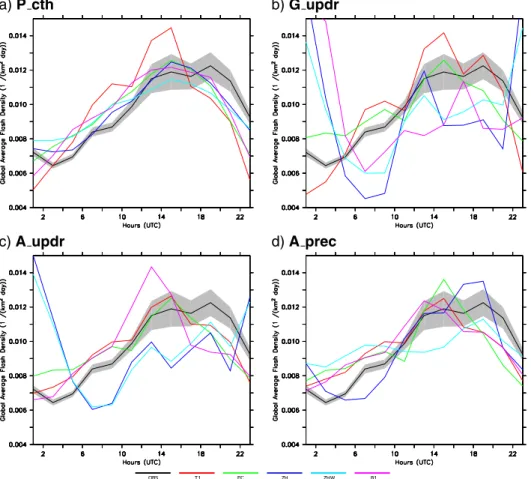
In contrast to reproducing the annual cycle the diurnal cycle of the flash densities is 5
captured much better by the model simulations, in general for all combinations of con-vection and lightning parameterisations; only ZH and ZHW perform worse in combi-nation with the updraft based lightning parameterisations. Figure6depicts the diurnal cycle in UTC. Note that for the observations it is not the daily climatology for 1999, but data from several years, i.e. the “LISOTD LRADC V2.2” dataset. The upper left 10
panel, showing the P cth scheme, is able to reproduce the first flash density maximum at 14:00 UTC (related to the African lightning activity (e.g. Price and Rind, 1994)), but the second maximum which relates to the American early afternoon is generally underestimated. Since the South American flash density is simulated well or even overestimated, this must be related to the underestimation of North American lightning 15
activity. Due to an overestimation of the maximum and the rescaling of the global flash density to the observations, the model mainly underestimates the lightning activity dur-ing the rest of the day, especially around midnight. Most of the schemes compute the diurnal cycle almost within the spatial variation of the observations being also in agree-ment with the results ofNickolaenko et al.(2006). The updraft base approach (G updr) 20
reproduces the observations well in combination with the T1 convection, especially the double peaked maxima in the afternoon and evening. With the EC convection the diurnal cycle is less pronounced. ZH, ZHW and especially B1, all shown to have prob-lems already in our earlier analyses, also fail with respect to the diurnal cycle, showing maximum values during the night, i.e. highest lightning activity in the western part of 25
South America (late afternoon in the Andes region, compare Fig.2). Using the A updr scheme, the agreement of the T1 and EC simulation with the observations is compa-rable to the P cth approach. As above, the North American lightning activity (evening
ACPD
7, 6767–6801, 2007 Lightning and convection parameterisation uncertainties H. Tost et al. Title Page Abstract Introduction Conclusions References Tables Figures ◭ ◮ ◭ ◮ Back Close Full Screen / EscPrinter-friendly Version Interactive Discussion hours in UTC) is underestimated. ZH and ZHW show a similar behaviour as with the
G updr parameterisation with highest values around midnight, but with two smaller maxima corresponding to the African and American lightning activity. B1 captures the diurnal cycle comparable to T1, with an overestimation of the first maximum and a for-ward shift of one hour, while the second maximum is not simulated. The precipitation 5
based flash parameterisation reproduces the general features, but also fails with re-spect to the second evening maximum. Only with ZHW the amplitude of the diurnal cycle is underestimated. In general, the diurnal cycle represents to some degree also the spatial patterns, since the more intense continental convection occurs usually in the early afternoon. Therefore the diurnal lightning cycle is characterised by a local 10
afternoon maximum.
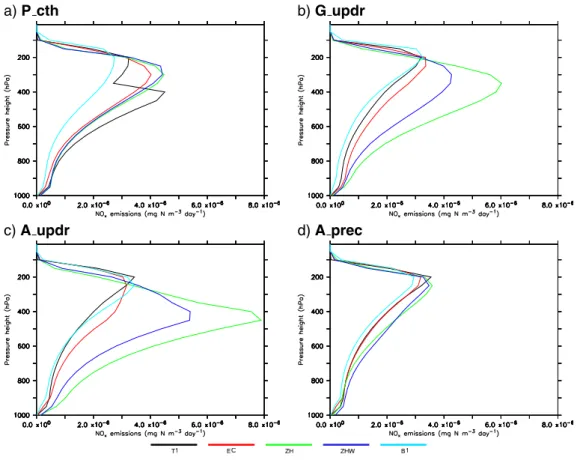
4.5 NOxemission profiles
The most important impact of lightning parameterisations in atmospheric chemistry models is on the vertical profiles of the NOx emissions. Figure 7 depicts average NOxemission profiles: the colours denote the convection schemes and the panels the
15
various lightning and subsequent emission parameterisations. The upper left panel (P cth) exhibits a similar shape for EC, ZH and ZHW after applying the flash frequency rescaling. The double peaked shape of T1 originates from the differentiation by the convection scheme between deep and midlevel convection (i.e. penetrative convection triggered above the boundary layer). Due to the formulation of the Tiedtke scheme, 20
the second type is artificially restricted to a cloud top of 400 hPa, though globally oc-curs more often than deep convection. Since the vertical extension of these clouds also extends more than 3 km they are also considered for possible lightning produc-tion and cause the lower peak. Even though the EC convecproduc-tion is also based on the original Tiedtke scheme and offers the same types of convection, the midlevel convec-25
tion cloud top is not restricted and consequently the second peak is not present. The Bechtold scheme is characterised by the emission maximum at slightly higher altitude (originating from higher cloud top levels), but of smaller magnitude. The latter effect can
ACPD
7, 6767–6801, 2007 Lightning and convection parameterisation uncertainties H. Tost et al. Title Page Abstract Introduction Conclusions References Tables Figures ◭ ◮ ◭ ◮ Back Close Full Screen / EscPrinter-friendly Version Interactive Discussion result from the different freezing altitude and consequently the partitioning into
cloud-to-ground and intra-cloud flashes. The application of the G updr parameterisation results in a similar shape of the emission profiles for T1, EC, and B1, and a maximum at lower altitude with ZHW and even lower for ZH. The height of the maximum emission differs by about 150 hPa. Additionally, the overall amounts of emitted NOx differ substantially 5
(factor of 2), even though the total number of flashes are rescaled to the observed number. Additionally, the emissions in the mid-troposphere are substantially enhanced with ZH and ZHW.
A similar result is obtained when using A updr with the different convection schemes: T1, EC, and B1 are similar in emission strength and the altitude of the maximum emis-10
sion level, whereas for ZH and ZHW the maximum is located substantially lower, while the total amount of emitted NOxis much larger. As with G updr the emissions are much
stronger between 400 and 700 hPa using ZH or ZHW. The precipitation based lightning scheme (A prec, lower right panel of Fig.7), shows approximately the same maximum emission altitude for all convection parameterisations. The total amount of emitted NOx
15
varies by 20%, being highest for T1 and ZH, and lowest for B1, while the general shape of the emission profiles is similar. Overall, using the different combinations of schemes results in very different distributions of NOxfrom lightning, even in the average profiles.
These profiles must be considered together with the spatial and temporal distribution of the lightning events to represent the instantaneous lightning NOx emissions. The 20
evaluation of the impacts of these emissions on atmospheric chemistry is beyond the scope of this study and will be analysed in a following publication.
4.6 Dependencies on the model resolution
Even though most of the lightning parameterisations take the dependence on the hor-izontal resolution into account, this is mainly done by a rescaling factor (determined 25
from the ratio of the model grid size to a reference area) that is multiplied with the flash rate. However, for some model configurations this is probably not sufficient. Instead, a new set of parameters might be required to give a better representation of the
differ-ACPD
7, 6767–6801, 2007 Lightning and convection parameterisation uncertainties H. Tost et al. Title Page Abstract Introduction Conclusions References Tables Figures ◭ ◮ ◭ ◮ Back Close Full Screen / EscPrinter-friendly Version Interactive Discussion ent convective conditions caused by the change in resolution. A sensitivity simulation
using the T1 convection scheme, but a lower vertical resolution (19 Levels, but the mid-point of the uppermost layer also at 10 hPa) results in strong differences in combination with the G updr scheme, due to differences in the convective updraft mass fluxes. For instance, the spatial distribution is captured similarly, the required rescaling factor is 5
lower and the annual cycle for the lightning activity is represented much better in this model configuration as in the 31 layer version discussed above, being comparable to the results with the P cth scheme. This leads to the conclusion that the vertical resolu-tion is quite relevant for the parameterised convective dynamics and consequently that probably the parameters of the lightning scheme must be adjusted as well, depending 10
on the vertical resolution of the model.
4.7 Potential weaknesses of the convection schemes
The analysis of the simulated lightning data in combination with the observations also indicates some weaknesses in the convection schemes:
– The convective cloud top heights differ substantially, as can be seen from the
15
range of the rescaling factors for the P cth lightning parameterisation as well as from the direct comparison of the cloud top heights. Furthermore, observed and simulated cloud top heights show significant differences, comparable to the study ofKurz and Grewe(2002).
This becomes most pronounced in South America, where in contrast to the obser-20
vations, the convection reaches deeper with most convection parameterisations than in Central Africa.
– The restriction of midlevel convection below 400 hPa in the T1 convection
parame-terisation appears to be artificial. The explicit distinction between deep convection originating close to the surface and penetrative convection starting at higher alti-25
ACPD
7, 6767–6801, 2007 Lightning and convection parameterisation uncertainties H. Tost et al. Title Page Abstract Introduction Conclusions References Tables Figures ◭ ◮ ◭ ◮ Back Close Full Screen / EscPrinter-friendly Version Interactive Discussion being developed from the original Tiedtke (1989) scheme but treating midlevel
convection similar to deep convection, does not show such a clear distinction.
– Even though the convective mass fluxes agree relatively well in the zonal averages
(Tost,2006), the updraft strength of individual convective events can be too strong and / or too localised (especially with B1). On the other hand, the average vertical 5
velocities in ZH and ZHW appear to be much lower (very high rescaling factors are required in the updraft based lightning schemes), and the convective mass fluxes in the middle and upper troposphere are lower compared to the other schemes. However, this is may be caused by the nudging.
– Oceanic convection is almost as intense as continental convection with respect
10
to the updraft strength (contradicting the assumption of the G updr lightning pa-rameterisation), since the parameterisations provides only grid box mean updraft mass fluxes. The convective precipitation over the tropical oceans is too high (see Tost et al.,2006), leading to an overestimation of the flash frequencies from the A prec parameterisation over the ocean.
15
– The annual cycle of convective events in the central tropics, i.e. the meridional
movement of the strongest convection (the ITCZ) across the equator twice a year, is not reproduced well by any of the convection schemes. It is unclear whether this is a weakness of the convection parameterisations or of the model physics in general.
20
– Even though the influence of subgrid-scale convection on the humidity and moist
static energy is captured accurately by the parameterisation independent of the model resolution, the convective dynamics can differ substantially, influencing both lightning schemes and convective tracer transport.
ACPD
7, 6767–6801, 2007 Lightning and convection parameterisation uncertainties H. Tost et al. Title Page Abstract Introduction Conclusions References Tables Figures ◭ ◮ ◭ ◮ Back Close Full Screen / EscPrinter-friendly Version Interactive Discussion
5 Conclusions
Using parameterised model results (convection) as input data for another parameteri-sation (lightning) leads to large uncertainties in the prediction of flashes and lightning produced NOx emissions. For all combinations of lightning and convection schemes
a scaling factor (in addition to the anyway performed resolution dependent rescaling) 5
must be applied to reproduce the observed global flash frequency, and these factors can differ by orders of magnitude. With none of the combinations it is possible to ac-curately reproduce the observed lightning distributions, although some combinations are more suitable than others. The P cth approach offers robustness with respect to both spatial and temporal variations of the convective events, but it is not very “phys-10
ical”, since cloud top height is not directly related to cloud electrification. The updraft approaches must be used very carefully, especially the G updr scheme, since the ex-ponential formulation tends to create unrealistically high values with strong updrafts. However, in combination with T1 this approach is among the best in reproducing the observed lightning densities. This results mainly from the development of the G updr 15
scheme in combination with this specific convection scheme in a previous model ver-sion (ECHAM4) (Grewe et al., 2001; Kurz and Grewe, 2002). The precipitation ap-proach has shown to perform acceptably for the long-term average if the observed precipitation distribution is reproduced (e.g. by B1), whereas the temporal variability is hardly captured. Especially since the correlation between observed monthly mean 20
precipitation and lightning is low, the performance is mainly a result of the fitting func-tion. The annual cycle is difficult to reproduce with all combinations, indicating general problems with the models or parameterisation concepts. Even if the lightning events agree with the observations, the resulting NOx emissions deviate due to the different
convective cloud properties (freezing level, distinction between cloud-to-ground and 25
intra-cloud flashes, etc.). From these results it is not possible to decide which emission profiles are most realistic since direct emissions are not observed. Only the combi-nation of lightning emissions with a chemistry model can be evaluated using aircraft
ACPD
7, 6767–6801, 2007 Lightning and convection parameterisation uncertainties H. Tost et al. Title Page Abstract Introduction Conclusions References Tables Figures ◭ ◮ ◭ ◮ Back Close Full Screen / EscPrinter-friendly Version Interactive Discussion observations in the anvil regions of convective clouds, which will be the focus of an
upcoming study. The large variability associated with the tested combinations points to many unresolved problems in simulating lightning and lightning produced NOx
emis-sions in atmospheric general circulation models. Some approaches, e.g. the high cor-relation between precipitation ice and flash frequencies (Petersen et al., 2005) are 5
promising, though require both improvements of the convection parameterisations with respect to ice microphysics and the development of a scheme that makes use of this relationship.
ACPD
7, 6767–6801, 2007 Lightning and convection parameterisation uncertainties H. Tost et al. Title Page Abstract Introduction Conclusions References Tables Figures ◭ ◮ ◭ ◮ Back Close Full Screen / EscPrinter-friendly Version Interactive Discussion
Appendix A Abbreviations
σ standard deviation
σsim standard deviation of the simulation results
σobs standard deviation of the observations
σ⋆ σsim/σobs
R correlation
GCM General Circulation Model
AC-GCM Atmospheric Chemistry General Circulation Model ECMWF European Centre for Medium Range Weather Forecast
E5/M1 ECHAM5/MESSy1
MATCH Model of Atmospheric Transport and Chemistry LNOX NOxemissions from lightning
TRMM Tropical Rainfall Measuring Mission
ITCZ Inner Tropical Convergence Zone
SPCZ Southern Pacific Convergence Zone
LIS Lightning Imaging Sensor
OTD Optical Transient Detector
LISOTD LRTS V2.2
Low resolution time series dataset of combined flash rates from LIS and OTD LISOTD
LRADC V2.2
Low resolution annual diurnal climatology dataset of combined flash rates from LIS and OTD
T1 Tiedkte-Nordeng convection scheme
EC convection scheme from ECMWF
ZH convection scheme of Zhang-McFarlane-Hack
ZHW convection scheme of Zhang-McFarlane-Hack with additional evaporation fol-lowing Wilcox
B1 convection scheme of Bechtold
P cth lightning parameterisation based on cloud top height (Price and Rind) G updr lightning parameterisation based on vertical velocity (Grewe)
A updr lightning parameterisation based on vertical velocity (Allen and Pickering) G updr lightning parameterisation based on convective surface precipitation (Allen
ACPD
7, 6767–6801, 2007 Lightning and convection parameterisation uncertainties H. Tost et al. Title Page Abstract Introduction Conclusions References Tables Figures ◭ ◮ ◭ ◮ Back Close Full Screen / EscPrinter-friendly Version Interactive Discussion
Acknowledgements. We acknowledge the work of H. Christian and co-workers, providing the
detailed lightning satellite observation data. We are further grateful to the TRMM satellite data team for providing their datasets. We thank V. Grewe and C. Kurz for their helpful comments to this manuscript and their contributions to the LNOX submodel development, and all the other MESSy developers for their support. Furthermore, we wish to acknowledge use of the Ferret
5
program for analysis and graphics in this paper. Ferret is a product of NOAA’s Pacific Marine Environmental Laboratory. (Information is available athttp://ferret.pmel.noaa.gov/Ferret/). This study is part of the ENIGMA project; the authors thank the Max-Planck Society for support.
References
Allen, D. J. and Pickering, K. E.: Evaluation of lightning flash rate parameterizations for use in a
10
global chemical transport model, J. Geophys. Res., 107, 4711, doi:10.1029/2002JD002066, 2002. 6772,6777
Barthe, C., Molini ´e, G., and Pinty, J.-P.: Description and first results of an explicit electrical scheme in a 3D cloud resolving model, Atmos. Res., 76, 95–113, 2005.6768
Bechtold, P., Bazile, E., Guichard, F., Mascart, P., and Richard, E.: A mass-flux convection
15
scheme for regional and global models, Q. J. R. Meteorol. Soc., 127, 869–886, 2001. 6771
Bechtold, P., Chaboureau, J.-P., Beljaars, A., Betts, A. K., K ¨ohler, M., Miller, M., and Re-delsperger, J.-L.: The simulation of the diurnal cycle of convective precipitation over land in a global model, Quart. J. Roy. Meteorol. Soc., 130, 3119–3137, 2004. 6771
Beirle, S., Platt, U., Wenig, M., and Wagner, T.: NOx production by lightning estimated with
20
GOME, Adv. Space Res., 34, 793–797, 2004. 6769
Christian, H. J., Blakeslee, R. J., Goodman, S. J., Mach, D. A., Stewart, M. F., Buechler, D. E., Koshak, W. J., Hall, J. M., Boek, W. L., Driscoll, K. T., and Boccippio, D. J.: The Light-ning Imaging Sensor, in: Proceedings of the 11th International Conference on Atmospheric Electricity, Guntersville, Alabama, 7–11 June, pp. 746–749, 1999. 6769,6774
25
Christian, H. J., Blakeslee, R. J., Boccippio, D. J., Boeck, W. L., Buechler, D. E., Driscoll, K. T., Goodman, S. J., Hall, J. M., Koshak, W. J., Mach, D. M., and Stewart, M. F.: Global frequency and distribution of lightning as observed from space by the Optical Transient Detector, J. Geophys. Res., 108, 4005, doi:10.1029/2002JD002347, 2003. 6769,6774
Grewe, V., Brunner, D., Dameris, M., Grenfell, J. L., Hein, R., Shindell, D., and Staehelin,
ACPD
7, 6767–6801, 2007 Lightning and convection parameterisation uncertainties H. Tost et al. Title Page Abstract Introduction Conclusions References Tables Figures ◭ ◮ ◭ ◮ Back Close Full Screen / EscPrinter-friendly Version Interactive Discussion
J.: Origin and variability of upper tropospheric nitrogen oxides and ozone at northern mid-latitudes, Atmos. Environ., 35, 3421–3433, 2001. 6772,6775,6787
Hack, J. J.: Parameterization of moist convection in the National Center for Atmospheric Re-search community climate model (CCM2), J. Geophys. Res., 99, 5551–5568, 1994. 6771,
6776
5
Jacobson, M. Z.: Atmopsheric Pollution, Cambridge University Press, 2002.6768
Jeuken, A. B. M., Siegmund, P. C., Heijboer, L. C., Feichter, J., and Bengtsson, L.: On the potential of assimilating meteorological analyses in a global climate model for the purpose of model validation, J. Geophys. Res., 101, 16 939–16 950, 1996.6773
J ¨ockel, P., Sander, R., Kerkweg, A., Tost, H., and Lelieveld, J.: Technical Note: The Modular
10
Earth Submodel System (MESSy) – a new approach towards Earth System Modeling, At-mos. Chem. Phys., 5, 433–444, 2005,http://www.atmos-chem-phys.net/5/433/2005/. 6770
J ¨ockel, P., Tost, H., Pozzer, A., Br ¨uhl, C., Buchholz, J., Ganzeveld, L., Hoor, P., Kerk-weg, A., Lawrence, M. G., Sander, R., Steil, B., Stiller, G., Tanarhte, M., Taraborrelli, D., van Aardenne, J., and Lelieveld, J.: The atmospheric chemistry general circulation model
15
ECHAM5/MESSy1: consistent simulation of ozone from the surface to the mesosphere, Atmos. Chem. Phys., 6, 5067–5104, 2006, http://www.atmos-chem-phys.net/6/5067/2006/.
6770,6773
Kummerow, C., Simpson, J., Thiele, O., Barnes, W., Chang, A. T. C., Stocker, E., Adler, R. F., Hou, A., Kakar, R., Wentz, F., Ashcroft, P., Kozu, T., Hong, Y., Okamoto, K., Iguchi, T.,
20
Kuroiwa, H., Im, E., Haddad, Z., Huffman, G., Ferrier, B., Olson, W. S., Zipser, E., Smith, E. A., Wilheit, T. T., North, G., Krishnamurti, T., and Nakamura, K.: The Status of the Tropical Rainfall Measuring Mission (TRMM) after two years in orbit, J. Appl. Meteorol., 39, 1965– 1982, 2000. 6774
Kurz, C. and Grewe, V.: Lightning and thunderstorms, Part I: Observational data and model
25
results, Met. Zeitschr., 11, 379–393, doi:10.1127/0941-2498/2002/0011-0379, 2002. 6785,
6787
Labrador, L. J., v. Kuhlmann, R., and Lawrence, M. G.: The effects of lightning-produced NOx
and its vertical distribution on atmospheric chemistry: sensitivity simulations with MATCH-MPIC, Atmos. Chem. Phys., 5, 1815–1834, 2005,
30
http://www.atmos-chem-phys.net/5/1815/2005/. 6768
Lawrence, M. G., Crutzen, P. J., Rasch, P. J., Eaton, B. E., and Mahowald, N. M.: A model for studies of tropospheric chemistry: Description, global distributions and evaluation, J.
ACPD
7, 6767–6801, 2007 Lightning and convection parameterisation uncertainties H. Tost et al. Title Page Abstract Introduction Conclusions References Tables Figures ◭ ◮ ◭ ◮ Back Close Full Screen / EscPrinter-friendly Version Interactive Discussion
Geophys. Res., 104, 26 245–26 277, 1999.6771
Nickolaenko, A. P., Hayakawa, M., and Sekiguchi, M.: Variations in global thunder-storm activity inferred from the OTD records, Geophys. Res. Lett., 33, L06 823, doi:10.1029/2005GL024884, 2006. 6782
Nordeng, T. E.: Extended versions of the convective parametrization scheme at ECMWF and
5
their impact on the mean and transient activity of the model in the tropics, Tech. Rep. 206,
ECWMF, 1994. 6771
Petersen, W. A. and Rutledge, S. A.: On the relationship between cloud-to-ground lightning and convective rainfall, J. Geophys. Res., 103, 14 025–14 040, 1998. 6769,6770,6780
Petersen, W. A., Christian, H. J., and Rutledge, S. A.: TRMM observations of the global
10
relationship between ice water content and lightning, Geophys. Res. Lett., 32, L14 819, doi:10.1029/2005GL023236, 2005. 6770,6788
Pickering, K. E., Wang, Y., Tao, W.-K., Price, C., and M ¨uller, J.-F.: Vertical distribution of light-ning NOxfor use in regional and chemical transport models, J. Geophys. Res., 103, 31 203– 31 216, 1998.6773
15
Price, C. and Rind, D.: A simple Lightning Parametrization for Calculating Global Lightning Distributions, J. Geophys. Res., 97, 9919–9933, 1992. 6771
Price, C. and Rind, D.: What determines the Cloud-to-Ground Lightning fraction in Thunder-storms, Geophys. Res. Lett., 20, 463–466, 1993.6771,6773
Price, C. and Rind, D.: Modeling Global Lightning Distributions in a General Circulation Model,
20
Mon. Wea. Rev., 122, 1930–1939, 1994. 6772,6782
Price, C., Penner, J., and Prather, M.: NOx from lightning, 1. Global distribution based on lightning physics, J. Geophys. Res., 102, 5929–5941, 1997a. 6772
Price, C., Penner, J., and Prather, M.: NOxfrom lightning, 2. Constraints from the global atmo-spheric electric circuit, J. Geophys. Res., 102, 5943–5951, 1997b. 6772
25
Rasch, P. J., Mahowald, N. M., and Eaton, B. E.: Representations of transport, convection and the hydrologic cycle in chemical transport models: Implications for the modeling of short-lived and soluble species, J. Geophys. Res., 102, 28 127–28 138, 1997. 6771
Roeckner, E., B ¨auml, G., Bonaventura, L., Brokopf, R., Esch, M., Giorgetta, M., Hagemann, S., Kirchner, I., Kornblue, L., Manzini, E., Rhodin, A., Schleese, U., Schulzweida, U., and
30
Tompkins, A.: The atmospheric general circulation model ECHAM5: Part 1, Tech. Rep. 349, Max-Planck-Institut f ¨ur Meteorologie, 2003. 6771
ACPD
7, 6767–6801, 2007 Lightning and convection parameterisation uncertainties H. Tost et al. Title Page Abstract Introduction Conclusions References Tables Figures ◭ ◮ ◭ ◮ Back Close Full Screen / EscPrinter-friendly Version Interactive Discussion
Schleese, U., and Schulzweida, U.: The atmospheric general circulation model ECHAM5: Part 2, Tech. Rep. 354, Max-Planck-Institut f ¨ur Meteorologie, 2004.6771
Roeckner, E., Brokopf, R., Esch, M., Giogetta, M., Hagemann, S., Kornblueh, L., Manzini, E., Schleese, U., and Schulzweida, U.: Sensitivity of simulated climate to horizontal and vertical resolution in the ECHAM5 atmosphere model, J. Clim., 19, 3771–3791, 2006. 6770
5
Schumann, U. and Huntrieser, H.: The global lightning-induced nitrogen oxides source, Atmos. Chem. Phys. Discuss., 7, 2623–2818, 2007,
http://www.atmos-chem-phys-discuss.net/7/2623/2007/. 6768,6769
Taylor, K. E.: Summarizing multiple aspects of model preformance in a single diagram, J. Geophys. Res., 106, 7183–7192, 2001. 6778
10
Thomas, R. J., Krehbiel, P. R., Rison, W., Hamlin, T., Boccippio, D. J., Goodman, S. J., and Christian, H. J.: Comparison of ground-based 3-dimensional lightning mapping observations with satellite-based LIS observations in Oklahoma, Geophys. Res. Lett., 27, 1703–1706, 2000. 6769,6774
Tiedtke, M.: A Comprehensive Mass Flux Scheme for Cumulus Parametrization in Large-Scale
15
Models, Mon. Wea. Rev., 117, 1779–1800, 1989. 6771,6786
Tost, H.: Global Modelling of Cloud, Convection and Precipitation Influences on Trace Gases and Aerosols, Ph.D. thesis, Rheinische Friedrich-Wilhelms-Universit ¨at Bonn, Germany, avail-able at: http://hss.ulb.uni-bonn.de/diss online/math nat fak/2006/tost holger, 2006. 6771,
6777,6786
20
Tost, H., J ¨ockel, P., and Lelieveld, J.: Influence of different convection parameterisations in a GCM, Atmos. Chem. Phys., 6, 5475–5493, 2006,
http://www.atmos-chem-phys.net/6/5475/2006/. 6770,6771,6777,6778,6786
van Aalst, M. K., van den Broek, M. M. P., Bregman, A., Br ¨uhl, C., Steil, B., Toon, G. C., Garcelon, S., Hansford, G. M., Jones, R. L., Gardiner, T. D., Roelofs, G.-J., Lelieveld, J., and
25
Crutzen, P.: Trace gas transport in the 1999/2000 Arctic winter: comparison of nudged GCM runs with observations, Atmos. Chem. Phys., 4, 81–93, 2004,
http://www.atmos-chem-phys.net/4/81/2004/. 6773
Wilcox, E. M.: Spatial and Temporal Scales of Precipitation Tropical Cloud Systems in Satellite Imagery and the NCAR CCM3, J. Climate, 16, 3545–3559, 2003. 6771
30
Zhang, G. J. and McFarlane, N. A.: Sensitivity of Climate Simulations to the Parameteriza-tion of Cumulus ConvecParameteriza-tion in the Canadian Climate Centre General CirculaParameteriza-tion Model, Atmosphere-Ocean, 33, 407–446, 1995.6771,6776
ACPD
7, 6767–6801, 2007 Lightning and convection parameterisation uncertainties H. Tost et al. Title Page Abstract Introduction Conclusions References Tables Figures ◭ ◮ ◭ ◮ Back Close Full Screen / EscPrinter-friendly Version Interactive Discussion
Table 1. Scaling factors for the combination of lightning and convection parameterisations.
P cth G updr A updr A prec
T1 5.92 4.28 4.22 2.78
EC 2.14 1.37 5.26 5.52
ZH 0.87 434.73 148.18 24.27
ZHW 0.74 227.32 114.95 18.69
ACPD
7, 6767–6801, 2007 Lightning and convection parameterisation uncertainties H. Tost et al. Title Page Abstract Introduction Conclusions References Tables Figures ◭ ◮ ◭ ◮ Back Close Full Screen / EscPrinter-friendly Version Interactive Discussion
Fig. 1. Observed annual average flash density in flashes/(km2 day) for the year 1999 from LIS/OTD data from 60◦S to 60◦N.
ACPD
7, 6767–6801, 2007 Lightning and convection parameterisation uncertainties H. Tost et al. Title Page Abstract Introduction Conclusions References Tables Figures ◭ ◮ ◭ ◮ Back Close Full Screen / EscPrinter-friendly Version Interactive Discussion
Fig. 2. Annual average global lightning distribution from 60◦S to 60◦N in flashes/(km2day). The
rows represent the different convection schemes (T1, EC, ZH, ZHW, B1 from top to bottom), whereas the columns depict the different lightning parameterisations (P cth, G updr, A updr, A prec from left to right).
ACPD
7, 6767–6801, 2007 Lightning and convection parameterisation uncertainties H. Tost et al. Title Page Abstract Introduction Conclusions References Tables Figures ◭ ◮ ◭ ◮ Back Close Full Screen / EscPrinter-friendly Version Interactive Discussion
Fig. 3. Taylor diagram for the various combinations of convection and lightning schemes com-pared with LIS/OTD data, showing the standard deviation of the calculated flash densities nor-malised with the standard deviation of the observationsσ⋆(on the radial axis), the correlationR
(the angle) and the RMSE (distance from the point marked with a open box with correlation of one and normalised standard deviation of one). The different convection schemes are depicted by the colours, and the lightning parameterisations by the symbols.
ACPD
7, 6767–6801, 2007 Lightning and convection parameterisation uncertainties H. Tost et al. Title Page Abstract Introduction Conclusions References Tables Figures ◭ ◮ ◭ ◮ Back Close Full Screen / EscPrinter-friendly Version Interactive Discussion
Fig. 4. Parameterised annual average flash density (in flashes/(km2day)) from TRMM monthly mean cloud top height for the year 1999, applying the P cth scheme. The lightning activity has been rescaled to the observations as described above.
ACPD
7, 6767–6801, 2007 Lightning and convection parameterisation uncertainties H. Tost et al. Title Page Abstract Introduction Conclusions References Tables Figures ◭ ◮ ◭ ◮ Back Close Full Screen / EscPrinter-friendly Version Interactive Discussion
a) P cth b) G updr
c) A updr d) A prec
Fig. 5. Average (60◦S to 60◦N, for the TRMM data only 40◦S to 40◦N) time series of the flash
density for the year 1999. The four panels show the different lightning schemes. The black line depicts the observations and the grey shaded area the spatial standard deviation. The coloured lines represent the model simulations with the different convection schemes.
ACPD
7, 6767–6801, 2007 Lightning and convection parameterisation uncertainties H. Tost et al. Title Page Abstract Introduction Conclusions References Tables Figures ◭ ◮ ◭ ◮ Back Close Full Screen / EscPrinter-friendly Version Interactive Discussion
a) P cth b) G updr
c) A updr d) A prec
Fig. 6. Global average diurnal time series of the flash density for the year 1999. The four panels show the different lightning schemes. The black line depicts the observations (multi-year climatology) and the grey shaded area the spatial standard deviation (oneσ). The coloured
ACPD
7, 6767–6801, 2007 Lightning and convection parameterisation uncertainties H. Tost et al. Title Page Abstract Introduction Conclusions References Tables Figures ◭ ◮ ◭ ◮ Back Close Full Screen / EscPrinter-friendly Version Interactive Discussion
a) P cth b) G updr
c) A updr d) A prec
Fig. 7. Vertical profiles of the annual average lightning produced NOx emissions, spatially averaged (meridional and zonal, the latter restricted to 60◦S–60◦N). As in Fig.5 the panels

![[PDF] Apprendre la programmation Android avec base de données - Free PDF Download](data:image/gif;base64,R0lGODlhAQABAIAAAP///wAAACH5BAEAAAAALAAAAAABAAEAAAICRAEAOw==)