HAL Id: hal-02402956
https://hal.archives-ouvertes.fr/hal-02402956
Submitted on 18 Jun 2020
HAL is a multi-disciplinary open access
archive for the deposit and dissemination of
sci-entific research documents, whether they are
pub-lished or not. The documents may come from
teaching and research institutions in France or
abroad, or from public or private research centers.
L’archive ouverte pluridisciplinaire HAL, est
destinée au dépôt et à la diffusion de documents
scientifiques de niveau recherche, publiés ou non,
émanant des établissements d’enseignement et de
recherche français ou étrangers, des laboratoires
publics ou privés.
Contrasting shell growth strategies in two
Mediterranean bivalves revealed by oxygen-isotope ratio
geochemistry: The case of Pecten jacobaeus and
Glycymeris pilosa
Melita Peharda, Julien Thébault, Kresimir Markulin, Bernd R. Schone, Ivica
Janekovic, Laurent Chauvaud
To cite this version:
Melita Peharda, Julien Thébault, Kresimir Markulin, Bernd R. Schone, Ivica Janekovic, et al..
Con-trasting shell growth strategies in two Mediterranean bivalves revealed by oxygen-isotope ratio
geo-chemistry: The case of Pecten jacobaeus and Glycymeris pilosa. Chemical Geology, Elsevier, 2019,
526, pp.23-35. �10.1016/j.chemgeo.2017.09.029�. �hal-02402956�
Contents lists available atScienceDirect
Chemical Geology
journal homepage:www.elsevier.com/locate/chemgeo
Contrasting shell growth strategies in two Mediterranean bivalves revealed
by oxygen-isotope ratio geochemistry: The case of Pecten jacobaeus and
Glycymeris pilosa
Melita Peharda
a,⁎, Julien Thébault
b, Kre
šimir Markulin
a, Bernd R. Schöne
c, Ivica Janekovi
ć
d,e,
Laurent Chauvaud
baInstitute of Oceanography and Fisheries, Split, Croatia
bUniversité de Bretagne Occidentale, Institut Universitaire Européen de la Mer, Laboratoire des Sciences de l'Environnement Marin (UMR6539 UBO/IRD/CNRS),
Plouzané, France
cJohannes Gutenberg-Universität Mainz, Institut für Geowissenschaften, Mainz, Germany dRudjer Bošković Institute, Division for Marine and Environmental Research, Zagreb, Croatia eThe University of Western Australia, Perth, Australia
A R T I C L E I N F O
Keywords:Sclerochronology Mediterranean Adriatic
Stable-isotope ratio geochemistry Bivalve shells
A B S T R A C T
High-resolution stable-isotope ratio data (δ18O,δ13C) were used to study growth strategies of two bivalve
species, Pecten jacobaeus (calcitic shell) and Glycymeris pilosa (aragonitic shell) from the North Adriatic Sea. The principal objectives of this study were to identify the period of the year when the growth line is formed in the shell of two target species, to identify the main growing season of these two species, to identify the environ-mental drivers of shell growth, and to evaluate the potential applicability ofδ18O and δ13C values for the
reconstruction of environmental variability. Samples were collected from the North Adriatic Sea by commercial bean trawl (P. jacobaeus, December 2013 and January 2014, N = 4) and SCUBA diver (Glycymeris pilosa, March 2016, N = 3). Samples for the oxygen (δ18O) and carbon (δ13C) isotope composition of the calcium carbonate
were collected by drilling the outer shell layer across several annual cycles. Temporal and spatial temperature and salinity values inside the investigated area were simulated using the 3D numerical ocean model - ROMS. The δ18O cycles corresponded to the number of seasonal growth marks observed on the external shell surface of both
target species, thereby confirming the annual periodicity of these growth patterns. In February 2012, extreme cooling of the water column accompanied by dense water formation occurred in the Adriatic Sea - an event recorded by P. jacobaeus shells. This study indicates that P. jacobaeus and G. pilosa have contrasting shell growth strategies. Pecten jacobaeus grows during winter and slows shell growth during the warmest part of the year, and thereby may be an interesting archive for winter conditions. Due to its longevity and continuous growth during the warmest part of the year, G. pilosa is a promising archive for the reconstruction of summer seawater tem-peratures.
1. Introduction
Over the past decade, thefield of sclerochronology has been rapidly developing by investigating structural elements, as well as the geo-chemical composition of bivalve shells, with the objective of obtaining information on environmental conditions archived during the lifetime of an organism (Schöne and Gillikin, 2013). Analysis of oxygen-isotope ratios (δ18
O) of mollusk shell carbonates has become a key tool for paleoclimate reconstruction as this data can be used to estimate the temperature of the ambient water at the time of shell formation, when δ18
Owateris known (Urey, 1947; Epstein et al., 1953; Grossman and Ku,
1986; Schöne and Surge, 2005; Gröcke and Gillikin, 2008; Oschmann, 2009; Wanamaker et al., 2011; Schöne and Gillikin, 2013; Butler and Schöne, 2017; Prendergast et al., 2017). Although the interpretation of δ13C data is often less straightforward because of species-specific me-tabolic effects (Chauvaud et al., 2011; Marchais et al., 2015), stable carbon-isotope ratio signatures of mollusk shells may provide data on salinity andδ13C
DICvalues in estuarine environments (Gillikin et al.,
2006; McConnaughey and Gillikin, 2008). These records can range from daily to sub-seasonal time-scales, depending on growth rate and longevity of the studied species, and can provide data for recent years and decades, as well as past centuries (e.g.Black et al., 2009; Butler
http://dx.doi.org/10.1016/j.chemgeo.2017.09.029
Received 5 June 2017; Received in revised form 18 September 2017; Accepted 19 September 2017
⁎Corresponding author.
E-mail address:melita@izor.hr(M. Peharda).
Chemical Geology 526 (2019) 23–35
Available online 22 September 2017
0009-2541/ © 2017 Elsevier B.V. All rights reserved.
et al., 2013; Schöne, 2013; Reynolds et al., 2016).
Despite having the analytical capabilities for isotope ratios and the tools for milling/drilling shells readily available, only a few studies have investigated the isotopic geochemistry of Mediterranean bivalve shells.Richardson et al. (2004),Bušelić et al. (2015)andPeharda et al. (2015)applied stable-isotope ratio analyses for the validation of peri-odicity of growth line formation in Adriatic Sea bivalves Pinna nobilis, Glycymeris bimaculata, and Lithophaga lithophaga, respectively.Purroy Albet (2017) used oxygen isotopes for the identification of the main growing season of Callista chione and Glycymeris bimaculata in the Adriatic. In a recent study,Crippa et al. (2016)performed stable isotope analysis of fossil shells of several bivalve species from the lower Pleis-tocene Arda river marine succession (northern Italy). To the best of our knowledge, the only studies on the potential of stable-isotope ratios in recent bivalve shells in the Mediterranean for paleoclimate re-construction are that ofMaier and Titschack (2010)on Spondylus gae-deropus andGarcía-March et al. (2011)on Pinna nobilis.
According to a number of studies, the Mediterranean Sea might be an especially vulnerable region to global climate change (e.g. Giorgi and Lionello, 2008; Adloff et al., 2015; Mariotti et al., 2015). These studies agree that Mediterranean region is expected to become sub-stantially drier and warmer during the twenty-first century, especially in the warm season. In the context of possible ecological and environ-mental changes, understanding drivers of growth in marine organisms is crucial to forecast the impact of climate change on marine biota, and marine bivalve shells present an excellent archive for this purpose. This study comparatively analyzes two bivalve species with different life strategies (as detailed below), the commercially important Mediterra-nean scallop Pecten jacobaeus (Peharda et al., 2003) and the long living bittersweet clam Glycymeris pilosa (> 50 years,Peharda et al., 2016).
Due to their fast growth rates and high commercial value associated withfishing, as well as aquaculture activities, scallops have been sub-ject of numerous studies. Shell oxygen-isotope ratios were successfully applied to determine the ontogenetic age of several Pectinidae species (e.g. Krantz et al., 1984; Dare and Deith, 1990; Lasta et al., 2001; Heilmayer et al., 2003; Chute et al., 2012). Besides ageing, the appli-cation of oxygen-isotope ratios for (paleo-) environmental reconstruc-tions has been evaluated (e.g. Hickson et al., 1999; Chauvaud et al., 2005; Thébault et al., 2007; Trevisol et al., 2012; Jolivet et al., 2015). Pecten jacobaeus is the largest scallop inhabiting the Mediterranean Sea and can attain a shell length of up to 140–160 mm (Marguš et al., 1992; Onofri and Marguš, 1995; Peharda et al., 2003). This species lives at depths ranging from 25 to 250 m, on sand, mud and gravel substrates (Poppe and Goto, 2000). Although it is present throughout the Medi-terranean coastal waters, it occurs in exploitable quantities only in the Northern Adriatic (Mattei and Pelizzato, 1996). Significant variation in
the biomass of P. jacobaeusfished in the North Adriatic occurred over the last four decades. During 1970 to 2000, the annual landing at the Chioggiafish market (Italy), the main port for scallop fishing in the Adriatic, varied between 105 and 1172 tons (mean ± standard de-viation = 551 ± 326 tons), with a subsequent significant decrease, with average annual landings of only 56 ± 19 tons (Mazzoldi et al., 2014; Clodia database, 2015). Although overfishing is probably the
main reason behind the decrease in landings, it is possible that en-vironmental factors, such as seawater temperature, salinity, oxygen saturation and food availability, might have also negatively affected growth as well as other biological processes in P. jacobaeus.
The second target species, G. pilosa, a longlived bivalve (maximum of about 70 years) that was recently proposed as a potential environ-mental archive to investigate the relationship between climate and biology in the Mediterranean (Peharda et al., 2016). Species of Glycy-meris were previously identified as targets for sclerochronological re-search and chronologies spanning several decades have been con-structed using G. glycymeris from the North-East Atlantic (Brocas et al., 2013; Reynolds et al., 2013; Royer et al., 2013). According toReynolds et al. (2013), maximum longevity of G. glycymeris is ~ 200 years,
whereasPeharda et al. (2016)estimated the maximum longevity of G. pilosa at ~ 70 years. Although it was previously thought that G. glycy-meris inhabits the Mediterranean and Adriatic Seas, a recent study by
Purroy et al. (2016)identified this species as G. pilosa raising the need
for a better understanding of the ecology and shell growth of this species. Because of distinct annual growth lines (Peharda et al., 2016), G. pilosa has a great potential for paleoclimate reconstructions, but there is the need for understanding the timing of growth line formation, as well as the rate of seasonal growth, in order to properly interpret chronologies in terms of environmental variations in the Mediterranean Sea.
The principal objectives of this study were to: i) identify the period of the year when the growth line is formed in the shell of two target species, P. jacobaeus (calcitic shell) and G. pilosa (aragonitic shell); ii) identify the main grow season of these two species; iii) identify the environmental drivers of shell growth; and iv) evaluate the potential applicability of δ18O values for the reconstruction of environmental variability.
2. Materials and methods 2.1. Environmental variables
Daily mean temperature and salinityfields inside the investigated area (offshore of West Istria) were modeled using the 3D numerical model ROMS with a spatial resolution of 2 km and 20 “s” level co-ordinates in the vertical (Janeković et al., 2014). In this study we used results only at the bottom for temperature and salinity parameters, computed previously within the Adriatic Sea ROMS modelling study. The model was integrated for 6 years starting from 2008 till the end of 2014 and was validated in many studies with available observations (e.g. CTD profiles and satellite SST inJaneković et al., 2010, 2014; Vilibić et al., 2016). During the period 2009–2014, the model used realistic atmospheric forcing, lateral boundary conditions, and fresh-water input from 41 rivers providing accurate estimates for all model state variables in the whole water column (from which we used only temperature and salinity subsets closest to the bottom). Separate models were computed for the different sample localities (Fig. 1), water depths and time periods for P. jacobaeus (25–30 m, 2009–2013) and G. pilosa (10 m, 2011–2014).
2.2. Sample collection
Pecten jacobaeus specimens were collected by the commercial beam trawl type“Rapido” along the western coast of the Istrian peninsula (North Adriatic) in December 2013 and January 2014 (Fig. 1). Sam-pling was conducted within latitudes 45°08′57.76″–45°23′07.55″N, and longitudes 13°17′04.99″–13°54′04.07″E at depths between 25 and 30 m and haul duration varied between 20 and 30 min. Specimens were transported to the laboratory, soft tissues carefully removed, and shells washed and stored dry at the Institute of Oceanography and Fisheries in Split.
Isotope-ratio analyses focused on three shells collected in December 2013 (PJ12-5, PJ12-8 and PJ12-16) and one shell collected in January 2014 (PJ1-3). Shell length (anterior-posterior axis) and height (dorso-ventral axis) of each scallop were measured with vernier calipers to the nearest 0.1 mm. Prior to laboratory analysis, left valves were gently brushed to remove most of the epibionts as well as sediment trapped between striae, and washed in a 10 vol% acetic acid bath for 30 s fol-lowed by rinsing in water (Thébault and Chauvaud, 2013).
Glycymeris pilosa samples were collected by SCUBA diver in March 2016 at 10–11 m depth from a coastal locality in the North Adriatic Sea (44°59′7.47″N, 13°44′19.22″E; WGS84). Upon collection specimens were frozen and transported to our laboratory where they were thawed, soft tissues carefully removed, and shells washed and air dried. Three shells of similar size were selected for analyses (S3P67, S3P91 and
S3P106). Prior to collection of samples for stable-isotope ratio analysis, the periostracum was physically removed with grinding paper. 2.3. Stable isotope analysis
Samples for the shell calcium carbonate oxygen (δ18O) and carbon (δ13C) isotope-ratio analysis were collected by milling narrow sample swaths from the shells by hand under a stereo microscope using a DREMEL Fortiflex drill equipped with a 300 μm tungsten carbide drill bit. Estimating milling depth was ~ 100μm. For P. jacobaeus, shallow milling was completed parallel to the growth striae, each sample ex-tending over 1–3 striae (Fig. 2). In total, 308 samples were collected: 61 from shell PJ12-5, 79 from shell PJ12-8, 68 from shell PJ12-16 and 100 from shell PJ1-3. Shells were photographed and distances between samples were measured using Image Pro Premier software. For G. pi-losa, shallow milling was done parallel to the growth lines covering two growth increments, as well as several samples before and after these two growth increments. Growth increments were chosen on the basis of their width in order to obtain a sufficient number of samples (> 9) per
growth increment. Mean distance between samples was
~ 193 ± 40μm. In total 93 samples were analyzed: 29 from shell S3P67, 35 from shell S3P91 and 29 from shell S3P106. During milling, detailed notes were taken on position of samples in relation to growth lines visible on the external shell surface.
Isotope-ratio analyses was performed at the University of Mainz, Germany, on a Thermo Finnigan MAT 253 continuousflow – isotope ratio mass spectrometer, equipped with a GasBench II. Samples were measured against an in-house Carrara marble (δ18O = + 2.01‰; δ13C =−1.91‰) calibrated against the international isotopic re-ference standard NBS-19. Results are expressed as parts per thousand with respect to the Vienna Pee Dee Belemnite standard (‰ V-PDB). Long-term (1.5 years) reproducibility (= accuracy, 1 sigma) of the mass spectrometer is 0.04‰ for δ18O and 0.03‰ for δ13C based on 421 blind measurements of NBS-19. The average 1 sigma internal precision error (eight injections per sample) is 0.04‰ for δ18O and 0.03‰ for δ13C.
To enable temporal alignment of obtained δ18O
shell values, daily modeled seawater salinity and temperature data were used for re-constructing theoretical variations ofδ18O
shell.Kim and O'Neil (1997) equation for calcite was applied to the P. jacobaeus dataset:
= −
− −
1000 ln αcalcite water 18.03(10 T )3 1 32.42 (1)
For the aragonite G. pilosa dataset theKim et al. (2007)equation of
was applied:
= −
− −
1000 ln αaragonite water 17.88(10 T )3 1 31.14 (2)
Becauseδ18O
w-SMOWof the water was not monitored over the life-span of the studied specimens, we reconstructed δ18Ow-SMOW values from modeled salinity data (S) using the equation derived fromStenni et al. (1995)data forδ18O
w-SMOWand salinity at transect B (blackfilled dots onFig. 1):
= − =
− ∗
δ O18 0. 366 S 12.568 (r 0.964)
W SMOW 2 (3)
To convert δ18O values from the V-PDB to V-SMOW (Vienna Standard Mean Ocean Water) scale, and vice versa, the equation of
Coplen et al. (1983) was used.δ13C
shellvalues for P. jacobaeus were detrended, as previously done for Pecten maximus byChauvaud et al. (2011). Presence of ontogenic trends inδ13Cshellvalues can mask the seasonal signal of this parameter and its detrending enables comparison withδ18O
shellvalues (Chauvaud et al., 2011). The least-squaresfit of a straight line was calculated separately for each analyzed individual. Subsequently, these values were subtracted from measured δ13C
shell data. The residual time-series is referred to asδ13C
shell det. Spearman correlation was applied for testing relationship betweenδ18Oshelland δ13C
shell.
Temporal aligning of measured δ18O
shell values was conducted manually in Excel by assigning each data point calendar date that placed that measured data point on graph closest to modeledδ18O
shell values. Final graphs were prepared in Sigma Plot 13.0 software. 3. Results
3.1. Environmental variables
For the area where P. jacobaeus specimens were collected, the modeled values for seawater bottom temperature (25–30 m) showed pronounced seasonal patterns, with minimum values (~ 10 °C or lower) occurring between January and April, and maximum values (~ 19 °C or higher) from July to October (Fig. 3). The overall lowest and highest monthly temperatures of 7.8 °C and 20.6 °C occurred in March 2012 and October 2009, respectively. Modeled monthly values of bottom salinity ranged from 37.0 (November 2013) to 38.4 (February 2013). Between 2009 and 2013, mean salinity ± one standard deviation was 37.9 ± 0.3. Most variable intra-annual values were noted during 2013, when the lowest values were also obtained through the ROMS
Fig. 1. Map of the study area indicating the location at which Pecten jacobaeus was collected by the commercialfishing beam trawl (dark grey) and the SCUBA diving locality at which Glycymeris pilosa was collected (black empty circle). The four blackfilled dots off Istria Peninsula represent the stations whereStenni et al. (1995)sampled water forδ18O
simulation for the second half of the year. Overall, the time interval between October and December was characterized by higher variations in bottom salinity.
At the shallow coastal locality (10–11 m depth) where G. pilosa was collected, modeled values for seawater bottom temperature ranged from 7.7 °C (February 2012) to 25.7 °C (August 2014). Annual minimum values (~ 13 °C or lower) occurred from January to April, while annual maximum values (~ 20 °C or higher) were characteristic for the months of June to September. Large sweater temperature var-iations sometimes occurred within days. Furthermore, pronounced variations in lowest modeled sweater temperatures between years are clearly evident, e.g., high winter seawater temperatures corresponding to the beginning of year 2014. Between the beginning of year 2011 and June 2014 salinity values ranged between 35.9 (September 2013) and 38.5 (April 2012), with an average of 37.7 ± 0.4 (1 SD). Modeled salinity showed considerable variability within and between years. With the exception of 2011, higher salinity was observed during the first half of the calendar year (January to June), whereas lower and more variable salinities were characteristic for the July to November
period.
Modeled temperatures for two studied areas clearly show that temperature maxima were lower in deeper water (for P. jacobaeus) and occurred later during the year (Fig. 3C). Winter temperature minima were very similar between two studied locations as the water column is well mixed during this season. Salinity was in general lower in shal-lower water and more variable on daily to weekly time scales. 3.2. Pecten jacobaeus shell geochemistry
Shell lengths of analyzed P. jacobaeus ranged from 98.3 mm (PJ12-16) to 116.5 mm (PJ12-8). Shells PJ1-3 and PJ12-5 had intermediate lengths of 113.0 and 116.0 mm, respectively. Theδ13Cshell calcitevalues of P. jacobaeus shells ranged from −1.64 to +0.40‰ (N = 308,
x =−0.52 ± 0.45‰, 1 SD), and showed an ontogenetic decline as shell height increased (Fig. 4). Theδ18Oshell calcitevalues ranged from + 0.01 to + 3.08‰ (N = 308, x = 1.40 ± 0.64‰,Fig. 5). Observed cyclicity in theδ18O
shell calcite values corresponded to the number of lightly colored growth rings observed on the external shell surface of P.
Fig. 2. A. Left valve of Pecten jacobaeus shell PJ 12-8 showing bright annual growth rings (black arrows) and milling swaths (within white rectangle) for isotope-ratio analyses. B. Close-up of milling swaths on the surface of P. jacobaeus. C. Glycymeris pilosa shell S3P106 showing dark growth rings (black arrows) and milling swaths (within white rectangle) for isotope analysis. D. Close-up of milling swaths on the surface of G. pilosa. Direction of shell growth (DOG) indicated with dashed arrows. Scale bars represent 1 cm in A and C, and 2 mm in B and D.
jacobaeus, thereby validating the annual periodicity of these bands. Stable isotope values corresponded to the time interval from 2009 to 2013. Detrending of δ13C
shell values enabled the analysis of seasonal variations and comparison of δ13Cshell det and δ18Oshell calcite values (Fig. 5). A certain degree of cyclicity was observed inδ13C
shell detwith higher values coinciding with the highestδ18O
shell calcitevalues (coldest part) of each year, whereas lower δ13Cshell detvalues coincided with lowerδ18O
shell calcitevalues (warmerest part of the year). There was a statistically significant, albeit weak, positive correlation between δ18
Oshell calcitevalues andδ13Cshell detvalues in shells PJ12-8 (Spearman r2= 0.40, p < 0.001), PJ12-16 (r2= 0.80, p < 0.001), and PJ1-3 (r2= 0.43, p < 0.001), but no such significant correlation occurred in shell PJ12-5 (r2= 0.16, p = 0.211).
Comparison ofδ18Oshell calcitevalues of the four studied P. jacobaeus shells andδ18O
shell calcitevalues reconstructed on the basis of the ROMS output and the local freshwater mixing line are shown inFig. 6. Major growth rings visible on the external shell surface of the left valve co-incided withδ18O
shell calciteminima. This suggests that cessation and/or slowdown of shell growth occurred during the warmest part of the year. In all shells, growth resumes in December, at the latest. In most years,
no or very little shell growth occurred during a period of almost 5 months, between July and November. Some shell growth variations were observed between years and specimens, and it appears that the shell growth slowdown periods were absent or shorter during early ontogeny (Fig. 6C). Besides seasonal shell growth cessation, there were time intervals of faster growth, as indicated by shell portions during which reconstructed temperatures barely changed. Shells appear to have grown faster during the periods December–January and April–-June. The lowestδ18O
shell calcitevalues were related to Summer 2009 (PJ1-3). Three of the studied shells showedδ18Oshell calcitemaxima of ~ 3‰ during early 2012, which is consistent with the lowest modeled temperature for this period.
3.3. Glycymeris pilosa shell geochemistry
Lengths of analyzed G. pilosa shells were 56.4 (S3P67), 58.9 (S3P91) and 58.6 mm (S3P106). In case of this species,δ13Cshell aragonitevalues for the three studied specimens ranged from + 0.80 to +1.97‰ (N = 93,x = + 1.33 ± 0.23‰), whereas the δ18O
shell aragonitevalues
ranged from −0.36 to +2.64‰ (N = 93, x =−1.04 ± 0.81‰)
Fig. 3. Modeled seawater temperature (A) and salinity (B) curves for the Pecten jacobaeus sam-pling area. Black lines indicate daily average values, grey areas ± 2 SD. Modeled temperature (C) and salinity curves (D) for the sampling sites of P. jacobaeus (black, sampling depth 25–30 m) and Glycymeris pilosa (dark grey, sampling depth 10–11 m).
(Fig. 7). Observedδ18O
shell aragonitevalues correspond to the number of increments on the external shell surface confirming that growth lines were formed annually and measured values correspond to the time interval of Spring 2011 to Winter 2013/2014. A statistically significant, albeit weak, positive correlation was found betweenδ13C
shell aragonite andδ18Oshell aragonitevalues for shells S3P67 (r2= 0.42, p = 0.022) and S3P106 (r2= 0.41, p = 0.002). There was no significant relationship between these two parameters in case of shell S3P91 (r2=−0.23, p = 0.188).
Temporally aligned δ18Oshell aragonite values reconstructed on the basis of the ROMS output and the local freshwater mixing line, as well asδ18O
shell aragonitevalues of the three studied G. pilosa shells, are shown in Fig. 8. Growth lines coincided with δ18Oshell aragonite minima or periods when values started to increase (~ September). According to these data, G. pilosa did not show a pronounced shell growth slowdown or cessation during the summer period. Highest reconstructedδ18Oshell aragonite values were 3.37‰ (February 20th 2012), which is 0.73‰ higher than the highest measuredδ18O
shell aragonitevalue (2.64‰, spe-cimen S3P67), indicating that shell growth slowed down or was halted during the coldest period of the year. Specimens S3P91 and S3P106 had even lower maximum δ18O
shell aragonite values, 2.33 and 2.50‰, re-spectively. Based on these values, shells did not grow between January and March, or even longer. Temporal distances between measured δ18O
shell aragonite values indicate fastest shell growth occurred during October–November period, i.e., after the growth line formation. Sea-sonal differences in growth slowdown/cessation between the two stu-died species are evident from the data presented inFig. 9. Whereas G. pilosa slowed shell growth during coldest part of the year, shell slow-down/cessation in P. jacobaeus occurred during warmest part of the year.
4. Discussion
4.1. Periodicity of growth line formation and environmental conditions Strong inter-annual variations in δ18O
shell values of both studied bivalve species, P. jacobaeus and G. pilosa, as well as reconstructed and modeled seawater temperature and salinity values were observed. Highest δ18O
shell calcite values recorded by P. jacobaeus shells, corre-sponding to lowest seawater temperatures, occurred during February 2012. This coincided with extreme cooling of seawater and dense water formation in the Adriatic Sea (Janeković et al., 2014). Unlike P. max-imus from the Atlantic which forms winter growth lines (Chauvaud et al., 1998, 2005, 2012; Owen et al., 2002), P. jacobaeus from the
North Adriatic seem to be able to deposit shell even at lowest winter seawater temperatures. It is interesting to note that seawater tem-peratures lower than 8 °C, as those that occurred during the extreme cold event in February 2012, are extremely rare. Despite variations between years and specimens, this study clearly indicate that a P. ja-cobaeus shell growth slowdown and/or cessation occurred during the warmest part of the year.
Unlike P. jacobaeus, this study clearly indicates that G. pilosa cannot be used to reconstruct seasonal seawater temperature minima. Highest reconstructedδ18Oshell aragonitevalues (corresponding to minimum sea-water temperatures) were significantly higher than δ18O
shell aragonite values obtained from the shell, indicating a slowdown/cessation of shell growth of G. pilosa from the North Adriatic during winter at seawater temperatures below ~ 12 °C. The same was found for a related species, Glycymeris bimaculata, from two localities in the eastern Adriatic– Pag Bay and Cetina river estuary (Purroy Albet, 2017). According to this study, G. bimaculata did not deposit new shell between January and April when seawater temperatures dropped below ~ 12 °C in Pag bay and below ~ 14 °C in Cetina river estuary.Walliser et al. (2015) eval-uated the potential of fossil bivalve Glycymeris planicostalis for high-resolution reconstructions of seawater temperatures during the Early Oligocene (30 Ma) and found that shells grew uninterruptedly and have therefore, in their opinion, recorded the entire seasonal seawater tem-perature range at that time. Certain caution is needed when applying these findings to other species and locations, since Early Oligocene sweater parameters are not readily available. However, seawater tem-perature values reconstructed from these fossils ranged from 12.3 to 22.0 °C, i.e., lowest winter temperature exceeded the shutdown tem-perature of modern glycymerids in the Adriatic Sea. Caution needs to be applied when using G. planicostalis as a seawater temperature archive in deep time, because shells may have stopped growing below the lower seawater temperature threshold of 12 °C observed in recent glycy-merids. A careful analysis of subannual shell growth patterns is advised prior to interpreting seawater temperature data of fossil bivalves. A growth slowdown below 12 °C has also been observed in G. glycymeris from Brittany, northwest France (Royer et al., 2013).
All studies cited in the paragraph above indicate the high potential of glycymerids for the reconstruction of summer seawater tempera-tures. In G. pilosa from the North Adriatic the annual growth line is formed in September, i.e. at the end of summer, but there was no pronounced slowdown in shell growth during the warm season of the year, because minimum δ18Oshell aragonite values obtained from the studied shells coincided well with the lowest reconstructed δ18O
shell aragonitevalues.
Fig. 4. Ontogenetic linear decrease inδ13C
shell calcitevalues versus shell height (distance from umbo) in Pecten jacobaeus A. specimens PJ 12-5 (dark grey) and PJ 12-8 (black), B.
Other factors besides seawater temperature can also influence shell growth rate and growth line formation. According to a recent experi-mental study on gaping activity of long lived bivalve Arctica islandica conducted in the Northern Norway, gaping activity was related to in-teraction of several environmental variables including Chlorophyll a,
temperature and photoperiod (Ballestra-Artero et al., 2017). In an earlier paper, Witbaard et al. (2003) demonstrated that A. islandica growth in the northern North Sea is mainly influenced by the abun-dance of copepods. According to this study, copepods intercept down-ward flux of food particles what might lead to depression of shell
Fig. 5. Relationship betweenδ18O
shell calcite(Y1axis, dark
grey) vs.δ13C
shell det(Y2axis, black) for the four studied
Pecten jacobaeus shells. A. PJ 12-5, B. PJ 12-8, C. PJ 12-16, D. PJ 1-3. Vertical bars identify annual growth lines ob-served on the outer shell surface.
Fig. 6. Temporally aligned modeledδ18O
shell calcitevalues
(black line = daily averages, grey areas ± 2 SD) and measuredδ18O
shell calcitevalues of Pecten jacobaeus shells
(inverted scale). Missing reconstructed data denote slow-down or cessation of shell growth (grey shading). Vertical grey lines indicate calendar years. A. PJ 12-5, B. PJ 12-8, C. PJ 12-16, D. PJ 1-3.
growth due to food shortage. An opposite relationship was reported by
Wanamaker et al. (2009) in the western Gulf of Maine, were a sig-nificant positive correlation was determined between shell growth of A. islandica and relative abundance of copepod Calanus finmarchicus, in-dicating complex and environmentally specific relationships.
It has been demonstrated for several bivalve species that survival, metabolism and shell growth are reduced when animals are exposed to concurrent low dissolved oxygen and low pH conditions (Gobler and Baumann, 2016).Gobler et al. (2014)analyzed the effects of hypoxia
and acidification on early life stages of bivalves and found that shell growth was significantly reduced when both conditions occurred si-multaneously. According to Djakovac et al. (2015), hypoxia events occurred frequently in the north Adriatic Sea between mid-summer and mid-fall. Low pH conditions occurred in the Gulf of Trieste (North Adriatic Sea) during August and September (Cantoni et al., 2012). Unfortunately, there is no sufficient data available to evaluate whether
hypoxia is an annual event of similar intensity between years, since data collection efforts in the area vary between years. Mid-fall period coincided with the annual growth line formation of both species, pos-sibly indicating that growth line is formed as a response to low DO and low pH. Recent expansion of low oxygen zones in coastal ecosystems, a trend that may accelerate with climate warming (Gobler et al., 2014), will likely have negative effects on bivalve growth.
4.2. Trends inδ13C
shellandδ18Oshellvalues An ontogenetic trend ofδ13C
shellto lower values has previously been observed for many bivalve species (for review seeMcConnaughey and Gillikin, 2008). Examples of some recent studies include the great scallop, P. maximus from the Atlantic (Chauvaud et al., 2011), the thorny oyster, Spondylus gaederopus from the Mediterranean (Maier and Titschack, 2010) and the date shell, Lithophaga lithophaga from the
Fig. 7. Relationship betweenδ18O
shell aragonite(Y1axis, grey) vs.
δ13C
shell aragonite(Y2axis, black) for three studied Glycymeris
pi-losa shells. A. S3P67, B. S3P91, C. S3P106. Vertical bars identify annual growth lines observed on the outer shell surface.
coastal middle Adriatic (Peharda et al., 2015). Observed decrease in δ13C
shellvalues with age might also be related to marine Suess effect, as was previously observed for Arctica islandica (Schöne et al., 2011). Presence of strong ontogenetic trends can mask the seasonal signal, and therefore,Chauvaud et al. (2011)suggested detrendingδ13C
shellvalues of species that show age-related trends in order to enable an analysis of seasonal variations.
P. maximus from the Bay of Brest had lowest values ofδ13C shell detin late spring/early summer, most likely reflecting corresponding varia-tions in food availability (Chauvaud et al., 2011). In our study, in P. jacobaeus, low δ13C
shell detvalues coincided with δ18Oshellvalues cor-responding to spring. In case of G. pilosa,δ13C
shellvalues varied among specimens and between years, but in general lowestδ13Cshell detvalues occurred in the summer. Similarfindings were reported for the thorny oyster, S. gaederopus from the Mediterranean Sea with lowestδ13C
shell values attained in May/June, whereas phytoplankton blooms regularly occurred in January/February (Maier and Titschack, 2010). Highest stable carbon isotope values in young Arctica islandica occurred during summer, i.e., during maximum primary productivity (Schöne et al., 2005). Due to observed inter-specimen variations inδ13Cshell values, fu-ture studies should analyze this parameter before it can be fully eval-uated and applied for the reconstruction of environmental variability.
Changing relationships between δ13Cshell and δ18Oshell in coeval specimens from the same habitat have been noticed in previous studies and were interpreted at reflecting variable biological controls on the incorporation of carbon isotopes into the shell (Lorrain et al., 2004). In this study, such variations were observed for both studied bivalves, P.
jacobaeus and G. pilosa. A statistically significant positive correlation between these two variables was observed in three out of four studied P. jacobaeus shells, and in two out of three studied G. pilosa specimens. Overall,δ13Cshell values for G. pilosa were significantly higher (x = + 1.33‰) than those for P. jacobaeus (x =−0.52‰; Mann Whiney test z =−14.62, p < 0.0001). It is interesting to note that δ13C
shell det values of P. jacobaeus in the present study (−1.64 to 0.40‰) are lower than those measured byChauvaud et al. (2011)in the closely related species P. maximus (−0.94 to 1.89‰). Stable carbon isotope-ratio va-lues of G. pilosa (0.80 to 1.97‰), however, were almost identical to those previously determined in G. bimaculata from the Pag bay, middle Adriatic Sea (0.81 to 2.03‰,Bušelić et al., 2015). Lowerδ13C
shell va-lues in G. bimaculata were recently obtained for shells collected from Pag bay and Cetina river estuary (−0.52 to 1.77‰; Purroy Albet, 2017), indicating differences possibly related to site and year. Future studies should analyze carbon isotope-ratio values from same species across different sampling sites characterized by different environmental conditions, as well as from different species collected at the same size in order to gain a better understanding ofδ13Cshell potential as an en-vironmental proxy. Such studies should include detailed analysis of environmental variables.
4.3. Chemical sclerochronology and bivalve ecology
In order to fully understand these marine bivalve mollusk archives, future studies should address the ecology of the studied species in-cluding reproduction, feeding ecology and growth rate of soft tissues.
Fig. 8. Temporally aligned modeledδ18O
shell aragonitevalues
and measuredδ18O
shell aragonitevalues of Glycymeris pilosa
shells (inverted scale). Absence of reconstructed data in-dicates slowdown or stop of shell growth. Vertical black lines indicate calendar years, red data points indicate po-sition of growth lines, grey areas indicate periods of shell growth slowdown. A. S3P67, B. S3P91, C. S3P106.
As yet, only reproduction data were published for a P. jacobaeus po-pulation from the Krka River estuary, middle Adriatic (Marguš et al.,
1993). According to this study, the highest gonad index was attained in February followed by a strong decrease in April and May. Low gonad indices were observed during summer and minimum values in Sep-tember. According to the recent work of Ezgeta-Balić (unpublished data), full gonads were developed in P. jacobaeus from the North Adriatic during January to April, and a decrease in gonad mass was observed in early May. In this study, shell growth was fastest between April and June indicating that P. jacobaeus redirected its energy re-sources to growth as soon as spawning was over. The main shell growth slowdown overlapped with the low gonad index, possibly indicating unfavorable environmental conditions. To date, there is no study on feeding ecology of this species. According to Chauvaud et al. (2011), seasonal and ontogenetic variations ofδ13Cshellin P. maximus shells can be considered as a possible tool for ecophysiological studies, and the same potential for P. jacobaeus shells should be explored in futurefield and laboratory studies.
The reproductive cycle of Glycymeris pilosa was recently analyzed by
Purroy Albet (2017)on specimens collected from the Pašman channel, middle Adriatic Sea. From October to December most gonads were in-active. Gametogenesis started in December and early and late active stages extended into June when ~ 20%of the population had ripe go-nads, while others had gonads that were in late stage of development. Spawning took place between July and October. There is no other study on the reproductive cycle of this species. Periods of inactive gonads found by Purroy Albet (2017) coincided with times of faster shell growth in the North Adriatic G. pilosa population. Furthermore, the winter shell growth slowdown coincided with the early and late de-velopment of gonads, indicating that during this period of the year G. pilosa was redirecting its energy resources to reproduction.
The only available data on G. pilosa feeding ecology are those for populations from Pag bay and Pašman channel, Middle Adriatic Sea (Purroy Albet, 2017). According to this study, significant differences in
δ13
Cdigestive gland(‰), δ15Ndigestive gland(‰) and the C:N molar ratio occurred between sites, with significantly higher values at Pašman.
Since these two sites are geographically positioned relatively closely (~ 50 km), isotopic variations clearly indicate that results cannot be used to interpret the feeding ecology of populations at other sites. Therefore, future studies should analyze variations in feeding ecology of G. pilosa along latitudinal, longitudinal and environmental gradients in order to identify possible relationships between food supply and growth.
5. Conclusions
Seasonal shell formation rates vary between bivalve species. Growth slowdown of the Mediterranean scallop P. jacobaeus from the North Adriatic Sea occurred during summer, whereas the bittersweet clam G. pilosa from the same area grew at slowest rates, or not at all, during winter. Both species formed distinct annual growth lines in September to November period, indicating that other factors, besides seawater temperature, are important drivers of shell growth. Possible drivers include low dissolved oxygen concentration and low pH conditions that co-occur in the North Adriatic during late summer/early fall (Cantoni et al., 2012; Djakovac et al., 2015). It is hypothesized here that climate change-induced variations of these parameters could negatively influ-ence shell growth, especially in the case of P. jacobaeus.
In relation to further sclerochronological research, G. pilosa is an important target species for studies looking at variations in annual growth increments in the Adriatic and Mediterranean Seas (Peharda et al., 2016). Since G. pilosa forms annual growth lines in September, the annual shell growth increment covers certain periods of two ca-lendar years. This needs to be taken into account when shell chron-ologies are constructed and annual shell increment width data are compared to environmental data. Furthermore, due to its longevity and continuous growth during the warmest part of the year, G. pilosa is an interesting archive for the reconstruction of seawater temperatures during summer.
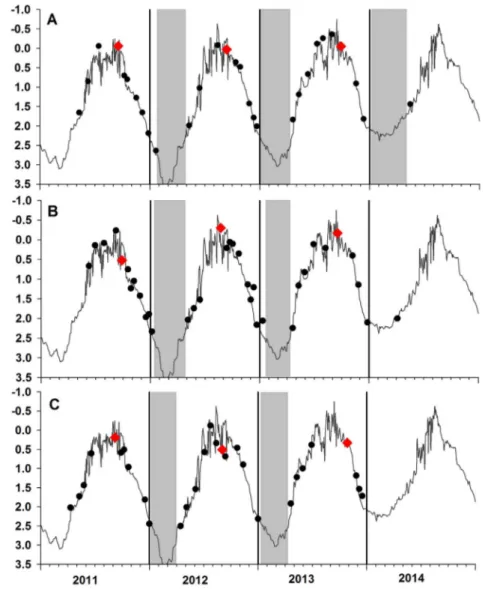
Fig. 9. Comparison between modeledδ18O
shellvalues (line)
and temporally alignedδ18O
shellvalues (symbols). A. Pecten
jacobaeus, B. Glycymeris pilosa. Different individuals shown in different symbols. Grey areas indicate periods of shell growth slowdown or cessation.
Acknowledgements
Authors are grateful to Daria Ezgeta Balic and DraganŠvigir for help with collection of samples. Research has been supported by Croatian Science Foundation under the project SCOOL (IP-2014-09-5747). We would like to thank two anonymous reviewers and guest editor Al Wanamaker for their comments that greatly improved our manuscript. Funding
Research has been supported by Croatian Science Foundation under the project SCOOL (IP-2014-09-5747).
Appendix A. Supplementary data
Supplementary data to this article can be found online athttps:// doi.org/10.1016/j.chemgeo.2017.09.029.
References
Adloff, F., Somot, S., Sevault, F., Jordà, G., Aznar, R., Déqué, M., Herrmann, M., Marcos, M., Dubois, C., Padorno, E., Alvarez-Fanjul, E., Gomis, D., 2015. Mediterranean Sea response to climate change in an ensamble of twentyfirst century scenarios. Clim. Dyn. 45, 2775–2802.
Ballestra-Artero, I., Witbaard, R., Carroll, M.L., van der Meer, J., 2017. Environmental factors regulating gaping activity of the bivalve Arctica islandica in Northern Norway. Mar. Biol. 164, 16.http://dx.doi.org/10.1007/s00227-017-3144-7.
Black, B.A., Copenheaver, C.A., Frank, D.C., Stuckey, M.J., Kormanyos, R.E., 2009. Multi-proxy reconstructions of the northeastern Pacific sea surface temperature data from trees and Pacific geoduck. Palaeogeogr. Palaeoclimatol. Palaeoecol. 278, 40–47.
Brocas, W.M., Reynolds, D.J., Butler, P.G., Richardson, C.A., Scourse, J.D., Ridgway, I.D., Ramsay, K., 2013. The dog cockle, Glycymeris glycymeris (L.), a new annually-resolved sclerochronological archive for the Irish Sea. Palaeogeogr. Palaeoclimatol. Palaeoecol. 373, 133–140.
Bušelić, I., Peharda, M., Reynolds, D.J., Butler, P.G., Román González, A., Ezgeta-Balić, D., Vilibić, I., Grbec, B., Hollyman, P., Richardson, C.A., 2015. Glycymeris bimaculata (Poli, 1795)– a new sclerochronological archive for the Mediterranean? J. Sea Res. 95, 139–148.
Butler, P.G., Schöne, B.R., 2017. New research in the methods and applications of sclerochronology. Palaeogeogr. Palaeoclimatol. Palaeoecol. 465 (Part B), 295–299.
Butler, P.G., Wanamaker Jr., A.D., Scourse, J.D., Richardson, C.A., Reynolds, D.J., 2013. Variability in marine climate on the North Icelandic Shelf in a 1357-year proxy ar-chive based on growth increments in the bivalve Arctica islandica. Palaeogeogr. Palaeoclimatol. Palaeoecol. 373, 141–151.
Cantoni, C., Luchetta, A., Celio, M., Cozzi, S., Raicich, F., Catalano, G., 2012. Carbonate system variability in the Gulf of Trieste (North Adriatic Sea). Estuar. Coast. Shelf Sci. 115, 51–62.
Chauvaud, L., Thouzeau, G., Paulet, Y.-M., 1998. Effects of environmental factors on the daily growth rate of Pecten maximus juveniles in the Bay of Brest (France). J. Exp. Mar. Biol. Ecol. 227, 83–111.
Chauvaud, L., Lorrain, A., Dunbar, R.B., Paulet, Y.-M., Thouzeau, G., Jean, F., Guarini, J.-M., Mucciarone, D., 2005. Shell of the Great scallop Pecten maximus as a high-fre-quency archive of paleoenvironmental changes. Geochem. Geophys. Geosyst. 6 (8), Q08001.
Chauvaud, L., Thébault, J., Clavier, J., Lorrain, A., Strand, Ø., 2011. What's hiding behind ontogeneticδ13C variations in mollusk shells? New insights from the Great Scallop
(Pecten maximus). Estuar. Coasts 34, 211–220.
Chauvaud, L., Patry, Y., Jolivet, A., Cam, E., Le Goff, C., Strand, Ø., Charrier, G., Thébault, J., Lazure, P., Gotthard, K., Clavier, J., 2012. Variation in size and growth of the Great Scallop Pecten maximus along a latitudinal gradient. PLoS ONE 7 (5), e37717.
Chute, A.S., Wainright, S.C., Hard, D.R., 2012. Timing of shell ring formation and patterns of shell growh in the sea scallop Placopecten magellanicus based on stable oxygen isotopes. J. Shellfish Res. 31, 649–662.
Clodia database, 2015. Database of Fishery Data from Chioggia, Northern Adriatic Sea.
http://chioggia.scienze.unipd.it/Database_landing.html.
Coplen, T.B., Kendall, C., Hopple, J., 1983. Comparison of stable isotope reference samples. Nature 302, 236–238.
Crippa, G., Angiolini, L., Bottini, C., Erba, E., Fellatti, F., Frigerio, C., Hennissen, J.A.I., Leng, M.J., Petrizzo, M.R., Raffi, I., Raineri, G., Stephenson, M.H., 2016. Seasonality fluctuations recoreded in fosiil bivalves during the early Pleistocene: Implications for climate change. Palaeogeogr. Palaeoclimatol. Palaeoecol. 446, 234–251.
Dare, P.J., Deith, M.R., 1990. Age determination of scallops, Pecten maximus (Linnaeus, 1758), using stable oxygen isotope analysis, with some implications forfisheries management in British waters. In: Shumway, S.E., Sandifer, P.A. (Eds.), An International Compendium of Scallop Biology and Culture. World Aquacult. Soc, Baton Rouge, pp. 118–133.
Djakovac, T., Supić, N., Bernardi, A.F., Degobbis, D., Giani, M., 2015. Mechanisms of hypoxia frequency changes in the northern Adriatic Sea during the period 1972–2012. J. Mar. Syst. 141, 179–189.
Epstein, S., Buchsbaum, R., Lowenstam, H.A., Urey, H.C., 1953. Revised carbonate-water
isotopic temperature scale. Bull. Geol. Soc. Am. 64 (11), 1315–1326.
García-March, J.R., Surge, D., Lees, J.M., Kersting, D.K., 2011. Ecological information and water mass properties in the Mediterranean recorded by stable isotope ratios in Pinna nobilis shells. J. Geophys. Res. 116, G02009.
Gillikin, D.P., Lorrain, A., Bouillon, S., Willenz, P., Dehairs, F., 2006. Stable carbon iso-topic composition of Mytilus edulis shells: relation to metabolism, salinity,δ13C
DICand
phytoplankton. Org. Geochem. 37, 1371–1382.
Giorgi, F., Lionello, P., 2008. Climate change projections for the Mediterranean region. Glob. Planet. Chang. 63, 90–104.
Gobler, C.J., Baumann, H., 2016. Hypoxia and acidification in ocean ecosystems: coupled dynamics and effects on marine life. Biol. Lett. 12, 20150976.
Gobler, C.J., DePasquale, E.L., Griffith, A.W., Baumann, H., 2014. Hypoxia and acid-ification have additive and synergistic negative effects on the growth, survival and metamorphosis of early life stage bivalves. PLoS ONE 9 (1), e83648.
Gröcke, D.R., Gillikin, D.P., 2008. Advances in mollusc sclerochronology and scler-ochemistry: tools for understanding climate and environment. Geo-Mar. Lett. 28, 265–268.
Grossman, E.L., Ku, T.-L., 1986. Oxygen and carbon isotope fractionation in biogenic aragonite: temperature effects. Chem. Geol. 59, 59–74.
Heilmayer, O., Brey, T., Chiantore, M., Cattaneo-Vietti, R., Arntz, W.E., 2003. Age and productivity of the Antarctic scallop (Adamussium colbecki) in the Ross Sea. J. Exp. Mar. Biol. Ecol. 288, 239–256.
Hickson, J.A., Johnson, A.L.A., Heaton, T.H.E., Balson, P.S., 1999. The shell of the queen scallop Aequipecten opercularis (L.) as a promising tool for palaeoenvironmental re-construction: evidence and reasons for equilibrium stable-isotope incorporation. Palaeogeogr. Palaeoclimatol. Palaeoecol. 154, 325–337.
Janeković, I., Dutour Sikirić, M., Tomažić, I., Kuzmić, M., 2010. Hindcasting the Adriatic Sea surface temperature and salinity: A recent modeling experience. Geofizika 27, 85–100.
Janeković, I., Mihanović, H., Vilibić, I., Tudor, M., 2014. Extreme cooling and dense water formation estimates in open and coastal regions of the Adriatic Sea during the winter of 2012. J. Geophys. Res. Oceans 119, 3200–3218.
Jolivet, A., Asplin, L., Strand, Ø., Thébault, J., Chauvaud, L., 2015. Costal upwelling in Norway recvorded in Great Scallop shells. Limnol. Oceanogr. 60, 1265–1275.
Kim, S.-T., O'Neil, J.R., 1997. Equilibrium and nonequilibrium oxygen isotope effects in synthetic carbonates. Geochim. Cosmochim. Acta 61, 3461–3475.
Kim, S.-T., O'Neil, J.R., Hillaire-Marcel, C., Mucci, A., 2007. Oxygen isotope fractionation between synthetic aragonite and water: Influence of temperature and Mg2 +
con-centration. Geochim. Cosmochim. Acta 71, 4704–4715.
Krantz, D.E., Jones, D.S., Williams, D.F., 1984. Growth rates of the sea scallop, Placopecten magellanicus, determined from the18O/16O record in shell calcite. Biol. Bull. 167,
186–199.
Lasta, M., Valero, J., Brey, T., Bremec, C., 2001. Zygochlamys patagonica (King and Broderip) beds on the Argentinian shelf. Part II: Population dynamics of Z. patagonica. Arch. Fish. Mar. Res. 49, 125–137.
Lorrain, A., Paulet, Y.-M., Chauvaud, L., Dunbar, R., Mucciarone, D., Fontugne, M., 2004. δ13C variation in scallop shells: Increasing metabolic carbon contribution with body
size? Geochim. Cosmochim. Acta 68, 3509–3519.
Maier, E., Titschack, J., 2010. Spondylus gaederopus: a new Mediterranean climate archive – based on high-resolution oxygen and carbon isotope analysis. Palaeogeogr. Palaeoclimatol. Palaeoecol. 291, 228–238.
Marchais, V., Richard, J., Jolivet, A., Flye-Sainte-Marie, J., Thébault, J., Jean, F., Richard, P., Paulet, Y.-M., Clavier, J., Chauvaud, L., 2015. Coupling experimental and field-based approaches to decipher carbon sources in the shell of the great scallop, Pecten maximus (L.). Geochim. Cosmochim. Acta 168, 58–69.
Marguš, D., Teskeredžić, E., Modrušan, Z., Hacmanjek, M., 1992. Rasprostranjenost, gustoća i starosna struktura populacija jakovske kapice (Pecten jacobaeus L.) i male kapice (Chlamys varia L.) u ušću rijeke Krke. Pomorski zbornik. 30. pp. 599–618.
Marguš, D., Teskeredžić, E., Teskeredžić, Z., Tomec, M., 1993. Reproductive cycle and monitoring of scallop larvae (Pecten jacobaeus L.) in plankton from the mouth of the River Krka. Ribarstvo 48, 43–54.
Mariotti, A., Pan, Y., Zeng, N., Alessandri, A., 2015. Long-term climate change in the Mediterranean region in the midst of decadal variability. Clim. Dyn. 44, 1437–1456.
Mattei, N., Pelizzato, M., 1996. A population study on three stocks of a commercial Adriatic pectinid (Pecten jacobaeus). Fish. Res. 26, 49–65.
Mazzoldi, C., Sambo, A., Riginellia, E., 2014. The Clodia database: a long time series of fishery data from the Adriatic Sea. Sci. Data 1, 140018.
McConnaughey, T.A., Gillikin, D.P., 2008. Carbon isotopes in mollusk shell carbonates. Geo-Mar. Lett. 28, 287–299.
Onofri, V., Marguš, D., 1995. Biologija jakovske kapice (Pecten jacobaeus L.) i mogućnost njezinog uzgoja u području otoka Mljeta. In: Durbešić, P., Benović, A. (Eds.), Priopćenje sa simpozija “Prirodne značajke i društvena valorizacija otoka Mljeta”. Ekološke monografije 6, Zagrebpp. 555–562 (in Croatian).
Oschmann, W., 2009. Sclerochronology: editorial. Int. J. Earth Sci. 98, 1–2.
Owen, R., Richardson, C.A., Kennedy, H., 2002. The influence of shell growth rate on striae deposition in the scallop Pecten maximus. J. Mar. Biol. Assoc. U. K. 82, 621–623.
Peharda, M., Soldo, A., Pallaoro, A., Matić, S., Cetinić, P., 2003. Age and growth of the Mediterranean scallop Pecten jacobaeus (Linnaeus 1758) in the northern Adriatic Sea. J. Shellfish Res. 22, 639–642.
Peharda, M., Puljas, S., Chauvaud, L., Schöne, B.R., Ezgeta-Balić, D., Thébault, J., 2015. Growth and longevity of Lithophaga lithophaga: what can we learn from shell structure and stable isotope composition? Mar. Biol. 162, 1531–1540.
Peharda, M., Black, B.A., Purroy, A., Mihanović, H., 2016. The bivalve Glycymeris pilosa as a multidecadal environmental archive for the Adriatic and Mediterranean Seas. Mar. Environ. Res. 119, 79–87.
Cephalopoda. ConchBooks, Hackenheim.
Prendergast, A.L., Versteegh, E.A.A., Schöne, B.R., 2017. New research on the develop-ment of high-resolution palaoenvirondevelop-mental proxies from geochemical properties of biogenic carbonates. Palaeogeogr. Palaeoclimatol. Palaeoecol. 484, 1–6.
Purroy Albet, A., 2017. The Biological and Ecological Drivers of Shell Growth in Bivalves. Universty of Split, Croatia (PhD thesis, 201 pp.).
Purroy, A.,Šegvić-Bubić, T., Holmes, A., Bušelić, I., Thébault, J., Featherstone, A., Peharda, M., 2016. Combined use of morphological and molecular tools to resolve species mis-identification in the Bivalvia – the case of Glycymeris glycymeris and G. pilosa. PLoS ONE 11 (9), e0162059.
Reynolds, D.J., Butler, P.G., Williams, S.M., Scourse, J.D., Richardson, C.A., Wanamaker Jr., A.D., Austin, W.E.N., Cage, A.G., Sayer, M.D.J., 2013. A multiproxy reconstruc-tion of Hebridean (NW Scotland) spring sea surface temperatures between AD 1805 and 2010. Palaeogeogr. Palaeoclimatol. Palaeoecol. 386, 275–285.
Reynolds, D.J., Scourse, J.D., Halloran, P.R., Nederbragt, A.J., Wanamaker, A.D., Butler, P.G., Richardson, C.A., Heinemeier, J., Eiríksson, J., Knudsen, K.L., Hall, I.R., 2016. Annually resolved North Atlantic marine climate over the last millennium. Nat. Commun. 7, 13502.
Richardson, C.A., Peharda, M., Kennedy, H., Kennedy, P., Onofri, V., 2004. Age, growth rate and season of recruitment of Pinna nobilis (L) in the Croatian Adriatic determined from Mg:Ca and Sr:Ca shell profiles. J. Exp. Mar. Biol. Ecol. 299, 1–16.
Royer, C., Thébault, J., Chauvaud, L., Olivier, F., 2013. Structural analysis and pa-leoenvironmental potential of dog cockle shells (Glycymeris glycymeris) in Brittany, northwest France. Palaeogeogr. Palaeoclimatol. Palaeoecol. 373, 123–132.
Schöne, B.R., 2013. Arctica islandica (Bivalvia): a unique paleoenvironmental archive of the northern North Atlantic Ocean. Glob. Planet. Chang. 111, 199–225.
Schöne, B.R., Gillikin, D.P., 2013. Unraveling environmental histories from skeletal dia-ries– Advances in sclerochronology. Palaeogeogr. Palaeoclimatol. Palaeoecol. 373, 1–5.
Schöne, B.R., Surge, D. (Eds.), 2005. Looking back over skeletal diaries— high-resolution environmental reconstructions from accretionary hard parts of aquatic organisms. Palaeogeogr. Palaeoclimatol. Palaeoecol. 228, 1–3.
Schöne, B.R., Fiebig, J., Pfeiffer, M., Gleß, R., Hickson, J., Johnson, A.L.A., Dreyer, W., Oschmann, W., 2005. Climate records from a bivalve Methusalah (Arctica islandica, Mollusca; Iceland). Palaeogeogr. Palaeoclimatol. Palaeoecol. 228, 130–148.
Schöne, B.R., Wanamaker Jr., A.D., Fiebig, J., Thébault, J., Kreutz, K., 2011. Annually resolvedδ13C
shelland chronologies of long-lived bivalve mollusks (Arctica islandica)
reveal oceanic carbon dynamics in the temperate North Atlantic during recent cen-turies. Palaeogeogr. Palaeoclimatol. Palaeoecol. 302, 31–42.
Stenni, B., Nichetto, P., Bregant, D., Scarazzato, P., Longinelli, A., 1995. Theδ18O signal
of the northwardflow of Mediterranean waters in the Adriatic Sea. Oceanol. Acta 18, 319–328.
Thébault, J., Chauvaud, L., 2013. Li/Ca enrichment in great scallop shells (Pecten max-imus) and their relationship with phytoplankton blooms. Palaeogeogr.
Palaeoclimatol. Palaeoecol. 373, 108–122.
Thébault, J., Chauvaud, L., Clavier, J., Guarini, J., Dunbar, R.B., Fichez, R., Mucciarone, D.A., Morize, E., 2007. Reconstruction of seasonal temperature variability in the tropical Pacific Ocean from the shell of the scallop, Comptopallium radula. Geochim. Cosmochim. Acta 71, 918–928.
Trevisol, A., Bergamasco, A., Montagna, P., Sprovieri, M., Taviani, M., 2012. Antartic seawater temperature evaluation based on stable isotope measurements on Adamussium colbecki shells: kinetic effects vs. isotopic equilibrium. J. Mar. Syst. 126 (SI), 43–55.
Urey, H.C., 1947. The thermodynamic properties of isotopic substances. J. Chem. Soc. P562.
Vilibić, I., Mihanović, H., Janeković, I., Šepić, J., 2016. Modelling the formation of dense water in the northern Adriatic: sensitivity studies. Ocean Model 101, 17–29.
Walliser, E.O., Schöne, B.R., Tütken, T., Zirkel, J., Grimm, K.I.I., Pross, J., 2015. The bivalve Glycymeris planicostalis as a high-resolution paleoclimate archive for the Rupelian (Early Oligocene) of central Europe. Clim. Past 11, 653–668.
Wanamaker, A.D., Kreutz, K.J., Schone, B.R., Maasch, K.A., Pershing, A.J., Borns, H.W., Introne, D., Feindel, S., 2009. A late Holocene paleo-productivity record in the western Gulf of Maine, USA, inferred from growth histories of the long-lived ocean quahog (Arctica islandica). Int. J. Earth Sci. 98, 19–29.
Wanamaker Jr., A.D., Hetzinger, S., Halfar, J., 2011. Reconstructing mid- to high-latitude marine climate and ocean variability using bivalves, coralline algae, and marine se-diment cores from the Northern Hemisphere. Palaeogeogr. Palaeoclimatol. Palaeoecol. 302, 1–9.
Witbaard, R., Jansma, E., Sass Klaassen, U., 2003. Copepods link quahog growth to cli-mate. J. Sea Res. 50, 77–83.