HAL Id: lirmm-02087761
https://hal-lirmm.ccsd.cnrs.fr/lirmm-02087761
Submitted on 2 Apr 2019
HAL is a multi-disciplinary open access
archive for the deposit and dissemination of
sci-entific research documents, whether they are
pub-lished or not. The documents may come from
teaching and research institutions in France or
abroad, or from public or private research centers.
L’archive ouverte pluridisciplinaire HAL, est
destinée au dépôt et à la diffusion de documents
scientifiques de niveau recherche, publiés ou non,
émanant des établissements d’enseignement et de
recherche français ou étrangers, des laboratoires
publics ou privés.
Urban object classification with 3D Deep-Learning
Younes Zegaoui, Marc Chaumont, Gérard Subsol, Philippe Borianne,
Mustapha Derras
To cite this version:
Younes Zegaoui, Marc Chaumont, Gérard Subsol, Philippe Borianne, Mustapha Derras. Urban object
classification with 3D Deep-Learning. JURSE: Joint Urban Remote Sensing Event, May 2019, Vannes,
France. �lirmm-02087761�
Urban object classification with 3D Deep-Learning
Younes Zegaoui
LIRMM, Univ. Montpellier, CNRS Berger-Levrault
Montpellier, France [email protected]
Marc Chaumont
LIRMM, Univ. Montpellier, CNRS Univ. Nˆımes
Montpellier, France [email protected]
G´erard Subsol
LIRMM, Univ. Montpellier, CNRS Montpellier, France [email protected]
Philippe Borianne
AMAP, Univ. Montpellier, CIRAD, CNRS, INRA, IRD Montpellier, France [email protected]
Mustapha Derras
Berger-Levrault Toulouse, France [email protected]Abstract—Automatic urban object detection remains a chal-lenge for city management. Existing approaches in remote sensing include the use of aerial images or LiDAR to map a scene. This is, for example, the case for patch-based detection methods. However, these methods do not fully exploit the 3D information given by a LiDAR acquisition because they are similar to depth map. 3D Deep-Learning methods are promising to tackle the issue of the urban objects detection inside a LiDAR cloud. In this paper, we present the results of several experiments on urban object classification with the PointNet network trained with public data and tested on our data-set. We show that such a methodology delivers encouraging results, and also identify the limits and the possible improvements.
Index Terms—LiDAR, deep-learning, 3D points cloud, urban objects, remote sensing, classification,
I. PRESENTATION OF THE CONTEXT
Pattern recognition has entered an era of complete renewal with the development of deep-learning [1] in the academic community as well as in the industrial world, due to the significant breakthrough these algorithms have achieved in 2D image processing during the last five years. Currently, most of deep learning researches still come from 2D imagery with challenges such as ILSVRC [2]. This sudden boost of performance led to robust and real-time new object detection algorithms like Faster R-CNN [3]. However, generalising them to 3D data is not a simple task. This is especially true in the case of 3D point cloud where the information is not structured as in meshes. The LiDAR sensors, which are now usually mounted on mobile devices such as cars, can be used to perform dynamic acquisition of an entire scene such as a city or an agglomeration [4]. Such an acquisition gives more 3D spatial context and precision about the depth than a video camera acquisition. From a LiDAR point cloud it would be possible to detect the objects in the 3D scene to help to manage an agglomeration. For example, knowing precisely how many trees or poles there are, and where they are located would greatly help updating urban objects databases, finding them and monitoring their status. It is especially interesting to track objects which are undergoing constant changes, and the most notable example are living objects
like trees. Mobile LiDAR devices are equipped with GNSS (Global Navigation Satellite System) transmitters that Geo-reference the data during the acquisition. Thus any urban objects extracted from the point cloud can be projected to an existing GIS (Geographic Information System). Nevertheless for deep-learning localisation algorithms to work, we first need to make sure that their classification counterpart delivers acceptable results for the urban managers. In this paper, we propose to evaluate a modern 3D deep neural network on the task of urban object points cloud classification. After a brief state of the art of 3D Deep-Learning in section 2, we present our classification methodology in section 3. In section 4 we give the experimental results and evaluate how the neural network recognizes cloud of 3D points as an object.
II. DEEPLEARNING ON3DPOINT SETS
As previously stated, there is no simple way to generalise 2D images classification methods to a 3D scene since 3D points cloud are an unorganised data-set structure contrary to an image structuring where the pixels are ordered. Fur-thermore, there is no correlation between the order in which the points are ordered in the cloud, which is merely a list of vertexes (X, Y, Z) and additional information such as the RGB colour. The points cloud stay the same regardless of any re-ordering applied to the list. In an unstructured 3D cloud, there is no relationship between consecutive elements, whereas in a 2D image, the storing structure is a matrix, and there is a correlation in a 2D neighbourhood. To bypass those issues, the first 3D classification algorithms used an intermediate data structure to represent the point clouds.
We can then divide the existing methods into three subcat-egories based on the used intermediate data structure:
• Voxel-based methods were the first deep-learning meth-ods to deliver significant results. They use voxelization algorithms to transform the points set into voxel images which can be described as a stack of 2D images like the ones used in medical imagery. Spatial convolutions can then be applied similarly as in 2D images with kernels being defined over voxels instead of pixels. Thus
it is possible to use the same 2D Convolutional Neural Network (CNN) architecture on the voxelized data by slightly adapting the layers so they can correctly deal with the third dimension. VoxNet [5] use occupancy grids for the voxelization step, and a three layers CNN for the classification task. However, the fact that voxels all have the same size causes the VRAM to be filled by ”empty” voxels, making Video Random Access Memory (VRAM) consumption a significant drawback for these methods.
• Multi-view methods generate multiple angles of view around the 3D object, points cloud or CAD model, with a virtual camera and for each of these angles synthesise a 2D image representing the object. The 2D images can be classic RBG/grey-scale, depth map or silhouette (binary image). The 2D images are then processed by a classic CNN to achieve the classification. In term of accuracy they have the best results, for example, RotationNet [6] currently defines a new state of the art on the Princeton data-set. However, they rely on the fact that it is possible to synthesise 2D images from every possible angle around the object. While this is generally true for CAD models because they already have surface information, it is not the case for LiDAR points cloud which must be first meshed in order to apply rasterisation algorithms. Even then the surface information calculated on the LiDAR cloud would not be as accurate as in CAD models due to occlusion and sparsity of the data.
• Finally, point-based approaches do not need an
intermedi-ate data structure. Learning directly on Points coordinintermedi-ates is another viable option which kicked off in 2017 with the apparition of PointNet [7]. Its particularity is that it does not use an intermediate structure between the points cloud and the network: the points are, without any pre-processing, directly fed to the network. There are two main issues to tackle when we learn directly from the points coordinates: the network has to be invariant to points order and to the coordinate frame of the clouds. More details about how PointNet manage those issues can be found in the next section. The authors of PointNet++ [8] and Exploring spatial contest [9] proposed to add additional layers to enable PointNet to use spatial context information.
The fact that PointNet does not need an intermediary data structure, and that it can deliver very good results despite having a relatively more straightforward architecture compared to other networks based on VGG or ResNet, makes it the most suitable candidate for our classification experiments.
III. DESCRIPTION OFPOINTNET NETWORK
PointNet [7] architecture compute a symmetric function so that the results produced by the network is invariant to the points order in the cloud. It also includes a mini-network called T-Net to handle the coordinate normalisation.
The T-Net is a miniaturised version of PointNet which goal is to predict a 3x3 matrix coefficients. These coefficients correspond to an affine transformation which is applied to the
input point cloud in order to align the data to a canonical space.
Once the points are ”aligned” by the T-Net, they go through the feature extraction module. This module mainly consists of a series of Multi-Layer Perceptron where feature vectors are extracted from each point, followed by a max pooling operation aggregating all the point features into a global feature vector. This lead to a feature space invariant to the points order. The global vector is fed to a classifier that outputs a single class for the cloud.
IV. CLASSIFICATION EXPERIMENTS
We decided to evaluate the performance of object classi-fication on LiDAR urban data with the use of the PointNet network. We then assume that each 3D points cloud contains one single urban object. Object classification can be opposed to the task of semantic segmentation where points are anno-tated by a class only and where points cloud may include many objects. The goal of our experiments is to evaluate the network ability to predict the class of an object just by processing its coordinates. We will briefly describe the experiments in the following section.
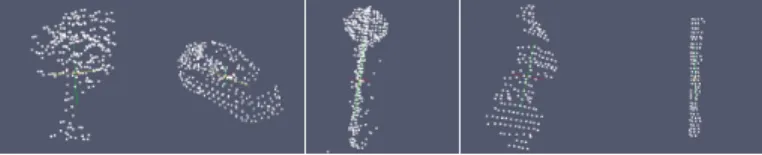
Fig. 1: Data-set SetA: left to right, a tree, a car, a traffic sign, a person, a pole.
A. data-sets
Due to the lack of reference data-set in the field of 3D points cloud classification, we decided to assemble data from every annotated data-set which contains urban objects points cloud and organise them in 6 different classes: tree, car, traffic sign/light, pole, person. Some examples are shown in Fig. 1. In order to increase the generality of the network, we added two classes: building and noise/artefact. Three publicly available data-sets satisfied this criterion to our knowledge: Kevin Lai data-set [10], Paris rue Madame [11] and Sydney urban objects data-set [12]. This makes for a total of 724 objects with 20% being used for validation. In the rest of the paper, we will refer to this data-set as SetA.
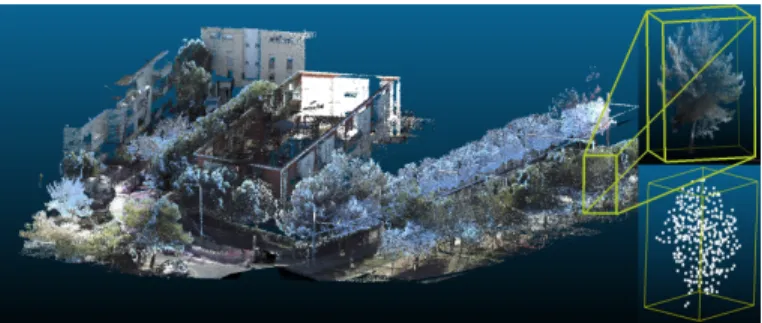
Additionally, we realised a LiDAR mobile acquisition with the help of a Leica Pegasus backpack. This acquisition was performed in an urban environment by a walking person for 200 meters. A global visualisation of the urban scene can be found in Fig. 2. We manually extracted 160 urban objects from this acquisition: 75 trees, 39 cars, 8 traffic signs/lights, 23 poles, and 15 persons. In the rest of the paper, we will refer to this data-set as SetB.
The points clouds sizes are between 200 and 3,000 for SetA and between 100 and 300,000 for SetB. We then sampled them to 512 points each with a voxel-grid filter so that they can be used as input for the PointNet network. In Fig. 2 we present
an illustration of the extraction of a set of points, standing for a tree object, and its sub-sampling to a 512-points cloud without the colours, from SetB.
Fig. 2: Overview of the acquisition we performed: we can see some trees, poles and a small residential area.
B. Baseline
In this section, we recall the experiments in [13]. We use the Tensorflow implementation of PointNet to train a network with SetA and test it on SetB. This implementation use data augmentation with random rotations along the up axis and Gaussian noise jiitering. The results are reported in Table I.
We found that the overall F1 score is 0.742. The F1 scores for the class tree, 0.896, car, 0.904, and person, 0.828, are satisfactory. However for the classes traffic sign/light and pole the scores are much lower: 0.267 for traffic signs and 0.074 for poles. Overall the results are encouraging considering the small numbers of data used for the learning.
TABLE I: Confusion matrix for baseline experiment. Overall F1 score: 0.742
tree(75) car(39) traffic(8) pole(23) person(15)
tree 69 2 0 8 0 car 1 33 0 0 0 traffic 4 0 4 12 2 pole 0 0 3 1 0 person 1 0 1 0 12 building 0 0 0 2 0 noise 0 4 0 0 1 F measure 0.896 0.904 0.267 0.074 0.828 C. Further experiments
In this section, each of the experiment uses the same data protocol as the baseline, unless specified otherwise. The overall F1 score is the weighted mean of each classes F1 score. Notice that our database is of relatively small size and that the point density is variable as points clouds come from different acquisition protocols.
1) Adding more data: In this experiment, we enrich the SetA with some of the objects available in the recent ParisLille data-set [14].
From Roynard’s data-set we extract over 900 objects which could fit one of our 8 classes and added them to our SetA. We then performed another classification experiment with the newly augmented SetA as training set and with SetB as our test set. This makes our training set size goes up to 1668, making for an increase in the size of 230%.
The results in Table II shows an increase in global F1 score: from 0.742 to 0.868 (+12.3%). The increase in F1 score affect all classes except for the person class which goes from 0.828 to 0.815 (-1.3%). The increase is the highest for the pole class with a gain from 0.074 to 0.629 (+55.5%). The car class also reach a score of 0.963 from 0.904 (+5.9%).
Looking at the results Table II we observe a notable improvement in performance coming from the enrichment of our training set. This is not surprising considering that it is generally accepted in the field of deep-learning that the most efficient way to improve a network accuracy is to feed it with more data during training.
TABLE II: Confusion matrix for experiment with more data. Overall F1 score: 0.868
tree(75) car(39) traffic(8) pole(23) person(15)
tree 70 0 0 2 1 car 2 39 0 0 1 traffic 2 0 7 10 2 pole 0 0 1 11 0 person 0 0 0 0 11 building 1 0 0 0 0 noise 0 0 0 0 0 F measure 0.946 0.963 0.467 0.629 0.815
2) Class fusion: One of the reasons of the low perfor-mances for both the pole and traffic signs/lights classes is that the network confuses them for one another which is not surprising considering how similar theses shapes are. We then fuse them into one single TSLP (traffic sign/light + pole) class and rerun the classification experiment with only 6 classes instead of 7.
The results in Table III shows a significantly higher F1 score for the TSLP class, 0.849, than it was in Table I for the traffic sign/light class 0.267, and the pole class 0.074. If we combine the results of the baseline experiment for these 2 classes, we find that 20 times out of 31 the network predicted either a pole or traffic sign/light when it was passed one. This gives us a F1 score of 0.702 which is still lower than for the TSLP class (0.849). Coming back to the comparison of the baseline results versus the fusion results (TSLP class), there is also an increase in overall F1 score from 0.742 to 0.862 (+12%) as well as a slight increase for the tree class, 0.896 to 0.920 (+2.4%). However, we can also see a decrease in the classes car and person, respectively from 0.904 to 0.806 (-9.8%) and from 0.828 to 0.750 (-7.8%).
The network correctly learns how to differentiate the poles and the traffic signs/lights from the rest, but it has trouble distinguishing between them. Nevertheless fusing those classes cannot be a long term strategy because, as it is notable in our results, the consensus in deep-learning is that more classes used for training the network tend to improve its overall accuracy. This comes from the fact that fewer classes mean fewer negative examples for each of the other classes. That is why the drop in accuracy for the ’person’ and ’car’ classes are not that surprising.
3) Number of points: In the baseline experiment we sam-pled all of our data to 512 points. The down-sampling method
TABLE III: Confusion matrix for experiment with pole and traffic sign/light classes fused. Overall F1 score: 0.862
tree(75) car(39) TSLP(31) person(15)
tree 69 3 3 0 car 1 27 0 0 TSLP 2 0 28 5 person 0 0 0 9 building 1 0 0 0 noise 2 9 0 1 F measure 0.920 0.806 0.849 0.750
is a uniform voxel-grid algorithm. To evaluate the influence of points number we run the same sampling but replace the final count with 2048 points instead of 512.
In Table IV the overall F1 score slightly increases from 0.742 to 0.761 (+1.9%). Some classes go up like tree : 0.935 (from 0.896: +3.9%), traffic sign/light: 0.385 (from 0.267: +11.8%) and pole: 0.080 (from 0.074: +0.6%) and some go down like car: 0.886 (from 0.904: 1.8%) and person: 0.813 (from 0.828: -1.8%). However these variations remain small.
The overall interpretation of these results is that the number of points has little impact on the F1 score predicted by the network. This is the same conclusion that the authors of [7] came to in their experiments. An interesting follow up to that experiment would be to determine how much we can subsample our data-set before we can notice a drop in the accuracy of the network.
TABLE IV: Confusion matrix with point clouds size of 2048. Overall F1 score: 0.761
tree(75) car(39) traffic(8) pole(23) person(15)
tree 72 3 0 4 0 car 0 31 0 0 0 traffic 1 0 5 10 2 pole 0 0 1 1 0 person 2 0 2 0 13 building 0 4 0 2 0 noise 0 1 0 6 0 F measure 0.935 0.886 0.385 0.080 0.813
4) Discussion: We can conclude from our experiments that the results of the classification of urban objects points cloud are satisfying and are bound to get better as we get more data to train the networks. Even though other paths could be explored to further boost the performance like more complex architecture or virtual augmentation, the most efficient way to do it is to add more data to the training set.
We also hypothesise that some miss-classified point cloud examples were probably due to their too 3D simplistic ”shape” obtained after the voxel-grid downsampling process. We thus speculate that some of the errors could come from the degra-dation of the original point clouds.
V. CONCLUSION
In this paper, we presented a battery of experiences on 3D urban object classification using PointNet. These experiments showed that the best way to improve the F1 score is to have larger training data-set. All data used in this paper
are available at this address : http://www.lirmm.fr/∼chaumont/
DemoAndSources.html.
We also pointed out that one of the limiter factors for these experiments could be the degradation of the points cloud by the voxel grid filter. A way to improve the classification network would then be to allow to take the original LiDAR point clouds as input. This amelioration is also linked to our first goal which is the instance segmentation in a large urban 3D scene.
In the future, we will study the impact on the performances, of the enrichment of the training set, with synthesised point clouds representing simple urban objects such as poles or trees, and see if it has the same effect as adding real scanned data. We will also address the issue of urban object detection in a scene made of a vast number of 3D point clouds.
REFERENCES
[1] Y. LeCun, Y. Bengio, and G. Hinton, “Deep learning,” Nature, vol. 521, no. 7553, pp. 436–444, May 2015.
[2] O. R. et al., “ImageNet Large Scale Visual Recognition Challenge,” International Journal of Computer Vision (IJCV), vol. 115, no. 3, pp. 211–252, 2015.
[3] S. Ren, K. He, R. B. Girshick, and J. Sun, “Faster r-cnn: Towards real-time object detection with region proposal networks,” IEEE Transactions on Pattern Analysis and Machine Intelligence, vol. 39, pp. 1137–1149, 2015.
[4] D. A. et al., “Google street view: Capturing the world at street level,” Computer, vol. 43, pp. 32–38, 2010.
[5] D. Maturana and S. Scherer, “VoxNet: A 3D Convolutional Neural Network for real-time object recognition,” in IEEE/RSJ International Conference on Intelligent Robots and Systems (IROS), Hamburg, Ger-many, 2015, pp. 922–928.
[6] A. Kanezaki, Y. Matsushita, and Y. Nishida, “Rotationnet: Joint object categorization and pose estimation using multiviews from unsupervised viewpoints,” in Proceedings of IEEE International Conference on Com-puter Vision and Pattern Recognition (CVPR), Salt Lake City, Utah, 2018.
[7] C. R. Qi, “PointNet: Deep Learning on Point Sets for 3D Classification and Segmentation,” http://github.com/charlesq34/pointnet, Mar. 2018. [8] C. R. Qi, L. Yi, H. Su, and L. J. Guibas, “Pointnet++: Deep hierarchical
feature learning on point sets in a metric space,” in Advances in Neural Information Processing Systems 30: Annual Conference on Neural Information Processing Systems 2017, 4-9 December 2017, Long Beach, CA, USA, 2017, pp. 5105–5114.
[9] F. Engelmann, T. Kontogianni, A. Hermans, and B. Leibe, “Exploring spatial context for 3d semantic segmentation of point clouds,” IEEE International Conference on Computer Vision Workshops, ICCV Work-shops 2017, Venice, Italy, pp. 716–724, 2017.
[10] K. Lai and D. Fox, “Object Recognition in 3D Point Clouds Using Web Data and Domain Adaptation,” International Journal of Robotics Research, vol. 29, no. 8, pp. 1019–1037, July 2010.
[11] A. Serna, B. Marcotegui, F. Goulette, and J. Deschaud, “Paris-rue-madame database - A 3d mobile laser scanner dataset for benchmarking urban detection, segmentation and classification methods,” in ICPRAM Proceedings of the 3rd International Conference on Pattern Recognition Applications and Methods, ESEO, Angers, France, 2014, pp. 819–824. [12] A. Quadros, J. Underwood, and B. Douillard, “An Occlusion-aware Feature for Range Images,” in Robotics and Automation, 2012. ICRA’12. IEEE International Conference on. IEEE, May 14-18 2012. [13] Y. Zegaoui, M. Chaumont, G. Subsol, P. Borianne, and M. Derras, “First
experiments of deep-learning on lidar point clouds for classification of urban object,” CFPT Congres de la societe Francaise de Photogramme-trie et de Teledetection, 2018.
[14] X. Roynard, J.-E. Deschaud, and F. Goulette, “Paris-lille-3d: A large and high-quality ground-truth urban point cloud dataset for automatic segmentation and classification,” The International Journal of Robotics Research, vol. 37, no. 6, pp. 545–557, 2018.