HAL Id: hal-02434169
https://hal.archives-ouvertes.fr/hal-02434169
Submitted on 10 Feb 2020
HAL is a multi-disciplinary open access
archive for the deposit and dissemination of
sci-entific research documents, whether they are
pub-lished or not. The documents may come from
teaching and research institutions in France or
abroad, or from public or private research centers.
L’archive ouverte pluridisciplinaire HAL, est
destinée au dépôt et à la diffusion de documents
scientifiques de niveau recherche, publiés ou non,
émanant des établissements d’enseignement et de
recherche français ou étrangers, des laboratoires
publics ou privés.
Evaluation of FluoroProbe® performance for the
phytoplankton-based assessment of the ecological status
of Mediterranean coastal lagoons
Marie Garrido, Philippe Cecchi, Nathalie Malet, Béatrice Bec, Franck Torre,
Vanina Pasqualini
To cite this version:
Marie Garrido, Philippe Cecchi, Nathalie Malet, Béatrice Bec, Franck Torre, et al.. Evaluation of
Flu-oroProbe® performance for the phytoplankton-based assessment of the ecological status of
Mediter-ranean coastal lagoons. Environmental Monitoring and Assessment, Springer Verlag (Germany), 2019,
191 (4), pp.204. �10.1007/s10661-019-7349-8�. �hal-02434169�
Evaluation
of FluoroProbe® performance
for
the phytoplankton-based assessment of the ecological
status
of Mediterranean coastal lagoons
Marie Garrido & Philippe Cecchi & Nathalie Malet & Béatrice Bec & Franck Torre & Vanina Pasqualini
Abstract The European Water Framework Directive and several other legislations worldwide have selected phyto-plankton for monitoring the ecological status of surface waters. This assessment is a complicated task in coastal lagoons due to their intrinsic variability, prompting moves to use real-time measurements. Here, we tested the ability of the submersible spectrofluorometer FluoroProbe® to accurately estimate the phytoplankton biomass and to efficiently discriminate spectral groups in Mediterranean coastal lagoons, by using sub-surface water samples (n = 107) collected at Biguglia lagoon (Corsica) in different environmental situations (salinity and trophic state) from
March 2012 to December 2014. We compared the esti-mates of biomass and phytoplankton group composition obtained with the FluoroProbe® (in situ and lab measure-ments) with the spectrofluorimetrically measured biomass and HPLC-derived quantifications of pigment concentra-tions. FluoroProbe® provided good estimates of the total phytoplankton biomass (particularly, the lab measure-ments). The FluoroProbe® data were significantly corre-lated with the HPLC results, except for the in situ mea-surements of very weak concentrations of blue-green and red algae. Our findings indicate that factory-calibrated FluoroProbe® is an efficient and easy-to-use real-time phytoplankton monitoring tool in coastal lagoons, espe-cially as an early warning system for the detection of potentially harmful algal blooms. Practical instructions dedicated to non-specialist field operators are provided. A simple and efficient method for discarding in situ measurement outliers is also proposed.
Keywords Phytoplankton . Monitoring . Mediterranean coastal lagoons . FluoroProbe® . HPLC
Introduction
Mediterranean coastal lagoons are increasingly ex-posed to nutrient enrichment, mainly driven by urban-ization, tourism, and agricultural activities (Justic et al.
1995; Flo et al.2011). Nutrient enrichment disturbs the ecosystem metabolism and the structure of the native aquatic communities (Pasqualini et al. 2017),
M. Garrido
:
V. PasqualiniUMR SPE CNRS, UMS Stella Mare CNRS, Université de Corse, BP 52, 20250 Corte, France
P. Cecchi
:
B. BecMARBEC, CNRS, Ifremer, IRD, University Montpellier, Montpellier, France
P. Cecchi (*)
Centre de Recherches Océanologiques (CRO), BP V18, Abidjan 18, Côte d’Ivoire
e-mail: philippe.cecchi@ird.fr N. Malet
IFREMER, Laboratoire Environnement Ressources
Provence-Azur-Corse, Station de Corse, Z.I. Furiani, Immeuble Agostini, 20600 Bastia, France
F. Torre
Institut Méditerranéen de Biodiversité et d’Ecologie marine et continentale, UMR IMBE, Aix Marseille Univ, Avignon Université, CNRS, IRD, Marseille, France
intensifies the eutrophication of coastal waters (Nixon
1995; Glibert 2017), and favors the occurrence of harmful algal blooms (Collos et al. 2004; Spatharis et al. 2007; Smayda 2008; Heisler et al. 2008; Cecchi et al. 2016; Glibert and Burford 2017). In response to the degradation of water resources, the European Union Water Framework Directive 2000/60/EC (EU-WFD) was put in place with the aim of maintaining and improving water quality. Ac-cording to the EU-WFD, the phytoplankton metrics required for defining and classifying the ecological status of transitional waters are biomass (chlorophyll a), community structure (composition and species abundances), and algal bloom frequency and intensity. Chlorophyll a concentration is an integrative measure of the phytoplankton community responses to nutrient enrichment (Giovanardi et al. 2018) and is generally quantified using a spectrofluorometer (e.g., Neveux and Lantoine 1993). However, with such deferred lab methods, the diagnosis is not immediately available. Moreover, they are intrusive (use of solvent) and labor-intensive. The eutrophication-driven increase in chloro-phyll a is always accompanied by changes in the phyto-plankton community structure (Bec et al. 2011). The Utermöhl method (Utermöhl 1958; CEN EN 15204
2006), which is based on traditional cell counts with an inverted microscope, is the only method that allows the taxonomical resolution at the species level for the largest species. This method remains widely used for the routine monitoring of potentially toxic taxa. However, taxonomic identification requires experienced analysts (Vuorio et al.
2007), is time-consuming, and is debated for cells smaller than ~ 10 μm. Pigment analysis by high-performance liquid chromatography (HPLC) is an alternative option that provides a highly reproducible and relatively rapid bulk estimate of the major phytoplankton groups present in a sample (Wright and Jeffrey 1997; Schlüter et al.
2014; Leruste et al.2016) by detecting diagnostic marker pigments, known as accessory pigments (Vidussi et al.
2001; Johnsen and Sakshaug2007; Marty et al. 2008; Bel-Hassen et al.2009). All the phytoplankton cell sizes of a sample are considered, including picophytoplankton and mesoplankton (Leruste et al. 2015). However, the lack of pigment specificity for some groups led to couple HPLC with optical microscopy to identify dominant and sub-dominant species (Havskum et al.2004). Flow cy-tometry was first used to analyze the abundant picophytoplankton cells (Marie et al. 1997; Jacquet et al.1998; Bec et al.2005), and technical developments
have extended the cell size range up to hundreds of microns. However, this method does not provide detailed insights on the sample taxonomic composition. FlowCAM theoretically allows combining flow cytome-try capabilities and microscopy accuracy, but significant methodological improvements are still required (See et al.
2005; Álvarez et al.2011,2014; Romero-Martínez et al.
2017). Recently, molecular techniques (metabarcoding) have been developed for inventorying taxa in environ-mental samples, and they can efficiently identify rare, unknown, or hidden microorganisms (Grzebyk et al.
2017). However, even promising, such approaches are not yet adapted to frequent and rapid monitoring because they are still in development and lack standardized pro-cedures, they remain time-consuming and expensive, and will require inter-calibration efforts with classical methods. Moreover, they remain very sensitive to labo-ratory protocols and statistical analysis strategies (Eckford-Soper et al. 2018) and require better supple-mented DNA reference libraries (Rivera et al. 2018; Hering et al. 2018). Beutler et al. (2002) designed a multi-wavelength probe called FluoroProbe® (BBE-Moldaenke, GmbH). This is a submersible spectrofluo-rometer that can assess chlorophyll biomass and distin-guish the main phytoplankton classes by using the auto-fluorescence properties of pigment-containing micro-or-ganisms. FluoroProbe® contains five light-emitting di-odes (450, 525, 570, 590, and 610 nm) for excitation of the accessory pigments associated with the photosystem-II antenna system of phytoplankton and one 370 nm diode for excitation and subsequent subtraction of the fluorescence from chromophoric dissolved organic mat-ter (CDOM). This technology is now widely applied in very different environments by scientists and freshwater resource managers for lab and in situ studies of phyto-plankton communities (Rolland et al. 2010; Catherine et al. 2012, 2016; Švanys et al. 2014; Patidar et al.
2015; Maloufi et al. 2016; Morgan-Kiss et al. 2016; Poxleitner et al. 2016; Silva et al. 2016; Wang et al.
2016; Blottière et al.2017; Cyr 2017; Karpowicz and Ejsmont-Karabin2017; Giling et al.2017; Teufel et al.
2017). FluoroProbe® main advantage is the immediacy of the performed measurements, although it does not give the same level of taxonomic precision as microscopy-based methods, and may significantly underestimate the biomass when phytoplankton communities are very dense (i.e., chlorophyll a > 250 μg L−1, Wang et al.
2016), or in samples with very low biomasses (Bradie et al. 2018). Moreover, the relationships between
fluorescence, chlorophyll a value, and the proportion of the different phytoplankton groups could be disturbed by strong variability linked to the phytoplankton community structure, environmental conditions, physiological status, quenching, and irradiance history of individual algal cells, making the conversion to phytoplankton biomass sometimes imprecise (Lawrenz et al. 2010; MacIntyre et al.2010; Catherine et al.2012; Escoffier et al.2015; Blottière et al.2017). The quality of the provided esti-mates is also strongly dependent on the instrument cali-bration (factory or home-made settings), which is gener-ally performed using laboratory-grown phytoplankton strains that might not exactly reflect the environmental conditions of natural samples (Harrison et al.2016; Silva et al.2016). Nevertheless, MacIntyre et al. (2010) report-ed that the relationships between fluorescence intensity and chlorophyll a are robust when the fluorescence var-iation range is large enough, and when there is qualitative agreement between the phytoplankton classes defined by their spectral fluorescence signatures and by other ana-lytical methods. Few studies have used FluoroProbe® measurements for the analysis/monitoring of coastal and transitional waters. See et al. (2005) found that in the Gulf of Mexico, diatom and dinoflagellate contributions to the whole phytoplankton biomass were comparable when using FluoroProbe® and HPLC. Similar results were reported by Liu et al. (2012) by comparing FluoroProbe® estimates, HPLC results, and microscope observations in the Yellow Sea, except when the biomass was very low (i.e., < 1μg L−1). van Beusekom et al. (2009) concluded that by combining the FluoroProbe® technology and microscopy, the small-scale plankton dynamics (biomass and taxonomic spectrum) could be fully captured in the Baltic Sea. Richardson et al. (2010) showed that in US estuaries, the estimates of biomass and taxonomic struc-ture of phytoplankton obtained using the Algae Online Analyzer (a spectral fluorometer, like FluoroProbe®) were consistent with those derived from HPLC-measured marker pigments. Houliez et al. (2012) con-firmed that FluoroProbe® and flow cytometry allowed obtaining similar Phaeocystis globosa annual dynamic estimates in the coastal waters of the eastern English Channel. More recently, Gordon et al. (2016) efficiently documented the temporal changes of phytoplankton as-semblages associated with a shift from oligohaline to hyperhaline conditions in the St Lucia Lake (South Afri-ca) using a FluoroProbe®. However, to our knowledge, no study has investigated FluoroProbe® performance for assessing the long-term phytoplankton dynamics in
euryhaline Mediterranean coastal lagoons, which often are characterized by very variable trophic statuses.
Here, we tested FluoroProbe® ability to estimate the phytoplankton biomass and to discriminate the phyto-plankton spectral groups, by using sub-surface water samples (N = 107) collected in the Biguglia lagoon (Corsica) in very different environmental situations (sa-linity and trophic state) over 3 years. For this purpose, we compared FluoroProbe® estimates of total biomass with the spectrofluorimetrically measured chlorophyll a values, and the FluoroProbe® in situ and lab estimates of the taxonomic structure with HPLC-based identifica-tion of marker pigments of the studied phytoplankton communities. Microscope counts were available only for a small fraction of the samples (see Garrido et al.
2016) and were not included in the study. Moreover, the main end-users of our results (i.e., managers of Medi-terranean coastal lagoons) rarely have the required tax-onomical expertise. Indeed, this study wants to provide a simple, quick, and efficient tool for non-specialists who need to characterize and monitor the ecological status of the water bodies they supervise.
Materials and methods
Sampling site and sample preparation
Samples were collected in the Biguglia lagoon (Corsica, France, Mediterranean Sea; Fig.1). This shallow coastal lagoon is a confined ecosystem that is disturbed by growing eutrophication and that exhibits a wide range of environmental conditions and trophic states docu-mented since the 1980s (Bec et al.2011; Garrido et al.
2013,2016; Pasqualini et al.2017). From 2000, a very sharp drop of salinity has been observed in the entire lagoon, associated with a gradual closing of the natural grau (sea side inlet) and a simultaneous increase (con-trolled or not) in the freshwater input. This hydrological context affected the water quality: accumulation of nu-trients supplied by run-off and reduced possibility of dilution by seawater. This situation alerted the public authorities in charge of the management and protection of this ecosystem, and remediation efforts have been undertaken to improve the water quality of the Biguglia lagoon, mainly through the management of water fluxes: artificial openings of the grau in the North and increased freshwater entrance in the South. The effects of such hydrological manipulations have been
monitored through a long-term survey of the phyto-plankton communities.
Grab samples were collected regularly at six different sampling points (Fig.1), from March 2012 to December 2014. All sampling points were deep enough for the in
situ use of the FluoroProbe®. Water samples (n = 107) were collected in a Niskin-like bottle and immediately distributed in opaque 1-L flasks. Two samples were systematically collected at each location, one ≈ 50 cm below the surface and a second ≈ 50 cm above the
Fig. 1 Situation map: the Biguglia lagoon and the sampling points (depths are indicated)
sediment (in order to avoid contamination by bottom resuspension), with the aim of tracking the contrasting phytoplankton communities that may inhabit the two horizons (see for example Table 3 in Garrido et al.2013
and Fig. 7 in Garrido et al.2016).
Sample preparation and analyses were performed within 2 h after sample collection. For each sample, salinity, temperature, dissolved oxygen, and turbidity were measured in situ with a portable multi-parameter meter (YSI Environmental Monitoring Systems). The concentration of dissolved inorganic nutrients was mea-sured in aliquots filtered through Whatman GF/F filters (0.7μm nominal pore size) using the methods described by Holmes et al. (1999), Raimbault et al. (1999), and Aminot and Kérouel (2007).
FluoroProbe® measurements
Phytoplankton biomass (μg eq. Chl a L−1) was assessed
in situ and at lab using a FluoroProbe®. This device can differentiate betweenBspectral^ groups of phytoplank-ton on the basis of their relative chlorophyll a fluores-cence intensity at 680 nm (due to the photosystem-II core pigments; Beutler et al.2002; Leboulanger et al.
2002; Gregor and Maršálek2004). The instrument seg-regates phytoplankton in xanthophyll-containing brown algae (dinoflagellates, diatoms, and chrysophyceae) (525 nm), green algae (chlorophyceae, euglenophyceae, and prasinophyceae) rich in chlorophyll a and b (450 nm), blue-green algae (phycocyanin-rich cyanobacteria) (590 and 610 nm) and red algae (phycoerythrin-rich cyanobacteria and cryptophyceae) (570 nm; Beutler et al.2002). The system detects a set of characteristic fingerprints that are used by dedicated software (version 2.2.6) to calculate the relative contri-butions of each algal class to the global phytoplankton biomass (Beutler et al.2002). The UV LED (370 nm) that was added to the latest generation of devices is used to measure the fluorescence of CDOM, and their even-tual influence is corrected by the software. Given the very contrasting phytoplankton communities potentially associated to the different environmental conditions of our dataset, the FluoroProbe® was used with the factory calibration. The factory fingerprints were obtained by the manufacturer from repeated fluorescence measure-ments using 35 laboratory cultures that involved several species per spectral algal group (green: Scenedesmus sp., Chlamydomonas sp., Monoraphidium sp., Chlorella sp., M irac tini um sp.; blue: M icroc ysti s sp.,
Synechococcus sp., Aphanizomenon sp., Anabaena sp.; brown: Cyclotella sp., Nitzschia sp., Synedra sp., Ceratium sp., Peridinium sp.; mixed: Cryptomonas sp.). The associated Chl a amounts were determined by HPLC. Samples were previously adapted to the measuring light for 90 s and fluorescence measurements were performed at 20 °C. For more details, see Beutler et al. (2002). This corresponds also to the simplest way of using this tool by non-specialists.
The in situ measurements using the FluoroProbe® were performed at 50 cm below the surface and at 50 cm above the sediment. In the laboratory, FluoroProbe® measurements were done using 25-mL fractions of each sample placed in the original optical glass cuvette (25 × 25 × 70 mm) fitted into the device. Samples were sys-tematically dark-adapted for 20 min before measure-ments (Beutler et al. 2002). The total chlorophyll a concentration and the equivalent concentrations of chlo-rophyll a for each phytoplankton class identified on the basis of the fluorescence signals were calculated with the FluoroProbe® software.
Spectrofluorimetric quantifications
Chlorophyll a was quantified using 100 mL of each sample filtered through Whatman GF/F filters (25 mm diameter; 0.7μm nominal pore size) under gentle vac-uum, and immediately stored at− 20 °C after filtration. The used filters were ground in 90% acetone and ex-tracted in the dark at 4 °C for 24 h. Pigment content was then measured by spectrofluorimetry (Perkin–Elmer LS50b) and calculated according to Neveux and Lantoine (1993).
HPLC analysis
Pigments were analyzed by HPLC as described in Leruste et al. (2015, 2016). In the laboratory, 1 L of each sample was filtered through Whatman GF/F filters (47 mm diameter) under low-vacuum pressure (< 100 mmHg) and immediately stored at− 20 °C or at − 80 °C when possible. Pigments were extracted with 2.5 mL of 100% methanol in the dark at 4 °C for 5 min. Samples were then sonicated 5 times for 10 s (20 W) spaced by 10 s in ice to avoid excessive heating of the extracts. After 10 min in the dark at 4 °C, extracts were filtered on cellulose acetate filters (0.45μm pore size) to remove cell debris. An aliquot of 600 mL of each sample was diluted with 150 mL of Milli-Q water,
and then 150 mL of this dilution was injected in the HPLC system (Waters HPLC Alliance D600). Pigment extracts were analyzed using the method described by Wright and Jeffrey (1997) with a flow rate of 1 mL min−1and a run duration of 29 min. The HPLC system was calibrated with external standards (DHI Water and Environment, Hørsholm. Denmark). Chro-matograms were extracted at 440 nm, and pigments were identified by comparison with a spectral library established from the pigment standard database and by checking the elution order and absorption spectra (Roy et al.2011), using the software Empower Pro 3. Each peak was checked and the baseline readjusted to mini-mize errors due to noise. Pigments were then quantified by comparing the peak area with the standard calibration curves (mg L−1).
To establish the correlations between HPLC quantifi-cations and FP results, a series of marker pigments were used: (i) peridinin for dinoflagellates and chrysophyceae, and fucoxanthin for diatoms and chrysophyceae; (ii) chlorophyll b, prasinoxanthin, lutein, violaxanthin and neoxanthin for chlorophyceae, euglenophyceae and prasinophyceae; (iii) zeaxanthin for cyanobacteria; and (iv) alloxanthin for cryptophyceae (Vidussi et al.2001; Marty et al.2008; Bel-Hassen et al.2009).
Statistical analyses
Linear regressions were performed to assess the rela-tionship between the phytoplankton biomass values de-duced from the in situ and lab FluoroProbe® measure-ments and those quantified using a spectrofluorometer and HPLC analyses. The Chi2tests and Kruskal-Wallis one-way analyses of variance on ranks were used to compare outliers and ‘regular’ data. Bravais-Pearson correlation coefficients, regression slopes, and the asso-ciated hypothesis tests were then carried out to detect (i) correlation and regression slope coefficients different from 0, which indicated a significant linear correlation between measurements, and (ii) regression slope coeffi-cients different from 1, which indicated a lack of quan-titative agreement between measurements. Cases where, for example, the FluoroProbe® measurements exceeded the spectrofluorometer or HPLC measurements are il-lustrated by the location of most observations below the 1:1 regression line. All statistical analyses were done with the R software (R Core Team2015). The probabil-ity threshold value was fixed at p = 0.01.
Results
In situ and lab phytoplankton biomass measurements with the FluoroProbe®
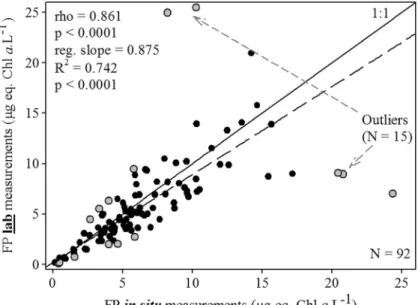
The dataset encompassed very different environmental situations (Table1) that are fully representative of condi-tions encountered in euryhaline Mediterranean lagoons throughout the year (Souchu et al.2010; Bec et al.2011; Leruste et al.2016; Le Fur et al.2018), although hyper-trophic conditions (Chl a > 100 μg L−1), which some-times occur in such systems during summer (Derolez et al. 2019) were not observed during this survey. The in situ and lab FluoroProbe® values of 15 of the initial 107 water samples were considered a posteriori as out-liers (Fig.2). These 15 outliers did not reveal any specific pattern or peculiarity when compared with‘regular’ sam-ples. Samples were collected from 2012 to 2014, and the FluoroProbe® measurement distribution of outliers over time was not different compared with that of ‘regular’ data (Chi2= 2.078; p = 0.149). Moreover, their presence could not be explained by a seasonal effect, when con-sidering the calendar (Chi2= 0.304; p = 0.582) and the hydrological seasons (Cecchi et al.2016) (Chi2= 1.109; p = 0.292). Similarly, the sampling site (Chi2= 2.059; p = 0.151) and sampling depth (Chi2= 0.327; p = 0.567) also did not influence the occurrence of outliers. Finally, comparison of the environmental conditions (tempera-ture, salinity, turbidity, nutrient concentrations) and of the phytoplankton biomass and the contribution of the four different spectral groups that constituted this biomass did not highlight any significant difference between out-liers and‘regular’ samples (p > 0.05; Kruskal-Wallis one-way ANOVAs on ranks). This suggests that there is a
Table 1 Environmental characteristics of the phytoplankton sam-ples considered in the study
N Mean Min Max
Temperature (°C) 137 18.5 6.9 30.1
Turbidity (NTU) 131 3.7 <LoD 35.4
Salinity 137 13.9 2.0 38.3 Dissolved oxygen (%) 116 91.2 39.9 167.1 Ammonium (μM) 93 5.3 <LoD 48.2 Nitrate (μM) 93 8.1 <LoD 93.2 Phosphates (μM) 84 0.2 <LoD 1.3 Chl a (μg L−1, spectrofluorometer) 137 6.3 0.1 42.2 <LoD below limit of detection
stochastic, but real risk of misleading FluoroProbe® measurements (with a frequency of 3 measurements in 20). It is not possible for a non-specialist to immediately identify outliers, whereas they are easily graphically iden-tifiable a posteriori. Therefore, we defined an empirical, but simple and efficient method for discarding such data. After performing the in situ and lab FluoroProbe® mea-surements of one sample, if the difference between the obtained values is higher than 50% of the in situ mea-surement, then the data should be discarded. After outlier elimination, the in situ and lab FluoroProbe® measure-ments of chlorophyll a were closely correlated (Bravais-Pearson’s rho = 0.861; regression slope = 0.875; p < 0.0001 in both cases, N = 92; Fig.2), and the slope coefficient was not statistically different from 1 (p = 0.023). The relationships between the chlorophyll a con-centrations provided by lab FluoroProbe® measurements and the spectrofluorimetric analyses were highly signifi-cant (Fig. 3a). The Bravais-Pearson’s rho (0.863) and
regression slope (0.913) coefficients were significantly different from 0 (p < 0.0001 in both cases), while the regression slope coefficient was not different from 1 (p = 0.124). Similar results were obtained for the in situ FluoroProbe® measurements (rho = 0.739), although a few points were more dispersed, as indicated by the lower value of the regression slope (0.793; Fig. 3b), with a coefficient that was significantly different from 1 (p = 0.008). Overall, the in situ FluoroProbe® measurements tended to slightly, but systematically overestimate the concentrations of phytoplankton biomass.
In agreement, in the 15 outliers, the lab FluoroProbe® measurements were closely correlated with the spectrofluorimetric and HPLC quantifications of chloro-phyll a concentration (Spearman rank order correlation coefficients: 0.807 and 0.868, respectively; p < 0.0001 for both), but not the in situ FluoroProbe® measure-ments (Spearman rank order correlation coefficients: 0.404 and 0.611, p = 0.131 and 0.015, respectively). Composition of phytoplankton assemblages
To evaluate FluoroProbe® ability to describe the compo-sition of phytoplankton assemblages, we compared the relationships between the biomass of each of the four discriminated groups calculated by FluoroProbe® and the HPLC-measured concentrations of the accessory pig-ments specific to each group. For brown algae, the cor-relations between HPLC (peridinin and fucoxanthin) and FluoroProbe® data (diatoms, dinoflagellates, and chrysophyceae) were significant (Fig. 4a, b). Both Bravais-Pearson’s correlation coefficients (0.774 and 0.700 for lab and in situ FluoroProbe® measurements, respectively) and linear correlation coefficients (0.599 and 0.490 for lab and in situ measurements, respectively) were higher for lab measurements. The slope coefficients were different from 0 and also from 1 (p < 0.0001 in both cases). Both approaches correctly described the main variations of brown algae contribution to the whole bio-mass, although in situ FluoroProbe®, data appeared more scattered than the lab values. We observed exactly the
Fig. 2 Relationship between lab and in situ FluoroProbe® measurements. Influential outliers (gray dots; n = 15 out of 107 samples) were not included in the statistical analyses. The solid line corresponds to the 1:1 regression line and the dashed line corresponds to the trend line from simple linear regression
Fig. 3 Relationship between spectrofluorimetric measurements and lab (a) and in situ (b) FluoroProbe® assessments of the phytoplankton biomass. The solid line corresponds to the 1:1 regression line and the dashed line corresponds to the trend line from simple linear regression
same trends after excluding the dot corresponding to the highest biomass value (Bravais-Pearson’s correlation co-efficients: 0.692 and 0.667 for lab and in situ FluoroProbe® measurements, respectively; p < 0.0001 for both; linear correlation coefficients: 0.479 and 0.445 for lab and in situ measurements, respectively; p < 0.0001 for both). For green algae, also the correlations between HPLC (chlorophyll b, prasinoxanthin, lutein, violaxanthin, and neoxanthin) and FluoroProbe® data (chlorophyceae, euglenophyceae, and prasinophyceae) were very significant (Fig. 4c, d) (Bravais-Pearson’s
rho = 0.554 and 0.558 and linear regression coefficients = 0.307 and 0.311 for lab and in situ measurements, re-spectively), indicating that the two methods provided equivalent information. The slope coefficients were dif-ferent from 0 and also from 1 (p < 0.0001 for both). For red algae, the correlations between HPLC (alloxanthin) and FluoroProbe® measurements (cryptophyceae) were again significant, with stronger relationships for the lab FluoroProbe® estimates (Bravais-Pearson’s rho = 0.533 and 0.489 and linear regression coefficients = 0.285 and 0.240, for lab and in situ measurements, respectively; p < 0.0001 in all cases) (Fig.4e, f). The slope coefficients were statistically different from 0 and also from 1 (p < 0.0001 in both cases). However, the exclusion of
the most elevated biomass value from the dataset consid-erably reduced the strength and significance of the corre-lations for lab measurements (Bravais-Pearson’s correla-tion coefficient = 0.287 and linear regression coefficient = 0.082) that, nevertheless, remained significant (p = 0.006 for both). This was no longer the case for the in situ FluoroProbe® data (Bravais-Pearson’s coefficient = 0.219 and linear regression coefficient = 0.048, p = 0.037 for both). The dispersion of data associated with the smallest biomasses (i.e., < 1μg eq. Chl a L−1) could be largely responsible of this loss of significance. For blue-green algae, the correlations were significant only between HPLC (zeaxanthin) and lab FluoroProbe® mea-surements (cyanobacteria) (Bravais-Pearson’s coeffi-cient = 0.423 and linear regression coefficoeffi-cient = 0.178; p < 0.0001 in both cases) (Fig.4g), but not in situ mea-surements (Bravais-Pearson’s correlation = 0.164, p = 0.119 and linear regression coefficients = 0.028, p = 0.113) (Fig.4h). The points were largely dispersed rela-tive to the regression line. Moreover, the concentrations were very low (median concentrations: 0.05μg L−1for HPLC-quantified zeaxanthin and 0.06μg eq. Chl a L−1 for in situ FluoroProbe®-assessed cyanobacteria), partic-ularly when compared with those of the other taxonomic groups (see concentration distribution for the different
Fig. 4 Relationships between HPLC measurements of specific accessory pigments and lab and in situ FluoroProbe® assessments of the biomass of the different phytoplankton groups (N = 92): xanthophyll-containing brown algae (a, b); green algae rich in chlorophyll a and b (c, d); phycoerythrin-rich red algae (e, f) and
phycocyanin-rich blue-green algae (g, h) (N = 92 samples). The scales of the X- and Y-axes are not the same for the different phytoplankton groups. The solid line corresponds to the 1:1 re-gression line and the dashed line corresponds to the trend line from simple linear regression
groups in Fig.5), and were close to the detection limits of the instrument. Overall, the relationships were generally more robust with lab than with in situ FluoroProbe® measurements, although FluoroProbe® tended to system-atically overestimate phytoplankton biomass.
Finally, analysis of the HPLC data on the phytoplank-ton assemblage composition revealed an important het-erogeneity (Fig. 5). The contribution of cyanobacteria varied between 0 and 67%, but remained almost always marginal (median value = 3%). Cyanobacteria were mostly associated with small phytoplankton biomasses, as indicated by the inverse relationship between the percentage of cyanobacteria and the chlorophyll a con-centration (by spectrofluorometer) (Spearman rank order correlation coefficient =− 0.336, p = 0.0011). The con-tribution of diatoms and dinoflagellates varied from 0 to 100%, with a median value of 49.8%. Diatoms and dinoflagellates were often associated with elevated chlo-rophyll a biomasses (Spearman rank order correlation coefficient = 0.262, p = 0.0117). The contributions of chlorophyceae and cryptophyceae (median values: 26% and 17%, respectively) varied independently of the chlo-rophyll a concentration (Spearman rank order correlation coefficients =− 0.0812 and − 0.0556; p = 0.441 and 0.598, respectively) and were not linked one to the other (Spearman rank order correlation coefficients = 0.101, p = 0.338), or with the abundance of cyanobacteria
(Spearman rank order correlation coefficients = 0.0418 and 0.0574, p = 0.692 and 0.586, respectively). Con-versely, their contributions were strongly and inversely correlated with the variations in diatom and dinoflagel-late assemblages (Spearman rank order correlation coef-ficients =− 0.626 and − 0.602 for chlorophyceae and cryptophyceae, respectively, p < 0.0001 for both).
Discussion
Water quality monitoring in coastal ecosystems is cru-cial owing to the multitude and magnitude of environ-mental threats. In France, it is also an obligation regis-tered in the EU-WFD. Phytoplankton taxonomy-based tools are already available, but they require important laboratory efforts and a solid expertise, particularly for the correct identification of organisms. Alternative ap-proaches that exploit the fluorescence properties of al-gae, such as the spectrofluorometer Fluoroprobe®, are now routinely used in freshwater ecosystems (Catherine et al. 2016; Švanys et al. 2014; Patidar et al. 2015; Maloufi et al.2016; Morgan-Kiss et al.2016; Poxleitner et al.2016; Silva et al.2016; Wang et al.2016; Blottière et al.2017; Cyr2017; Karpowicz and Ejsmont-Karabin
2017; Giling et al.2017; Teufel et al.2017). However, the performances of this instrument have never been
Fig. 5 HPLC-deduced
composition of the phytoplankton assemblages of the 92 water samples considered in this study (% of specific accessory pigments)
formally assessed in Mediterranean coastal ecosystems, where both environmental conditions and the composi-tion of phytoplankton assemblages are hugely variable and different from those of freshwater systems. To eval-uate Fluoroprobe® performance (phytoplankton bio-mass quantification and discrimination of the main phy-toplankton classes) in such conditions, we used 107 samples collected at six sites in the coastal Biguglia lagoon between March 2012 and December 2014. Our aim was to provide valid outcomes for users who are not specialists in phytoplankton (ecology and taxonomy), but are involved in the regular monitoring and follow-up of Mediterranean coastal aquatic ecosystems.
One of the first problems associated with this a posteriori approach was the presence of 15 outliers among the 107 FluoroProbe® measurements. Beyond their graphical identification, which remains subjective, we defined an empirical and very simple method (i.e., a difference between the in situ and lab measurements higher than 50% of the in situ) to allow the identification of such outliers by field users and managers who are the main end-users targeted by this study. This implies that lab measurements must also be available. We failed to find any element to explain the presence of outliers. The lab, but not the in situ FluoroProbe® measurements were closely correlated with the spectrofluorimetric and HPLC quantifications of chlorophyll a in the 15 outliers. This suggests that in situ measurements are primarily responsible for the observed discordances. Indeed, although the samples used for laboratory analy-ses (i.e., lab FluoroProbe® measurement and HPLC and spectrofluorimetric quantifications) were theoretically collected at the same depth where the in situ measure-ment was performed, depth discrepancies cannot be excluded. This could lead to measurement differences in the case of vertical heterogeneity in the phytoplankton community repartition. Such heterogeneity was previ-ously observed (but not during the survey) in the Biguglia lagoon, particularly during periods of impor-tant water fluxes that may generate the development of a salt wedge (Garrido et al.2016), and/or near the marine outlet of the lagoon where important vertical gradients might induce significant stratifications of water masses and their phytoplankton communities (Garrido et al.
2013). Coastal lagoons are by definition transitional ecosystems where both marine and freshwater circulate and often create complex hydrodynamic patterns even at short spatial and time scales. The associated patchiness of phytoplankton structures in such ecosystems has been
known for decades (Platt and Denman1980; Therriault and Platt1981) and remains a challenging issue when working on discrete samples. Moreover, the existence of very fine vertical microstructures, particularly in the vicinity of important vertical gradients, should also be considered (Viličić et al. 1989), with possible phyto-plankton decay and mortality that may considerably modify their chlorophyll content and thus their fluores-cence properties. Finally, turbidity maxima regularly occur at the halocline, which may locally disturb the photosynthetic machinery with important consequences on microalgae fluorescence. Within such microlayers, although the composition of phytoplankton assem-blages is not directly involved, adaptive physiological strategies, involving particularly photosynthesis and nu-trient uptake, allow phytoplankton to cope with con-trasting environments, but affect its auto-fluorescence properties. This has been extensively documented in near-surface microlayers, which were not involved here (sub-surface sampling was systematically performed at about 50 cm below the surface). Depending on the vertical organization of the environmental parameters, particularly in the case of strong thermal stratification (i.e., during summer), phytoplankton cells could be confined in water masses with poor or even deleterious conditions for their metabolism. For instance, variations in light exposure might lead to important physiological adaptations. Alternatively, concomitantly, the pigment ratio (amount of pigments and quantity of active chlo-rophyll per cell) could vary considerably (see the third edition of the reference book of Kirk2011) and explain the observed discrepancies. However, such ecophysio-logical mechanisms seem improbable here, because nei-ther the depth where outliers were sampled (i.e., poten-tially involving light inhibition of sub-surface samples), nor the season of their collection (e.g., potentially cor-responding to stratification periods during summer) ap-peared to affect the outlier occurrence. Lastly, in situ measurements were performed without any sample preparation, whereas lab measurements were systemat-ically done after sample adaptation to the dark for 20 min, as classically recommended (Beutler et al.
2002). Such difference might justify important modifi-cations in the auto-fluorescence properties of phyto-plankton, primarily due to changes in the redox states of photosynthetic chain intermediates and, subsequent-ly, of their respective fluorescence fingerprints. This hypothesis cannot be tested because direct in situ dark-adaptation is impossible with the FluoroProbe® device.
Beyond the large variability of environmental condi-tions regularly encountered in such ecosystem (Table1), the natural phytoplankton assemblages sampled and used for testing the FluoroProbe® performance revealed also an important heterogeneity (Fig.5). Therefore, we may assume that almost all possible types of transitional water were encountered at least once during sampling and were incorporated in the analyses. The strong relationships between chlorophyll a concentrations provided by the FluoroProbe® measurements and spectrofluorometer analyses are in agreement with literature data on lakes and reservoirs (Gregor and Maršálek2004; Gregor et al.
2005; Rolland et al.2010; Catherine et al.2012) and on marine and transitional waters (See et al.2005; MacIntyre et al.2010; Richardson et al.2010; Houliez et al.2012,
2017; Ostrowska et al.2015). Errors in absolute concen-tration assessments may arise from various causes. Differ-ences in abiotic environment (e.g., light, nutrient concentrations, CDOM; Lawrenz et al.2010; MacIntyre et al.2010) and phytoplankton community composition (especially cell size) can affect the fluorescence responses, resulting in variations in the fluorescence-to-chlorophyll a ratio (FChl) that is used to convert the fluorescence data into chlorophyll a units. In addition, as the FluoroProbe® method measures the fluorescence emitted by physiolog-ically active cells, the estimated values of chlorophyll a concentration are influenced by the cell physiological status (active, senescent, and/or lysed) that can also affect their pigment content (MacIntyre et al.2010). The corre-lations between FluoroProbe® measurements and HPLC analyses were systematically strongly significant for brown, red, and green algae (FluoroProbe® overestima-tion), in line with the literature (Richardson et al.2010; Rolland et al. 2010; Catherine et al.2012), but not for cyanobacteria. FluoroProbe® diagnostic efficiency ap-peared to be lower also for discriminating very weak biomasses of cryptophytes. Diatoms and dinoflagellates are always well represented and often dominant in Med-iterranean lagoon waters (Ayadi et al.2004; Bec et al.
2011; Carić et al.2011; Garrido et al.2016), as observed here. Chlorophyceae and cryptophyceae tend to dominate phytoplankton communities in lagoon areas influenced by freshwater inputs (Gregor and Maršálek2004; Catherine et al.2012; Garrido et al.2016). Cyanobacteria are regu-larly sampled in Mediterranean lagoons, notably in the most degraded (towards hypertrophy) ecosystems (Bec et al. 2005; Chomérat et al. 2007; Pulina et al.2011). During the survey, the cyanobacteria biomass in the Biguglia lagoon was always very small, close to the
FluoroProbe® limit of detection value, although an im-pressive summer bloom of cyanobacteria has already been reported in this ecosystem (up to 100 μg L−1in 2007, associated with the massive development of the potential-ly toxic cyanobacteria Anabaenopsis circularis; Ifremer data). The annual fluctuations of cyanobacteria abundance within Mediterranean coastal lagoons exhibit a strong seasonality that could be related to water temperature, availability of nutrients and/or irradiance (Agawin et al.
1998; Bec et al.2005; Chomérat et al.2007; Armi et al.
2010). The different causes (environmental and physio-logical) that may induce interferences or excessive biases when assessing in situ cyanobacteria biomasses have been recently discussed by Zamyadi et al. (2016), who con-cluded that ‘bbe [i.e. FluoroProbe®] has the smallest bias’. The environmental risks and health hazards poten-tially associated with cyanobacteria are directly linked to the importance of their biomass during proliferation events. The World Health Organization (WHO) indicated thresholds below which the risks remain low to moderate (i.e., 50μg Chl a L−1or 100,000 cells L−1) (Chorus and Bartram1999). Within the context of a monitoring net-work aware of such possible occurrences (as this is the case in the Biguglia lagoon), even relatively imprecise biomass measurements are useful to alert about a possible change in cyanobacteria abundance, prompting the col-lection of grab samples for microscopic analyses.
The discrepancies between FluoroProbe® assess-ments and HPLC analyses for some phytoplankton groups could stem from the heterogeneity of such com-munities and the fact that the probe was factory-calibrated (species and CDOM concentrations; see the Introduction part in Twiss2011). Correlations could be significantly improved by calibrating in function of the representative species in the region under study (Leboulanger et al. 2002; Richardson et al. 2010; Houliez et al.2012; Kring et al.2014) and by factoring in CDOM concentrations (Lawrenz et al. 2010). This would have been difficult here due to the heterogeneity of the many phytoplankton communities studied. How-ever, the ecological situation of the Biguglia lagoon has changed in recent years. The apparition and durable maintenance of harmful dinoflagellates especially the species Prorocentrum minimum (Garrido et al. 2016) requires special attention. In this new context, the re-calibration of the instrument with a reference specific of this species would be perfectly justified in order to allow the effective monitoring of this noxious invader by managers. However, one of the disadvantages of the
FluoroProbe is that it is able to discriminate only four phytoplankton groups so that the addition of a new fingerprint is only possible if one of the four default fingerprints is disabled. The selection of this fingerprint is not obvious, and the added value of this re-calibration has thus to be perfectly assessed. Comparisons of the FluoroProbe® dataset against HPLC analyses may sometimes be skewed by the non-specificity of some pigments for phytoplankton taxonomic compositions (Richardson et al.2010). For example, phycoerythrin-rich cyanobacteria are combined with red algae and this leads to weak correlations when comparing results pro-vided by these two methods (Beutler et al. 2002; Echenique-Subiabre et al. 2016). On another note, FluoroProbe® factory calibration may identify haptophytes as mixtures of brown algae and green algae (See et al.2005; MacIntyre et al.2010; Richardson et al.
2010; Houliez et al.2012). However, haptophytes never constitute significant populations within Mediterranean coastal lagoons (cf. Fig. 5 in Leruste et al.2016), and noticeably in the Biguglia lagoon (Leruste et al.2019) where this potential bias remains thus negligible.
Conclusions
In Mediterranean coastal ecosystem, FluoroProbe® provided very good estimates of phytoplankton total biomass and good indications of phytoplankton com-munity composition, after the removal of outliers. Therefore, it can be used to obtain information for water management in a timely manner. A clear advan-tage offered by this instrument is the ability to differ-entiate phytoplankton assemblages into broad groups, thus making FluoroProbe® suitable for large-scale surveys of lagoon environments using simply the fac-tory calibrations. FluoroProbe® could be a useful phytoplankton monitoring tool, especially as an early warning system for the detection of harmful algal blooms in lagoon waters that constitute an increasing threat to Mediterranean transitional ecosystems (see Fig. 1 in Cecchi et al.2016). FluoroProbe® could be used for the long-term monitoring of phytoplankton communities as required by the EU-WFD, because it offers higher temporal resolution than the classical HPLC analysis, in real-time and at far lower cost, with a rapid non-destructive measure of their relative abun-dance. This is a major advantage given the amount of time and expertise required for the microscopy and
HPLC analyses. The limited information obtained for some groups (particularly, cyanobacteria) suggests that FluoroProbe® should be coupled with other methods to strengthen the precision and quality of the observations. Specific calibrations will undoubt-edly increase FluoroProbe® diagnostic performances; however, we strongly recommended complementing FluoroProbe® measurements with less frequent sam-ple collections for microscopic analyses to accurately identify the phytoplankton taxa involved in the spatial-temporal dynamics. Ultimately, users need to determine whether FluoroProbe® inherent error is acceptable for their type of research or monitoring (Kring et al. 2014).
Acknowledgements The authors would like to thank the two anonymous reviewers for their constructive comments that im-proved our manuscript.
Funding information This study was supported by funding from the French Government and from the Corsican Regional Council. MG was awarded a grant from the Collectivité Territoriale de Corse and the Université de Corse.
References
Agawin, N. S. R., Duarte, C. M., & Agusti, S. (1998). Growth and
abundance of Synechococcus sp. in a Mediterranean Bay: seasonality and relationship with temperature. Marine Ecology Progress Series, 170, 45–53.
Álvarez, E., López-Urrutia, Á., Nogueira, E., & Fraga, S. (2011). How to effectively sample the plankton size spectrum? A case study using FlowCAM. Journal of Plankton Research, 33, 1119–1133.
Álvarez, E., Moyano, M., López-Urrutia, Á., Nogueira, E., & Scharek, R. (2014). Routine determination of plankton com-munity composition and size structure: a comparison be-tween FlowCAM and light microscopy. Journal of Plankton Research, 36(1), 170–184.
Aminot, A., & Kérouel, R. (2007). Dosage automatique des nutriments dans les eaux marines: Méthodes en flux continu. Paris: IFREMER.
Armi, Z., Trabelsi, E., Turki, S., Béjaoui, B., & Ben-Maïz, N. (2010). Seasonal phytoplankton responses to environmental
factors in a shallow Mediterranean lagoon. Journal of Marine Science and Technology, 15, 417–426.
Ayadi, H., Abid, O., Elloumi, J., Nouai, A., & Sime-Ngando, T. (2004). Structure of the phytoplankton communities in two lagoons of different salinity in the Sfax saltern (Tunisia). Journal of Plankton Research, 26(6), 669–679.
Bec, B., Husseini-Ratrema, J., Collos, Y., Souchu, P., & Vaquer, A. (2005). Phytoplankton seasonal dynamics in a Mediterranean coastal lagoon: emphasis on the picoeukaryote community. Journal of Plankton Research, 27(9), 881–894.
Bec, B., Collos, Y., Souchu, P., Vaquer, A., Lautier, J., Fiandrino, A., Benau, L., Orsoni, V., & Laugier, T. (2011). Distribution of picophytoplankton and nanophytoplankton along an an-thropogenic eutrophication gradient in French Mediterranean coastal lagoons. Aquatic Microbial Ecology, 63, 29–45. Bel-Hassen, M., Hamza, A., Drira, Z., Zouari, A., Akrout, F.,
Messaoudi, S., Aleya, L., & Ay adi, H. (2009). Phytoplankton-pigment signatures and their relationship to spring–summer stratification in the Gulf of Gabes. Estuarine, Coastal and Shelf Science, 83, 296–306.
Beutler, M., Wilshire, K. H., Meyer, B., Moldaenke, C., Lüring, C., Meyerhöfer, M., Hansen, H. P., & Dau, H. (2002). A fluorometric method for the differentiation of algal popula-tions in vivo and in situ. Photosynthesis Research, 72, 39–53. Blottière, L., Jaffar-Bandjee, M., Jacquet, S., Millot, A., & Hulot, F. D. (2017). Effects of mixing on the pelagic food web in shallow lakes. Freshwater Biology, 62, 161–177.
Bradie, J., Broeg, K., Gianoli, C., He, J., Heitmüller, S., Lo Curto, A., Nakata, A., Rolke, M., Schillak, L., Stehouwer, P., Vanden Byllaardt, J., Veldhuis, M., Welschmeyer, N., Younan, L., Zaake, A., & Bailey, S. (2018). A shipboard comparison of analytic methods for ballast water compliance monitoring. Journal of Sea Research, 133, 11–19.
Carić, M., Jasprica, N., Čalić, M., & Batistić, M. (2011). Phytoplankton response to high salinity and nutrient limita-tion in the eastern Adriatic marine lakes. Sciencia Marina, 75(3), 493–505.
Catherine, A., Escoffier, N., Belhocine, A., Nasri, A. B., Hamlaoui, S., Yéprémian, C., Bernard, C., & Troussellier, M. (2012). On the use of the FluoroProbe®, a phytoplankton quantification method based on fluorescence excitation spec-tra for large-scale surveys of lakes and reservoirs. Water Research, 46(6), 1771–1784.
Catherine, A., Selma, M., Mouillot, D., Troussellier, M., & Bernard, C. (2016). Patterns and multi-scale drivers of phy-toplankton species richness in temperate peri-urban lakes. Science of the Total Environment, 559, 74–83.
Cecchi, P., Garrido, M., Collos, Y., & Pasqualini, V. (2016). Water flux management and phytoplankton communities in a Mediterranean coastal lagoon. Part II: mixotrophy of dino-flagellates as an adaptive strategy? Marine Pollution Bulletin, 108, 120–133.
CEN EN 15204. (2006). Water quality– Guidance standard on the enumeration of phytoplankton using inverted microscope (Utermöhl Technique). Brussels: European Committee for Standardization.
Chomérat, N., Garnier, R., Bertrand, C., & Cazaubon, A. (2007). Seasonal succession of cyanoprokaryotes in a hypereutrophic oligo-mesohaline lagoon from the south of France. Estuarine, Coastal and Shelf Science, 72, 591–602.
Chorus, I., & Bartram, J. (1999). Toxic cyanobacteria in water. A guide to their public health consequences, monitoring and management. Rome: World Health Organization.
Collos, Y., Gagne, C., Laabir, M., Vaquer, A., Cecchi, P., & Souchu, P. (2004). Nitrogenous nutrition of Alexandrium catenella (Dinophyceae) in cultures and in Thau lagoon, southern France. Journal of Phycology, 40, 96–103. Cyr, H. (2017). Winds and the distribution of nearshore
phyto-plankton in a stratified lake. Water Research, 122, 114–127. Derolez, V., Bec, B., Munaron, D., Fiandrino, A., Pete, R., Simier, M., Souchu, P., Laugier, T., Aliaume, C., & Malet, N. (2019). Recovery trajectories following the reduction of urban nutri-ent inputs along the eutrophication gradinutri-ent in French Mediterranean lagoons. Ocean and Coastal Management, 171, 1–10.
Echenique-Subiabre, I., Dalle, C., Duval, C., Heath, M. W., Couté, A., Wood, S. A., Humbert, J. F., & Quiblier, C. (2016). Application of a spectrofluorimetric tool (bbe BenthoTorch) for monitoring potentially toxic benthic cyanobacteria in rivers. Water Research, 101, 341–350.
Eckford-Soper, L., Daugbjerg, N., Nørremark, L., & Engell-Sørensen, K. (2018). Comparison by light microscopy and qPCR of potentially ichthyotoxic microalgae in Danish on-shore lagoons producing European flounder (Platichthys flesus): pros and cons of microscopical and molecular methods. Harmful Algae News, 59, 24–27.
Escoffier, N., Bernard, C., Hamlaoui, S., Groleau, A., & Catherine, A. (2015). Quantifying phytoplankton communities using spectral fluorescence: the effects of species composition and physiological state. Journal of Plankton Research, 37(1), 233–247.
Flo, E., Garcés, E., Manzanera, M., & Camp, J. (2011). Coastal inshore waters in the NW Mediterranean: physicochemical and biological characterization and management implica-tions. Estuarine Coastal and Shelf Science, 93, 279–289. Garrido, M., Cecchi, P., Vaquer, A., & Pasqualini, V. (2013).
Effects of samples conservation on photosynthetic efficiency assessment of phytoplankton using PAM fluorometry. Deep Sea Research, Part I, 71, 38–48.
Garrido, M., Cecchi, P., Collos, Y., Agostini, S., & Pasqualini, V. (2016). Water flux management and phytoplankton commu-nities in a Mediterranean coastal lagoon. Part I: how to promote dinoflagellate dominance? Marine Pollution Bulletin, 104, 139–152.
Giling, D. P., Nejstgaard, J. C., Berger, S. A., Grossart, H.-P., Kirillin, G., Penske, A., Lentz, M., Casper, P., Sareyka, J., & Gessner, M. O. (2017). Thermocline deepening boosts ecosystem metabolism: evidence from a large-scale lake enclosure experiment simulating a summer storm. Global Change Biology, 23, 1448–1462.
Giovanardi, F., Francé, J., Mozetič, P., & Precali, R. (2018). Development of ecological classification criteria for the bio-logical quality element phytoplankton for Adriatic and Tyrrhenian coastal waters by means of chlorophyll a (2000/60/EC WFD). Ecological Indicators, 93, 316–332. Glibert, P. M. (2017). Eutrophication, harmful algae and
biodiver-sity– challenging paradigms in a world of complex nutrient changes. Marine Pollution Bulletin, 124(2), 591–606. Glibert, P. M., & Burford, M. A. (2017). Globally changing
new paradigms, and continuing challenges. Oceanography, 30(1), 58–69.
Gordon, N., Perissinotto, R., & Miranda, N. A. F. (2016). Microalgal dynamics in a shallow estuarine lake: transition from drought to wet conditions. Limnologica, 60, 20–30. Gregor, J., & Maršálek, B. (2004). Freshwater phytoplankton
quantification by chlorophyll a: a comparative study of in vitro, in vivo and in situ methods. Water Research, 38, 517–522.
Gregor, J., Geriš, R., Maršálek, B., Heteša, J., & Marvan, P. (2005). In situ quantification of phytoplankton in reservoirs using a submersible spectrofluorometer. Hydrobiologia, 548(1), 141–151.
Grzebyk, D., Audic, S., Lasserre, B., Abadie, E., de Vargas, C., & Bec, B. (2017). Insights into the harmful algal flora in north-western Mediterranean coastal lagoons revealed by pyrose-quencing metabarcodes of the 28S rRNA gene. Harmful Algae, 68, 1–16.
Harrison, J. W., Howell, E. T., Watson, S. B., & Smith, R. E. H. (2016). Improved estimates of phytoplankton community composition based on in situ spectral fluorescence: use of ordination and field-derived norm spectra for the bbe FluoroProbe. Canadian Journal of Fisheries and Aquatic Sciences, 73, 1472–1482.
Havskum, H., Schlüter, L., Scharek, R., Berdalet, E., & Jacquet, S. (2004). Routine quantification of phytoplankton groups– microscopy or pigment analyses? Marine Ecology Progress Series, 273, 31–42.
Heisler, J., Glibert, P. M., Burkholder, J. M., Anderson, D. M., Cochlan, W., Dennison, W. C., Dortch, Q., Gobler, C. J., Heil, C. A., Humphries, E., Lewitus, A., Magnien, R., Marshallm, H. G., Sellner, K., Stockwell, D. A., Stoecker, D. K., & Suddleson, M. (2008). Eutrophication and harmful algal blooms: a scientific consensus. Harmful Algae, 8, 3–13. Hering, D., Borja, A., Jones, J. I., Pont, D., Boets, P., Bouchez, A., Bruce, K., Drakare, S., Hänfling, B., Kahlert, M., Leese, F., Meissner, K., Mergen, P., Reyjol, Y., Segurado, P., Vogler, A., & Kelly, M. (2018). Implementation options for DNA-based identification into ecological status assessment under the European water framework directive. Water Research, 138, 192–205.
Holmes, R. M., Aminot, A., Kérouel, R., Hooker, B. A., & Peterson, B. J. (1999). A simple and precise method of measuring ammonium in marine and freshwater ecosystems. Canadian Journal of Fisheries and Aquatic Sciences, 56, 1801–1808.
Houliez, E., Lizon, F., Thyssen, M., Artigas, F. L., & Schmitt, F. G. (2012). Spectral fluorometric characterization of haptophyte dynamics using the FluoroProbe: an application in the eastern English Channel for monitoring Phaeocystis globosa. Journal of Plankton Research, 34(2), 136–151.
Houliez, E., Lefebvre, S., Lizon, F., & Schmitt, F. G. (2017). Rapid light curves (RLC) or non-sequential steady-state light curves (N-SSLC): which fluorescence-based light response curve methodology robustly characterizes phytoplankton photo-synthetic activity and acclimation status? Marine Biology, 164, 175.
Jacquet, S., Lennon, J. F., Marie, D., & Vaulot, D. (1998). Picoplankton population dynamics in coastal waters of the northwestern Mediterranean Sea. Limnology and Oceanography, 43(8), 1916–1931.
Johnsen, G., & Sakshaug, E. (2007). Biooptical characteristics of PSII and PSI in 33 species (13 pigment groups) of marine phytoplankton, and the relevance for pulse-amplitude-modulated and fast-repetition-rate fluorometry. Journal of Phycology, 43(6), 1236–1251.
Justic, D., Rabalais, N. N., & Turner, R. E. (1995). Stoichiometric nutrient balance and origin of coastal eutrophication. Marine Pollution Bulletin, 30, 41–46.
Karpowicz, M., & Ejsmont-Karabin, J. (2017). Effect of metalimnetic gradient on phytoplankton and zooplankton (Rotifera, Crustacea) communities in different trophic condi-tions. Environmental Monitoring and Assessment, 189, 367. Kirk, J. T. O. (2011). Light and photosynthesis in aquatic
ecosys-tems (3rd ed.). Cambridge: Cambridge University Press. Kring, S. A., Figary, S. E., Boyer, G. L., Watson, S. B., & Twiss,
M. R. (2014). Rapid in situ measures of phytoplankton communities using the bbe FluoroProbe: evaluation of spec-tral calibration, instrument intercompatibility, and perfor-mance range. Canadian Journal of Fisheries and Aquatic Sciences, 71, 1087–1095.
Lawrenz, E., Pinckney, J. L., Ranhofer, M. L., MacIntyre, H. L., & Richardson, T. L. (2010). Spectral irradiance and phytoplank-ton community composition in a Blackwater-dominated es-tuary, Winyah Bay, South Carolina, USA. Estuaries and Coasts, 33, 1186–1201.
Le Fur, I., De Wit, R., Plus, M., Oheix, J., Simier, M., & Ouisse, V. (2018). Submerged benthic macrophytes in Mediterranean lagoons: distribution patterns in relation to water chemistry and depth. Hydrobiologia, 808, 175–200.
Leboulanger, C., Dorigo, U., Jacquet, S., Le Berre, B., Paolini, G., & Humbert, J. F. (2002). Application of a submersible spec-trofluorometer for rapid monitoring of freshwater cyanobacterial blooms: a case study. Aquatic Microbial Ecology, 30, 83–89.
Leruste, A., Hatey, E., Bec, B., & De Wit, R. (2015). Selecting an HPLC method for chemotaxonomic analysis of phytoplank-ton community in Mediterranean coastal lagoons. Transitional Waters Bulletin, 9(1), 20–41.
Leruste, A., Malet, N., Munaron, D., Derolez, V., Hatey, E., Collos, Y., De Wit, R., & Bec, B. (2016). First steps of ecological restoration in Mediterranean lagoons: shifts in phytoplankton communities. Estuarine, Coastal and Shelf Science, 180, 190–203.
Leruste, A., Pasqualini, V., Garrido, M., Malet, N., De Wit, R., & Bec, B. (2019). Physiological and behavioral responses of phytoplankton communities to nutrient availability in a dis-turbed Mediterranean coastal lagoon. Estuarine, Coastal and Shelf Science, 219, 176–188.
Liu, X., Huang, B., Liu, Z., Wang, L., Wei, H., Li, C., & Huang, Q. (2012). High-resolution phytoplankton diel variations in the summer stratified Central Yellow Sea. Journal of Oceanography, 68, 913–927.
MacIntyre, H. L., Lawrenz, E., & Richardson, T. L. (2010). Taxonomic discrimination of phytoplankton by spectral fluo-rescence. In D. J. Suggett et al. (Eds.), Chlorophyll a fluores-cence in aquatic sciences: methods and applications. Developments in applied phycology 4 (pp. 129–169). New York: Springer Science.
Maloufi, S., Catherine, A., Mouillot, D., Louvard, C., Couté, A., Bernard, C., & Troussellier, M. (2016). Environmental het-erogeneity among lakes promotes hyperβ-diversity across
phytoplankton communities. Freshwater Biology, 61, 633– 645.
Marie, D., Partensky, F., Jacquet, S., & Vaulot, D. (1997). Enumeration and cell cycle analysis of natural populations of marine picoplankton by flow cytometry using the nucleic acid stain SYBR green-I. Applied and Environmental Microbiology, 93, 186–193.
Marty, J. C., Garcia, N., & Raimbault, P. (2008). Phytoplankton dynamics and primary production under late summer condi-tions in the NW Mediterranean Sea. Deep Sea Research, Part I, 55, 1131–1149.
Morgan-Kiss, R. M., Lizotte, M. P., Kong, W., & Priscu, J. C. (2016). Photoadaptation to the polar night by phytoplankton in a permanently ice-covered Antarctic lake. Limnology and Oceanography, 61, 3–13.
Neveux, J., & Lantoine, F. (1993). Spectrofluorometric assay of chlorophylls and phaeopigments using the least squares ap-proximation technique. Deep Sea Research, 40, 1747–1765. Nixon, S. W. (1995). Coastal marine eutrophication: a definition, social causes, and future concerns. Ophelia, 41, 199–219. Ostrowska, M., Stoń-Egiert, J., & Woźniak, B. (2015). Modified
methods for defining the chlorophyll concentration in the sea using submersible fluorimeters– Theoretical and quantitative analysis. Continental Shelf Research, 109, 46–54.
Pasqualini, V., Derolez, V., Garrido, M., Orsoni, V., Baldi, Y., Etourneau, S., Leoni, V., Laugier, T., Souchu, P., & Malet, N. (2017). Spatiotemporal dynamics of submerged macro-phyte status and watershed exploitation in a Mediterranean coastal lagoon: understanding critical factors in ecosystem degradation and restoration. Ecological Engineering, 102, 1– 14.
Patidar, S. K., Chokshi, K., George, B., Bhattacharya, S., & Mishra, S. (2015). Dominance of cyanobacterial and cryptophytic assemblage correlated to CDOM at heavy metal contamination sites of Gujarat, India. Environmental Monitoring and Assessment, 187, 4118.
Platt, T., & Denman, K. (1980). Patchiness in phytoplankton distribution. In I. Morris (Ed.), The ecology of phytoplankton (pp. 413–431). Oxford: Blackwell Scientific Publications. Poxleitner, M., Trommer, G., Lorrenz, P., & Stibor, H. (2016). The
effect of increased nitrogen load on phytoplankton in a phosphorus-limited lake. Freshwater Biology, 61, 1966– 1980.
Pulina, S., Padedda, B. M., Sechi, N., & Lugliè, A. (2011). The d o m i n a n c e o f c y a n o b a c t e r i a i n M e d i t e r r a n e a n hypereutrophic lagoons: a case study of Cabras lagoon (Sardinia, Italy). Scientia Marina, 75(1), 111–120. R Core Team. (2015). A language and environment for statistical
computing. In R Foundation for statistical computing. Vienna: URLhttp://www.R-project.org/.
Raimbault, P., Pouvesle, W., Diaz, F., Garcia, N., & Sempere, R. (1999). Wet-oxidation and automated colorimetry for simul-taneous determination of organic carbon, nitrogen and phos-phorus dissolved in seawater. Marine Chemistry, 66, 161– 169.
Richardson, T. L., Lawrenz, E., Pinckney, J. L., Guajardo, R. C., Walker, E. A., Paerl, H. W., & MacIntyre, H. L. (2010). Spectral fluorometric characterization of phytoplankton com-munity composition using the algae online Analyser. Water Research, 44, 2461–2472.
Rivera, S. F., Vasselon, V., Jacquet, S., Bouchez, A., Ariztegui, D., & Rimet, F. (2018). Metabarcoding of lake benthic diatoms: From structure assemblages to ecological assessment. Hydrobiologia, 807, 37–51.
Rolland, A., Rimet, F., & Jacquet, S. (2010). A 2-year survey of phytoplankton in the Marne reservoir (France): a case study to validate the use of an in situ spectrofluorometer by com-parison with algal taxonomy and chlorophyll a measure-ments. Knowledge and Management of Aquatic Ecosystems, 398, 02.
Romero-Martínez, L., Van Slooten, C., Nebot, E., Acevedo-Merino, A., & Peperzak, L. (2017). Assessment of imaging-in-flow system (FlowCAM) for systematic ballast water management. Science of the Total Environment, 603– 604, 550–561.
Roy, S., Llewellyn, C., Egeland, E. S., & Johnsen, G. (2011). Phytoplankton pigments: Characterization, chemotaxonomy and applications in oceanography. Cambridge: Cambridge University Press.
Schlüter, L., Møhlenberg, F., & Kaas, H. (2014). Temporal and spatial variability of phytoplankton monitored by a combina-tion of monitoring buoys, pigment analysis and fast screening microscopy in the Fehmarn Belt estuary. Environmental Monitoring and Assessment, 186, 5167–5184.
See, J. H., Campbell, L., Richardson, T. L., Pinckney, J. L., Shen, R., & Guinasso, N. L., Jr. (2005). Combining new technolo-gies for determination of phytoplankton community structure in the northern Gulf of Mexico. Journal of Phycology, 41, 305–310.
Silva, T., Giani, A., Figueredo, C., Viana, P., Khac, V. T., Lemaire, B. J., Tassin, B., Nascimento, N., & Vinçon-Leite, B. (2016). Comparison of cyanobacteria monitoring methods in a trop-ical reservoir by in vivo and in situ spectrofluorometry. Ecological Engineering, 97, 79–87.
Smayda, T. J. (2008). Complexity in the eutrophication-harmful algal bloom relationship, with comment on the importance of grazing. Harmful Algae, 8, 140–151.
Souchu, P., Bec, B., Smith, V. H., Laugier, T., Fiandrino, A., Benau, L., Orsoni, V., Collos, Y., & Vaquer, A. (2010). Patterns in nutrient limitation and chlorophyll a along an anthropogenic eutrophication gradient in French Mediterranean coastal lagoons. Canadian Journal of Fisheries and Aquatic Sciences, 67, 743–753.
Spatharis, S., Tsirtsis, G., Danielidis, D., Do Chi, T., & Mouillot, D. (2007). Effects of pulsed nutrient inputs on phytoplankton assemblage structure and blooms in an enclosed coastal area. Estuarine, Coastal and Shelf Science, 73, 807–815. Švanys, A., Paškauskas, R., & Hilt, S. (2014). Effects of the
allelopathically active macrophyte Myriophyllum spicatum on a natural phytoplankton community: a mesocosm study. Hydrobiologia, 737, 57–66.
Teufel, A. G., Li, W., Kiss, A. J., & Morgan-Kiss, R. M. (2017). Impact of nitrogen and phosphorus on phytoplankton pro-duction and bacterial community structure in two stratified Antarctic lakes: a bioassay approach. Polar Biology, 40, 1007–1022.
Therriault, J. C., & Platt, T. (1981). Environmental control of phytoplankton patchiness. Canadian Journal of Fisheries and Aquatic Sciences, 38(6), 638–641.
Twiss, M. R. (2011). Variations in chromophoric dissolved organic matter and its influence on the use of pigment-specific
fluorimeters in the Great Lakes. Journal of Great Lakes Research, 37(1), 124–131.
Utermöhl, H. (1958). Zur Vervollkommnung der quantitativen phytoplankton-Methodik. Mitteilungen der Internationale Vereinigung für theoretische und angewandte Limnologie, 9, 1–38.
Van Beusekom, J. E. E., Mengedoht, D., Augustin, C. B., Schilling, M., & Boersma, M. (2009). Phytoplankton, protozooplankton and nutrient dynamics in the Bornholm Basin (Baltic Sea) in 2002–2003 during the German GLOBEC project. International Journal of Earth Sciences, 98, 251–260.
Vidussi, F., Claustre, H., Manca, B. B., Luchetta, A., & Marty, J. C. (2001). Phytoplankton pigment distribution in relation to upper thermocline circulation in the eastern Mediterranean Sea during winter. Journal of Geophysical Research, 106, 19939–19956.
Viličić, D., Legović, T., & Žutić, V. (1989). Vertical distribution of phytoplankton in a stratified estuary. Aquatic Sciences, 51(1), 31–46.
Vuorio, K., Lepistö, L., & Holopainen, A. L. (2007). Intercalibrations of freshwater phytoplankton analyses. Boreal Environment Research, 12, 561–569.
Wang, Y. K., Chen, P. Y., Dahms, H. U., Yeh, S. L., & Chiu, Y. J. (2016). Comparing methods for measuring phytoplankton biomass in aquaculture ponds. Aquaculture Environment Interactions, 8, 665–673.
Wright, S. W., & Jeffrey, S. W. (1997). High-resolution HPLC system for chlorophylls and carotenoids of marine phyto-plankton. In S. W. Jeffrey, R. F. C. Mantoura, & S. W. Wright (Eds.), Phytoplankton pigments in oceanography: Guidelines to modern methods (pp. 327–360). Paris: UNESCO.
Zamyadi, A., Choo, F., Newcombe, G., Stuetz, R., & Henderson, R. K. (2016). A review of monitoring technologies for real-time management of cyanobacteria: Recent advances and future direction. Trends in Analytical Chemistry, 85, 83–96.