HAL Id: hal-02559414
https://hal.archives-ouvertes.fr/hal-02559414
Submitted on 30 Oct 2020
HAL is a multi-disciplinary open access
archive for the deposit and dissemination of
sci-entific research documents, whether they are
pub-lished or not. The documents may come from
teaching and research institutions in France or
abroad, or from public or private research centers.
L’archive ouverte pluridisciplinaire HAL, est
destinée au dépôt et à la diffusion de documents
scientifiques de niveau recherche, publiés ou non,
émanant des établissements d’enseignement et de
recherche français ou étrangers, des laboratoires
publics ou privés.
area of the Southern Ocean based on the 234Th
approach
Frédéric Planchon, D. Ballas, A.-J. Cavagna, A. R. Bowie, D. Davies, T.
Trull, E. C. Laurenceau-Cornec, P. van der Merwe, F. Dehairs
To cite this version:
Frédéric Planchon, D. Ballas, A.-J. Cavagna, A. R. Bowie, D. Davies, et al.. Carbon export in
the naturally iron-fertilized Kerguelen area of the Southern Ocean based on the 234Th approach.
Biogeosciences, European Geosciences Union, 2015, 12 (12), pp.3831-3848. �10.5194/bg-12-3831-2015�.
�hal-02559414�
www.biogeosciences.net/12/3831/2015/ doi:10.5194/bg-12-3831-2015
© Author(s) 2015. CC Attribution 3.0 License.
Carbon export in the naturally iron-fertilized Kerguelen area of
the Southern Ocean based on the
234
Th approach
F. Planchon1, D. Ballas2, A.-J. Cavagna2, A. R. Bowie3,4, D. Davies4, T. Trull3,4,5, E. C. Laurenceau-Cornec3,4,5, P. Van Der Merwe4, and F. Dehairs2
1Laboratoire des Sciences de l’Environnement Marin (LEMAR), Université de Bretagne Occidentale, CNRS, IRD, UMR
6539, IUEM; Technopôle Brest Iroise, Place Nicolas Copernic, 29280 Plouzané, France
2Vrije Universiteit Brussel, Analytical, Environmental and Geo-Chemistry and Earth System Sciences, Brussels, Belgium
3Institute for Marine and Antarctic Studies, University of Tasmania, Hobart, 7001, Australia
4Antarctic Climate and Ecosystems Cooperative Research Centre, Hobart, 7001, Australia
5CSIRO Marine and Atmospheric Research, Hobart, 7001, Australia
Correspondence to: F. Planchon (frederic.planchon@univ-brest.fr)
Received: 3 October 2014 – Published in Biogeosciences Discuss.: 25 November 2014 Revised: 30 March 2015 – Accepted: 16 April 2015 – Published: 23 June 2015
Abstract. This study examined upper-ocean particulate
or-ganic carbon (POC) export using the234Th approach as part
of the second KErguelen Ocean and Plateau compared Study expedition (KEOPS2). Our aim was to characterize the spa-tial and the temporal variability of POC export during austral spring (October–November 2011) in the Fe-fertilized area of the Kerguelen Plateau region. POC export fluxes were es-timated at high productivity sites over and downstream of the plateau and compared to a high-nutrient low-chlorophyll (HNLC) area upstream of the plateau in order to assess the impact of iron-induced productivity on the vertical export of carbon.
Deficits in 234Th activities were observed at all stations in surface waters, indicating early scavenging by particles
in austral spring. 234Th export was lowest at the reference
station R-2 and highest in the recirculation region (E sta-tions) where a pseudo-Lagrangian survey was conducted. In
comparison234Th export over the central plateau and north
of the polar front (PF) was relatively limited throughout the survey. However, the234Th results support that Fe fertiliza-tion increased particle export in all iron-fertilized waters. The impact was greatest in the recirculation feature (3–4 fold at 200 m depth, relative to the reference station), but more mod-erate over the central Kerguelen Plateau and in the northern plume of the Kerguelen bloom (∼ 2-fold at 200 m depth).
The C : Th ratio of large (> 53 µm) potentially sinking par-ticles collected via sequential filtration using in situ pumping
(ISP) systems was used to convert the234Th flux into a POC
export flux. The C : Th ratios of sinking particles were highly variable (3.1 ± 0.1 to 10.5 ± 0.2 µmol dpm−1) with no clear site-related trend, despite the variety of ecosystem responses in the fertilized regions. C : Th ratios showed a decreasing trend between 100 and 200 m depth suggesting preferential
carbon loss relative to 234Th possibly due to heterotrophic
degradation and/or grazing activity. C : Th ratios of sinking particles sampled with drifting sediment traps in most cases showed very good agreement with ratios for particles col-lected via ISP deployments (> 53 µm particles).
Carbon export production varied between 3.5 ± 0.9 and
11.8 ± 1.3 mmol m−2d−1from the upper 100 m and between
1.8 ± 0.9 and 8.2 ± 0.9 mmol m−2d−1from the upper 200 m. The highest export production was found inside the PF me-ander with a range of 5.3 ± 1.0 to 11.8 ± 1.1 mmol m−2d−1 over the 19-day survey period. The impact of Fe fertilization is highest inside the PF meander with 2.9–4.5-fold higher carbon flux at 200 m depth in comparison to the HNLC con-trol station. The impact of Fe fertilization was significantly less over the central plateau (stations A3 and E-4W) and in the northern branch of the bloom (station F-L) with 1.6–2.0-fold higher carbon flux compared to the reference station R. Export efficiencies (ratio of export to primary production and ratio of export to new production) were particularly variable with relatively high values in the recirculation feature (6 to 27 %, respectively) and low values (1 to 5 %, respectively)
over the central plateau (station A3) and north of the PF (sta-tion F-L), indicating spring biomass accumula(sta-tion. Compar-ison with KEOPS1 results indicated that carbon export pro-duction is much lower during the onset of the bloom in aus-tral spring than during the peak and declining phases in late summer.
1 Introduction
Nutrient limitation is an essential control of upper-ocean pro-ductivity (Moore et al., 2013) and affects the associated up-take of carbon and its transfer to the deep ocean as sink-ing particulate organic matter. Attention has focused on iron (Fe) as a limiting nutrient since the iron hypothesis of Mar-tin (1990), who suggested that increased iron supply to the Southern Ocean (SO) during the last glacial maximum could
have contributed to the drawdown of atmospheric CO2 by
stimulating the oceanic biological pump. For the present-day ocean, iron limitation is now validated for several high-nutrient low-chlorophyll (HNLC) regions, including the SO (Boyd et al., 2000, 2007; Coale et al., 2004; Martin et al., 1990, 1991; Sedwick et al., 1999; Smetacek et al., 2012). However, it is still under debate whether the positive growth response of phytoplankton due to iron addition results in en-hanced export of biogenic particles and contributes to the long-term sequestration of carbon. This remains central to understanding the role of iron on the oceanic carbon cycle and ultimately on the past and future climate of the Earth.
Mesoscale iron addition experiments have revealed no clear trend in carbon export. Export fluxes estimated dur-ing Southern Ocean Iron RElease Experiment (SOIREE; po-lar waters south of Australia), the SOLAS air-sea gas ex-change experiment (SAGE; subpolar waters south of New Zealand), European Iron Enrichment Experiment in the Southern Ocean (EisenEx; Atlantic polar waters) and Indo-German iron fertilization experiment (LOHAFEX; South At-lantic waters) report no major differences between the Fe-fertilized patch and the adjacent control site (Buesseler et al., 2005, 2004; Martin et al., 2013; Nodder et al., 2001). By contrast, the experiments SOFEX-South (polar waters south of New Zealand) and EIFEX (Atlantic polar waters south of Africa) showed increased vertical flux of particulate organic carbon (POC) due to iron addition (Buesseler et al., 2005; Jacquet et al., 2008; Smetacek et al., 2012). Enhanced export appears associated with experiments carried out (1) in high silicic acid waters south of the Antarctic polar front (PF) al-lowing fast-sinking, large diatoms to develop under low graz-ing pressure and (2) over a survey period sufficiently long to cover the time lag between the bloom development and the export event. However, the key results obtained with pur-poseful iron addition still differ and are difficult to scale up to regional and seasonal scales (Boyd et al., 2007).
Alternatives to short-term artificial experiments are the large and persistent phytoplankton blooms that develop an-nually in the vicinity of sub-Antarctic islands (Blain et al., 2007; Borrione and Schlitzer, 2013; Morris and Charette, 2013; Pollard et al., 2009) and close to the Antarctic con-tinent (Alderkamp et al., 2012; Zhou et al., 2013) due to natural iron supply. These particular settings represent large-scale natural laboratories, where the role of Fe on ecosystems ecology, productivity, structure, and associated export can be monitored over an entire seasonal cycle. Two previous im-portant field studies were carried out in natural Fe-fertilized areas: the CROZet natural iron bloom and EXport exper-iment (CROZEX, 2004–2005) (Pollard et al., 2009), and the KErguelen Ocean and Plateau compared study (KEOPS, 2005) (Blain et al., 2007). CROZEX studied the Crozet Is-lands region located in the sub-Antarctic waters of the Indian Ocean where a bloom occurs north of the islands in Octo-ber/November followed by a secondary bloom in January. CROZEX results confirmed that the bloom is fueled with iron from Crozet Island (Planquette et al., 2007) and that phyto-plankton uptake rates are much larger in the bloom area than in the HNLC control area (Lucas et al., 2007; Seeyave et al., 2007). For carbon export, the primary bloom results in a ∼ 3-fold higher flux at the Fe-fertilized site than at the control site, and for the secondary bloom, no substantial differences are reported (Morris et al., 2007). Sinking particles collected by a neutrally buoyant sediment trap (PELAGRA) were dom-inated by diatom cells of various species and size indicating a pronounced contribution of primary producers to the export (Salter et al., 2007).
The second study (KEOPS) focused on the high produc-tivity area of the Kerguelen Islands in the Indian sector of the SO. The Kerguelen bloom has two main features, a north-ern branch that extends northeast of the islands north of the PF (also called the plume), and a larger bloom
cover-ing ∼ 45 000 km2south of the PF and largely constrained to
the shallow bathymetry of the Kerguelen Plateau (< 1000m) (Mongin et al., 2008). In austral summer 2004–2005, the bloom started in early November, peaked in December and January, and then rapidly declined in February (Blain et al., 2007). Fe fertilization over the plateau was demonstrated during KEOPS and attributed to vertical exchanges between the surface and the deep iron-rich reservoir existing above the plateau (Blain et al., 2008). The waters in the bloom showed higher biomass, greater silicate depletion, and important CO2
drawdown compared to the control site (Blain et al., 2007; Jouandet et al., 2008; Mosseri et al., 2008). Carbon export in the Fe-fertilized area in comparison to HNLC waters was
2-fold higher as estimated using the234Th proxy (Savoye et
al., 2008), and 3-fold higher based on a seasonal dissolved inorganic carbon (DIC) budget (Jouandet et al., 2008). Di-rect observations of sinking particles using polyacrylamide gel traps indicates a dominant fraction of fecal pellets and fecal aggregates and suggests a strong influence of particle repackaging by grazers during the late stage of the
Kergue-len bloom (Ebersbach and Trull, 2008). The unprecedented results obtained from CROZEX and KEOPS clearly high-light the crucial role of Fe in natural ecosystems and demon-strate the stimulation of the biological carbon pump in the
SO resulting in an enhanced CO2sink and carbon export at
depth.
The KEOPS2 project was designed to improve the spa-tial and temporal coverage of the Kerguelen region. KEOPS2 was carried out in austral spring to document the early stages of the bloom and to complement results of KEOPS1 obtained in summer during the peak and decline of the bloom. The principal aims were to better constrain the mechanism of Fe supply to surface waters and to determine the response of ecosystems to Fe fertilization including the impact on verti-cal export of carbon. The sampling strategy covered two dis-tinct areas: the principal bloom already investigated during KEOPS1 and located over the central plateau, and the plume downstream to the east of the islands and north of the PF.
In this study, we report upper-ocean POC export
produc-tion estimated using the234Th-based approach (Cochran and
Masqué, 2003). POC fluxes at 100, 150, and 200 m depth
were inferred from total234Th export fluxes estimated from
234Th deficit in surface waters by applying the modeling
ap-proach of Savoye et al. (2006) for the234Th activity balance.
234Th export fluxes were then converted into POC fluxes
us-ing POC /234Th ratio of large (> 53 µm) potentially sinking particles at the depth of export. Upper-ocean234Th and car-bon export obtained in HNLC and Fe-enriched waters were used to assess the impact of natural fertilization on the
verti-cal transfer of carbon.234Th-derived fluxes were compared
to free-drifting sediment and polyacrylamide gel trap data (Laurenceau-Cornec et al., 2015a). Using primary produc-tion estimates (Cavagna et al., 2014) we examine spatial and temporal variations in export efficiency during the survey. Fi-nally, using KEOPS1 results, early and late bloom conditions are compared.
2 Material and method
2.1 Study area and sampling strategy
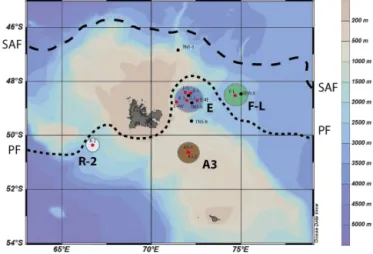
The KEOPS2 cruise took place between October and November 2011 on board the R/V Marion Dufresne. The studied region encompasses the Kerguelen Plateau located between Kerguelen and Heard islands, and the deeper off-shore basin to the east of the islands (Fig. 1). Details of the large-scale circulation in this area can be found elsewhere (Park et al., 2008b). Briefly, the Kerguelen Plateau represents a major barrier to the eastward flow of the Antarctic Circum-polar Current (ACC). The ACC is divided into two branches with the most intense flow passing to the north of the islands and associated with the subantarctic front (SAF). The second branch is associated with the PF and passes south of the is-lands. When crossing the plateau, the southern branch turns
Figure 1. Stations map of234Th measurements during the KEOPS2 expedition. Also, shown are the positions of the subantarctic front (SAF) and the PF adapted from Park et al. (2008b). Colored circles refer to the following clusters of stations showing similar charac-teristics: Control station R-2, north of the PF station F-L, plateau station A3, and PF meander E stations (see text for details).
back north and forms a large meander isolating a mesoscale recirculation structure south of the PF (Fig. 1).
The sampling strategy aimed at characterizing the spatial and the temporal variability of high productivity sites located on and off the plateau. The survey included two transects from south to north (TNS-1 to TNS-10) and from west to east (TEW-1 to TEW-8) for physics and stock parameters, and nine process stations (R-2, A3-1, A3-2, 1, 3, 4W, E-4E, E-5, and F-L) where more intensive sampling including large-volume in situ filtration and sediment trap deployments were carried out. For this study, 14 stations were investigated including 5 transects stations (TNS-8, TNS-6, TNS-1, E-2,
and TEW-8) sampled for total234Th activity and 9 process
stations where total234Th, particulate234Th, and POC pro-files obtained simultaneously allowed to estimate POC ex-port production. Sediment traps deployed and successfully recovered at four process stations were also determined for
234Th activity. Process stations were carried out in four
dis-tinct areas showing different characteristics (see Fig. 1): – The reference station (R-2) was chosen in HNLC waters
upstream of the islands in a non-Fe-fertilized area. – The shallow central plateau was sampled at station A3,
which corresponds to the plateau bloom reference sta-tion of KEOPS1. Stasta-tion A3 was sampled twice (A3-1 and A3-2) over a period of 27.7 days (20 October– 16 November).
– The northern branch of the bloom, which develops north of the PF in the polar front zone (PFZ), was sampled at station F-L (6 November).
– The recirculation feature in the PF meander (station E) received detailed attention with four successive vis-its (E-1, E-3, E-4E, and E-5) as part of a pseudo-Lagrangian time series over 19.6 days. In the same area, a highly productive station (E4W) located on the west-ern edge of the recirculation feature and close to the jet of the PF was sampled but excluded from the pseudo-Lagrangian study.
2.2 Total234Th activities
Total234Th activities were obtained from 4 L seawater
sam-ples collected from 12 L Niskin bottles. For transect stations, 13 depths were sampled between the surface and 20–90 m above the seafloor. For plateau station A3, samples were col-lected at 11 depths between the surface and 30–80 m above the seafloor. For deep stations (R, 1, 3, 4E, 4W, E-5, F-L), 14 depths were sampled between the surface and 900 m, and two deep water samples (1000–2000 m) were sys-tematically collected for calibration purposes (except at E-4W).
Seawater samples were processed for total 234Th
activ-ity measurement following the double-spike procedure de-veloped by Pike et al. (2005) and modified as per Plan-chon et al. (2013). Briefly, samples were acidified with ni-tric acid (pH 2), spiked with230Th yield tracer, and left for
12 hours equilibration before co-precipitation with MnO2
(pH 8.5). Co-precipitated samples were filtered on high-purity quartz microfiber filters (QMA, Sartorius; nominal pore size = 1 µm; ∅ 25 mm), dried overnight and mounted on nylon filter holders covered with Mylar and Al foil for beta counting. Samples were counted twice on board using a low level beta counter (Risø, Denmark) and measurement was stopped when counting uncertainty was below 2 % (RSD – relative standard deviation). Residual beta activity was
mea-sured for each sample after a delay of six 234Th half-lives
(∼ 6 months) and was subtracted from the gross counts ob-tained on-board.
After background counting, all samples were processed for
234Th recovery using229Th as a second yield tracer and with
a simplified procedure described elsewhere (Planchon et al., 2013). Briefly, MnO2co-precipitates were dissolved in 10 ml
of an 8M HNO3/10 % H2O2solution, heated overnight, and
filtered using Acrodisc 0.2 µm syringe filters. Determination of230Th /229Th ratios was carried out on high purity water diluted samples (10 to 20 times) by HR-ICP-MS (Element2,
Thermo Scientific). The overall precision of 230Th /229Th
ratio measurements was 1.8 % (RSD) using triplicate sam-ples and multiple standards analyzed over several analytical
sessions. Average234Th recovery was 88 ± 11 % (n = 200).
Uncertainties of total234Th activity were estimated using
er-ror propagation law and represent 0.07 dpm L−1on average.
Standard deviation of the mean 234Th /238U ratio obtained
for deep waters (> 1000 m) was 0.03 dpm L−1 (n = 19).
238U activity (dpm L−1) was calculated using the relationship
238U (± 0.047) = (0.0786 ± 0.0045) × S – (0.315 ± 0.158)
(Owens et al., 2011). 2.3 234Th flux
234Th export fluxes were calculated using a 1-D box model,
which accounts for total234Th mass balance. Detailed
equa-tions can be found elsewhere (Savoye et al., 2006). 234Th
export flux was estimated at 100, 150, and 200 m depth in or-der to account for (1) variations in the vertical distribution of
234Th deficits and (2) total depth-integrated losses of 234Th
via export. This allows for comparison between stations at the same depth horizon, as well as with KEOPS1 study where a similar approach was used (Savoye et al., 2008). At all
sta-tions,234Th flux was estimated under steady state (SS)
as-sumption, i.e., considering constant total234Th activity over
time and neglecting advective and diffusive flux of 234Th.
For re-visited stations (A3 and E stations),234Th flux was
also estimated under non-steady state (NSS) assumption. At A3, the NSS model was applied for the second visit with a time delay of 27.7 days. At E stations, NSS234Th export flux was estimated when the time delay was greater than 1 week as recommended by Savoye et al. (2006). Consequently, the NSS calculation was carried out only at E-4E (14.6 days) and E-5 (19.6 days). The revisited stations E-2 and E-4W were not considered part of the pseudo-Lagrangian study at the E study site and were excluded from the NSS calculation.
In order to check the assumption that physical transport did not impact the234Th budget, the vertical diffusive flux
(Vz) was estimated using the vertical gradient of234Th
ac-tivity and a range of vertical diffusivity coefficients (Kz val-ues) between 10−4and 10−5m2s−1calculated from the Shih
model (Park et al., 2014b). This range of Kz values for
KEOPS2 is much lower than for KEOPS1 (4 × 10⁻⁴m2s−1)
obtained using the Osborn model (Park et al., 2008a). Vz was calculated using total234Th activities instead of the dissolved
234Th (total234Th–particulate234Th) because of a poor
ver-tical resolution of particulate234Th data in the first 200 m. For all stations, the diffuse flux (Vz) estimated at 100, 150,
and 200 m depth was always below 50 dpm m2d−1and
rep-resents a negligible contribution to the particle-associated ex-port flux.
Lateral transport may also impact the 234Th budget
(Savoye et al., 2006) especially for stations located down-stream of the Kerguelen Islands. From our data, this con-tribution cannot be quantified precisely, and is only qualita-tively considered. Given the mean residence of surface water parcels over the plateau at station A3 (2–3 months) (Park et al., 2008b) or inside the recirculation feature (0.5–1 month) compared to the mean residence of234Th (∼ 1 month), lateral contribution is likely to be minimal in these areas. Circula-tion at the northern staCircula-tion F-L is more dynamic and under the influence of northern Kerguelen shelf waters enriched in dissolved iron (dFe) (Quéroué et al., 2015). Shelf waters are probably depleted in234Th relative to238U due to the
ear-lier development of the bloom in this area, as well as due to sediment resuspension and deposition (Savoye et al., 2008). However, water parcel trajectory calculations (d’Ovidio et al., 2015) suggest that shelf waters are transported in times of less than 0.5–1 month to station F-L. This relatively short transit time still remains long enough for234Th-poor waters to re-equilibrate with238U due to234Th in-growth, thus lim-iting a potential lateral component to the234Th export flux. 2.4 Particulate234Th and POC
Suspended particulate matter was collected at nine process
stations for particulate 234Th and POC via large-volume
(150–1000 L) in situ filtration systems (Challenger Oceanics and McLane WTS6-1-142LV pumps) equipped with 142 mm diameter filter holders. Two size classes of particles (> 53 and 1–53 µm) were collected via sequential filtration across
a 53 µm mesh nylon screen (SEFAR-PETEX®) and a 1 µm
pore size quartz fiber filter (QMA, Sartorius). To limit C and N blanks, the filters were pre-conditioned prior to sam-pling. For large particles (> 53 µm), the PETEX screens were soaked in HCl 5%, rinsed with Milli-Q water, dried at am-bient temperature in a laminar flow hood, and stored in clean plastic bags. QMA filters were pre-combusted and acid cleaned following Bowie et al. (2010).
After collection, filters were subsampled under clean room conditions with acid cleaned ceramic scissors for PETEX screen and a 25 mm Plexiglas punch for QMA. For large particles, one-fourth of the 142 mm nylon screen was
dedi-cated to234Th and POC. Particles were re-suspended in
fil-tered seawater in a laminar flow clean hood and collected on 25 mm diameter silver (Ag) filters (1.0 µm porosity). For small particles, two 25 mm diameter punches were subsam-pled from the 142 mm QMA filters. Ag and QMA filters were dried overnight and mounted on nylon filter holders covered with Mylar and Al foil for beta counting. As for total234Th activity, particulate samples were counted twice on board until the RSD was below 2 %. The procedure was similar for sediment traps samples. Sediment traps samples were re-suspended in filtered seawater, collected on Ag fil-ters, dried, and mounted on nylon filter holder. Residual beta activity was measured in the home-based laboratory after six
234Th half-lives (∼ 6 months) and was subtracted from the
on-board measured values.
Following beta counting, particulate samples (QMA and Ag filters) were processed for POC measurement by an el-emental analyzer – isotope ratio mass spectrometer (EA-IRMS). Samples were dismounted from filters holders and fumed under HCl vapor for 4 h inside a glass desiccator to remove the carbonate phase. After overnight drying at 50◦C, samples were packed in silver cups and analyzed with a Carlo Erba NA 1500 elemental analyzer configured for C analysis and coupled on-line via a Con-Flo III interface to a Thermo Finnigan Delta V isotope ratio mass spectrome-ter. Acetanilide standards were used for calibration. C blanks
were 1.46 µmol for Ag filters and 0.52 µmol for 25 mm QMA punch. Results obtained for two size-segregated POC frac-tions (> 53 and 1–53 µm) are reported in Appendix 2 along with particulate234Th activity measured in the same samples.
3 Results
3.1 234Th activity profiles
The complete data set of total 234Th (234Thtot), 238U
ac-tivities (dpm L−1), and associated 234Th /238U ratios can be found in Table S1 in the Supplement. At all stations, the deficit of234Thtot relative to238U was observed in
sur-face waters (234Th /238U = 0.78–0.95).234Thtotactivities
in-creased progressively with depth and were back to equilib-rium with238U at variable depths according to station: above 100 m at R, TNS-1, and F-L, between 100 and 150 m at A3-1, TEW-8, E-4E, and E-4W, and between 150 and 200 m at TNS-6, TNS-8, E-1, E-2, E-3, E-5, and A3-2. Such a pat-tern is typically encountered in the open ocean (Le Moigne et al., 2013) including the SO (Buesseler et al., 2001; Cochran et al., 2000; Morris et al., 2007; Planchon et al., 2013; Rut-gers van der Loeff et al., 2011; Savoye et al., 2008) and in-dicate scavenging of234Th with sinking particles. In Fig. S1 in the Supplement, the early season trend in234Th /238U ra-tios is presented along the south-to-north transect from the central plateau (first visit to A3, A3-1), on the downward slope of the plateau (TNS-8), across the E stations (TNS-6) to the warmer less-saline PFZ waters north of the PF (TNS-1). Surface234Th /238U ratios varied from 0.92 (A3-1) to 0.85 (TNS-8) and indicates that export of particles had already oc-curred early for this time of the season (mid-October). Deficit
was higher inside the PF meander (234Th /238U ratios of
0.85 to 0.88 at TNS-8 and TNS-6, respectively) and north
of the PF (234Th /238U = 0.88 at TNS-1) compared to the
shallow central plateau (234Th /238U = 0.92 at A3-1). Over the plateau, bottom water (∼ 50–80 m above seafloor) exhib-ited the lowest234Th /238U ratios (0.75). This pattern has already been documented (Savoye et al., 2008) and supports
234Th removal due to sediment re-suspension.
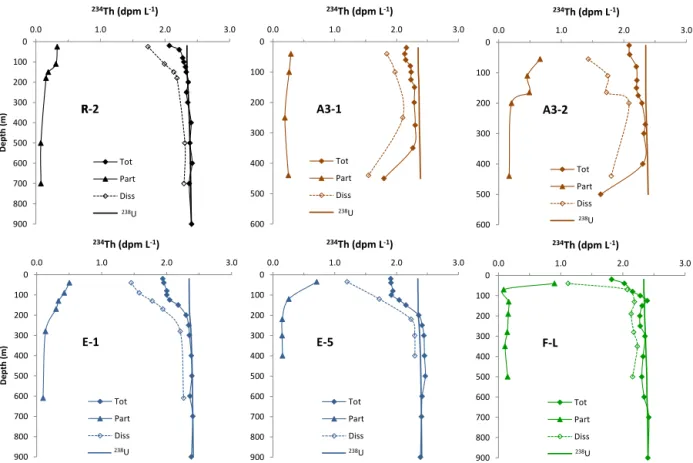
At process stations, 234Thtot profiles were obtained in
combination with particulate 234Th (234Thp) for two size
fractions (1–53 µm, > 53 µm). Results obtained in the differ-ent areas are shown in Fig. 2 for234Thtot, 234Thp (sum of
the two size fractions, see Table S2), and dissolved 234Th
(total−particulate, 234Thd) along with 238U activity (dpm
L−1) deduced from salinity using the equation of Owens et
al. (2011). The average234Thtot within the first 100 m
ex-hibited a relatively small variability over the KEOPS2 area
with 2.21 ± 0.10 (n = 4, 234Th /238U = 0.95 ± 0.04) at
R-2, 2.18 ± 0.05 (n = 5, 234Th /238U = 0.93 ± 0.02) at A3-1, 2.07 ± 0.20 (n = 4, 234Th /238U = 0.89 ± 0.08) at F-L, and 1.98 ± 0.03 dpm L−1 (n = 4, 234Th /238U = 0.84 ± 0.01) at E-1. In contrast, surface234Thpactivity, which reflects
par-0 100 200 300 400 500 600 0.0 1.0 2.0 3.0 234Th (dpm L-1) Tot Part Diss 238U A3-2 238U 0 100 200 300 400 500 600 0.0 1.0 2.0 3.0 234Th (dpm L-1) Tot Part Diss 238U A3-1 238U 0 100 200 300 400 500 600 700 800 900 0.0 1.0 2.0 3.0 De pth (m ) 234Th (dpm L-1) Tot Part Diss 238U R R-2 0 100 200 300 400 500 600 700 800 900 0.0 1.0 2.0 3.0 234Th (dpm L-1) Tot Part Diss 238U F-L 238U 0 100 200 300 400 500 600 700 800 900 0.0 1.0 2.0 3.0 234Th (dpm L-1) Tot Part Diss 238U E-5 238U 0 100 200 300 400 500 600 700 800 900 0.0 1.0 2.0 3.0 D epth (m ) 234Th (dpm L-1) Tot Part Diss 238U E-1 238U 238U
Figure 2. Depth profiles of total234Th (234Thtot), particulate234Thp(sum of the two size fractions), and dissolved234Th (total−particulate, 234Th
d) activity (dpm L−1) along with238U activity (dpm L−1, solid lines) deduced from salinity at HNLC reference station R, central plateau station A3 (A3-1, first visit 20 October; A3-2, second visit 16 November), PF meander station E (E-1, first visit 30 October; E-5, fourth visit 8 November), and north of PF station F-L.
ticle concentration (Rutgers van der Loeff et al., 1997), was subject to larger variations.234Thpactivity was low at R-2
(0.33 dpm L−1) and at A3-1 (0.29 dpm L−1), intermediate at E-1 (0.50 dpm L−1), and highest at F-L (0.90 dpm L−1). Over the course of the survey, averaged 234Thtot activity within
the first 100 m remained remarkably stable over the plateau, with 2.13 ± 0.06 (n = 3,234Th /238U = 0.90 ± 0.03) at A3-2 (27.7 days later), and in the PF meander, with 1.91 ± 0.07 (n = 4, 234Th /238U = 0.82 ± 0.03) at E-3 (4.5 days later) and 1.92 ± 0.02 dpm L−1(n = 4,234Th /238U = 0.82 ± 0.01) at E-5 (19.6 days later). For the particulate phase, the
sit-uation was different. At A3, 234Thp increased from 0.29 to
0.66 dpm L−1between the two visits. At site E,234Thp
var-ied from 0.50 to 0.70 dpm L−1between the first (E-1) and the
last (E-5) visit, suggesting an increase in particle concentra-tions in surface waters at both A3 and E staconcentra-tions.
3.2 234Th flux
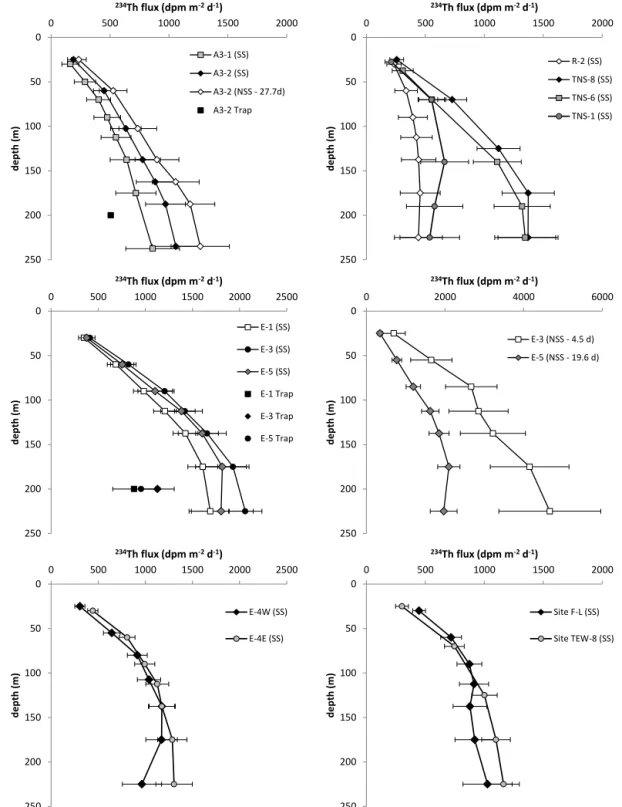
Total234Th activity profiles were used for estimating export fluxes based on SS and NSS assumptions. Cumulated export
fluxes of total 234Th are presented in Fig. 3 and Table S3.
Using the SS calculation,234Th export from the first 100 m
ranged from 412 ± 134 at R-2 to 1326 ± 110 dpm m−2d−1
at E-3. 234Th export increased below 100 m depth
ex-cept at station R-2 and north of the PF (stations F-L,
TEW-8, and TNS-1) where 234Th was back to
equilib-rium with 238U above 100 m. At 200 m depth, 234Th
ex-port reached 993 ± 200 at A3-2, 1372 ± 255 at TNS-8,
and between 1296 ± 193 and 1995 ± 176 dpm m−2d−1 at
E stations. At A3, the NSS 234Th export was 736 ± 186
at 100 m and 1202 ± 247 dpm m−2d−1 at 200 m and
com-pares well with SS export. At E stations, NSS ex-port from the first 100 m were 911 ± 242 at E-4E and 1383 ± 177 dpm m−2d−1at E-5 and also compares well with
SS export. Between 100 and 200 m, NSS234Th export
in-creased at E-5 (2034 ± 299 dpm m−2d−1) and decreased at
E-4E (520 ± 402 dpm m−2d−1). In addition to water column
data, export of 234Th was determined from sediment traps
deployed at 200 m depth (see Fig. 3 and Table 1). Details of trap deployments carried out at E-1, E-3, E-5, and A3-2 can be found elsewhere (Laurenceau-Cornec et al., 2015a).
Ex-port of234Th measured in trap samples ranged from 506 ± 21
at A3-2 to 1129 ± 177 dpm m−2d−1at E-3 and represented
∼50 % of the SS and NSS export determined from234Thtot
0 50 100 150 200 250 0 500 1000 1500 2000 d e p th (m ) 234Th flux (dpm m-2d-1) A3-1 (SS) A3-2 (SS) A3-2 (NSS - 27.7d) A3-2 Trap 0 50 100 150 200 250 0 500 1000 1500 2000 d e p th (m ) 234Th flux (dpm m-2d-1) R-2 (SS) TNS-8 (SS) TNS-6 (SS) TNS-1 (SS) 0 50 100 150 200 250 0 2000 4000 6000 d e p th (m ) 234Th flux (dpm m-2d-1) E-3 (NSS - 4.5 d) E-5 (NSS - 19.6 d) 0 50 100 150 200 250 0 500 1000 1500 2000 2500 d e p th (m ) 234Th flux (dpm m-2d-1) E-1 (SS) E-3 (SS) E-5 (SS) E-1 Trap E-3 Trap E-5 Trap 0 50 100 150 200 250 0 500 1000 1500 2000 2500 d e p th (m ) 234Th flux (dpm m-2d-1) E-4W (SS) E-4E (SS) 0 50 100 150 200 250 0 500 1000 1500 2000 d e p th (m ) 234Th flux (dpm m-2d-1) Site F-L (SS) Site TEW-8 (SS)
Figure 3. Depth profiles of cumulated total234Th export fluxes from the surface to 250 m depth using steady state (SS) and non-steady state (NSS) models and comparison with234Th export fluxes estimated from sediment traps at 200 m.
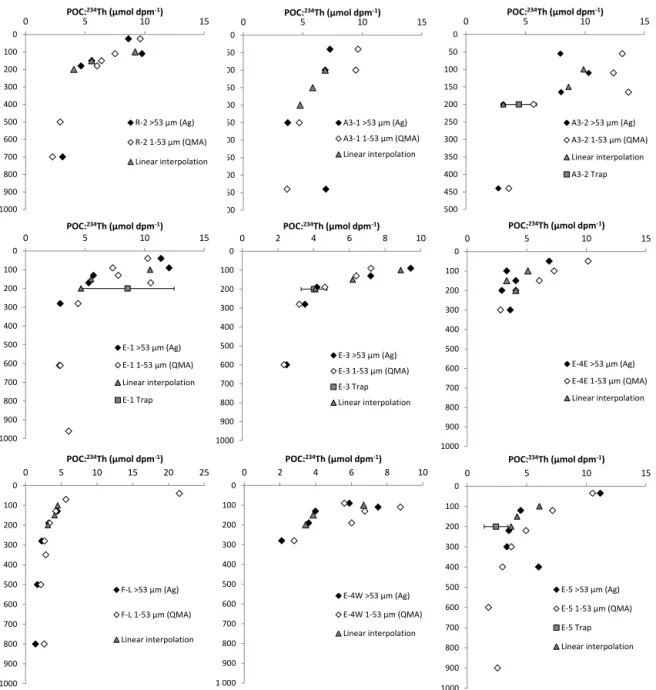
3.3 C : Th ratio of particles
At process stations, particulate 234Th activities and POC
were obtained in two size fractions of particles (1–53 µm,
>53 µm). Profiles of POC :234Th ratios (C : Th) are shown in Fig. 4. C : Th ratios were highly variable, ranging from 1.8
to 21.5 in 1–53 µm particles and from 1.0 to 12.5 in > 53 µm particles. For both size classes, C : Th ratios were high in sur-face waters (0–150 m) with a range of 6.3–9.6 at R, 6.9–13.1
at A3, and 5.7–11.4 µmol dpm−1at E stations with no clear
site-related trend. For open-ocean stations, C : Th ratios de-creased rapidly with depth for the two size classes of particles
0 50 100 150 200 250 300 350 400 450 500 0 POC:5 10 15 234Th (µmol dpm-1) A3-1 >53 µm (Ag) A3-1 1-53 µm (QMA) Linear interpolation 0 50 100 150 200 250 300 350 400 450 500 0 POC:5 10 15 234Th (µmol dpm-1) A3-2 >53 µm (Ag) A3-2 1-53 µm (QMA) Linear interpolation A3-2 Trap 0 100 200 300 400 500 600 700 800 900 1000 0 POC:5 10 15 234Th (µmol dpm-1) R-2 >53 µm (Ag) R-2 1-53 µm (QMA) Linear interpolation 0 100 200 300 400 500 600 700 800 900 1000 0 5 10 15 POC:234Th (µmol dpm-1) E-1 >53 µm (Ag) E-1 1-53 µm (QMA) Linear interpolation E-1 Trap 0 100 200 300 400 500 600 700 800 900 1000 0 2 4 6 8 10 POC:234Th (µmol dpm-1) E-3 >53 µm (Ag) E-3 1-53 µm (QMA) E-3 Trap Linear interpolation 0 100 200 300 400 500 600 700 800 900 1000 0 5 10 15 20 25 POC:234Th (µmol dpm-1) F-L >53 µm (Ag) F-L 1-53 µm (QMA) Linear interpolation 0 100 200 300 400 500 600 700 800 900 1 000 0 2 4 6 8 10 POC:234Th (µmol dpm-1) E-4W >53 µm (Ag) E-4W 1-53 µm (QMA) Linear interpolation 0 100 200 300 400 500 600 700 800 900 1000 0 5 10 15 POC:234Th (µmol dpm-1) E-4E >53 µm (Ag) E-4E 1-53 µm (QMA) Linear interpolation 0 100 200 300 400 500 600 700 800 900 1000 0 5 10 15 POC:234Th (µmol dpm-1) E-5 >53 µm (Ag) E-5 1-53 µm (QMA) E-5 Trap Linear interpolation
Figure 4. POC :234Th (C : Th) ratio in size-fractionated (1–53 and > 53 µm) suspended particulate matter collected by ISP and comparison with sinking particles collected via sediment traps at 200 m depth. Also, shown is a linear interpolation of C : Th ratios at 100, 150, and 200 m depth for carbon flux estimates. Linear interpolation was obtained using a straight line fit between the upper and the lower data point relative to the target depth (i.e., 100, 150, and 200 m depth).
and reached relatively constant values in the mesopelagic zone with 2.8–4.8 at R-2, 2.6–4.5 at E stations, and 1.6– 2.7 µmol dpm−1at F-L. According to particle size, C : Th ra-tios showed different trends. At R-2, E-1, E-3, E-4W, and E-5, C : Th ratios were comparable in small and large parti-cles. At plateau stations A3-1 and A3-2, and to a lesser extent at E-4E, C : Th ratios increased with decreasing size of parti-cles.
3.4 C : Th ratio of sinking particles
To estimate the POC export flux using the234Th-based
ap-proach, the C : Th ratio of sinking particles needs to be deter-mined at the depth of export (Buesseler et al., 1992). Assum-ing the larger particle size class to be representative of the sinking material (Buesseler et al., 2006), we used the C : Th ratios of > 53 µm particles to convert234Th fluxes into POC fluxes. C : Th ratios were estimated at fixed depths of 100, 150, and 200 m, and results are listed in Table 1 and plotted in Fig. 4. For A3-1, A3-2, E-1, E-3, E-4W, and E-5, C : Th
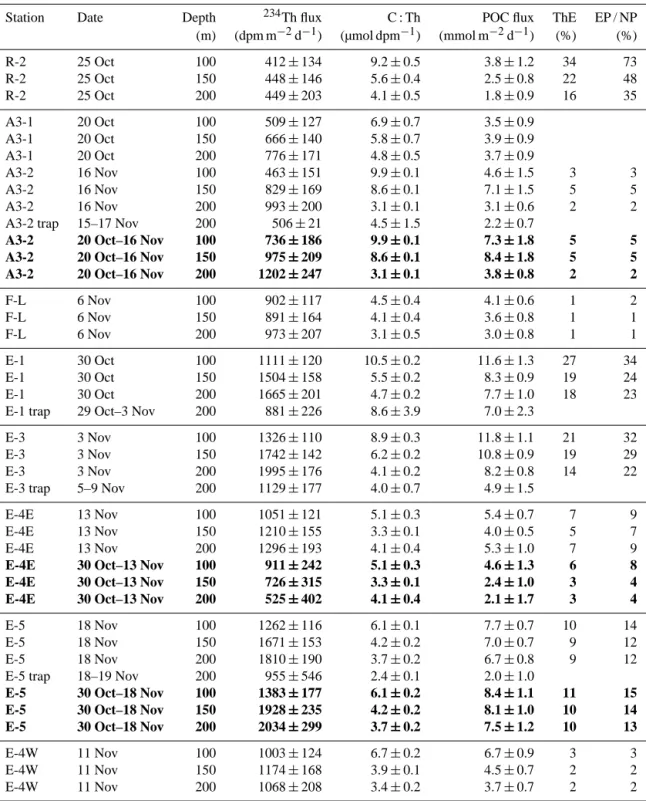
Table 1.234Th and POC export fluxes and C : Th ratios of sinking particles estimated at 100, 150, and 200 m depth, and carbon export effi-ciency (ThE and export production / new production (EP / NP) ratios) during KEOPS2 (bold text indicates that non-steady state calculations were used). ThE ratio defined as the ratio of POC export to net primary production (NPP) and EP / NP ratio defined as the ratio of POC export to new production (NP).
Station Date Depth 234Th flux C : Th POC flux ThE EP / NP
(m) (dpm m−2d−1) (µmol dpm−1) (mmol m−2d−1) (%) (%) R-2 25 Oct 100 412 ± 134 9.2 ± 0.5 3.8 ± 1.2 34 73 R-2 25 Oct 150 448 ± 146 5.6 ± 0.4 2.5 ± 0.8 22 48 R-2 25 Oct 200 449 ± 203 4.1 ± 0.5 1.8 ± 0.9 16 35 A3-1 20 Oct 100 509 ± 127 6.9 ± 0.7 3.5 ± 0.9 A3-1 20 Oct 150 666 ± 140 5.8 ± 0.7 3.9 ± 0.9 A3-1 20 Oct 200 776 ± 171 4.8 ± 0.5 3.7 ± 0.9 A3-2 16 Nov 100 463 ± 151 9.9 ± 0.1 4.6 ± 1.5 3 3 A3-2 16 Nov 150 829 ± 169 8.6 ± 0.1 7.1 ± 1.5 5 5 A3-2 16 Nov 200 993 ± 200 3.1 ± 0.1 3.1 ± 0.6 2 2
A3-2 trap 15–17 Nov 200 506 ± 21 4.5 ± 1.5 2.2 ± 0.7
A3-2 20 Oct–16 Nov 100 736 ± 186 9.9 ± 0.1 7.3 ± 1.8 5 5 A3-2 20 Oct–16 Nov 150 975 ± 209 8.6 ± 0.1 8.4 ± 1.8 5 5 A3-2 20 Oct–16 Nov 200 1202 ± 247 3.1 ± 0.1 3.8 ± 0.8 2 2
F-L 6 Nov 100 902 ± 117 4.5 ± 0.4 4.1 ± 0.6 1 2 F-L 6 Nov 150 891 ± 164 4.1 ± 0.4 3.6 ± 0.8 1 1 F-L 6 Nov 200 973 ± 207 3.1 ± 0.5 3.0 ± 0.8 1 1 E-1 30 Oct 100 1111 ± 120 10.5 ± 0.2 11.6 ± 1.3 27 34 E-1 30 Oct 150 1504 ± 158 5.5 ± 0.2 8.3 ± 0.9 19 24 E-1 30 Oct 200 1665 ± 201 4.7 ± 0.2 7.7 ± 1.0 18 23
E-1 trap 29 Oct–3 Nov 200 881 ± 226 8.6 ± 3.9 7.0 ± 2.3
E-3 3 Nov 100 1326 ± 110 8.9 ± 0.3 11.8 ± 1.1 21 32
E-3 3 Nov 150 1742 ± 142 6.2 ± 0.2 10.8 ± 0.9 19 29
E-3 3 Nov 200 1995 ± 176 4.1 ± 0.2 8.2 ± 0.8 14 22
E-3 trap 5–9 Nov 200 1129 ± 177 4.0 ± 0.7 4.9 ± 1.5
E-4E 13 Nov 100 1051 ± 121 5.1 ± 0.3 5.4 ± 0.7 7 9
E-4E 13 Nov 150 1210 ± 155 3.3 ± 0.1 4.0 ± 0.5 5 7
E-4E 13 Nov 200 1296 ± 193 4.1 ± 0.4 5.3 ± 1.0 7 9
E-4E 30 Oct–13 Nov 100 911 ± 242 5.1 ± 0.3 4.6 ± 1.3 6 8 E-4E 30 Oct–13 Nov 150 726 ± 315 3.3 ± 0.1 2.4 ± 1.0 3 4 E-4E 30 Oct–13 Nov 200 525 ± 402 4.1 ± 0.4 2.1 ± 1.7 3 4
E-5 18 Nov 100 1262 ± 116 6.1 ± 0.1 7.7 ± 0.7 10 14
E-5 18 Nov 150 1671 ± 153 4.2 ± 0.2 7.0 ± 0.7 9 12
E-5 18 Nov 200 1810 ± 190 3.7 ± 0.2 6.7 ± 0.8 9 12
E-5 trap 18–19 Nov 200 955 ± 546 2.4 ± 0.1 2.0 ± 1.0
E-5 30 Oct–18 Nov 100 1383 ± 177 6.1 ± 0.2 8.4 ± 1.1 11 15 E-5 30 Oct–18 Nov 150 1928 ± 235 4.2 ± 0.2 8.1 ± 1.0 10 14 E-5 30 Oct–18 Nov 200 2034 ± 299 3.7 ± 0.2 7.5 ± 1.2 10 13
E-4W 11 Nov 100 1003 ± 124 6.7 ± 0.2 6.7 ± 0.9 3 3
E-4W 11 Nov 150 1174 ± 168 3.9 ± 0.1 4.5 ± 0.7 2 2
E-4W 11 Nov 200 1068 ± 208 3.4 ± 0.2 3.7 ± 0.7 2 2
ratios of sinking particles were estimated from linear inter-polation of measured C : Th ratios. At R-2, the C : Th ratio at 100 m represents the average ratio measured between 25 and 110 m. At F-L, the 100 m C : Th ratio was taken to be equal to the value at 130 m. For E-4E, C : Th of large
parti-cles were measured directly at the depths of 100, 150, and 200 m and were not interpolated. As illustrated in Fig. 4 and in Table 1, C : Th ratios of sinking particles at 200 m esti-mated using ISP samples showed good agreement with
sedi-ment trap data within uncertainty (3–6 and 18–46 % RSD for ISP and trap C : Th ratios, respectively) .
3.5 POC export flux
POC export fluxes were estimated at 100 m (EP100), 150 m (EP150), and 200 m (EP200) by multiplying the
corresponding 234Th export flux with the C : Th
ra-tio of sinking particles at the depth of export. Re-sults are listed in Table 1. EP100 estimated with the
SS model were lowest at A3-1 (3.5 ± 0.9 mmol m−2d−1)
and at R-2 (3.8 ± 1.2 mmol m−2d−1) and highest at
E-1 with E-1E-1.8 ± E-1.3 mmol m−2d−1. The EP100 at F-L was
4.1 ± 0.6 mmol m−2d−1and was similar to the value for the control station R-2 and the plateau station A3. In the PF me-ander, EP100 remained stable between the two first visits (E-3) with 11.8 ± 1.1, but decreased at the third visit (E-4E) to 5.4 ± 0.7 at E4-E, and increased to 7.7 ± 0.7 mmol m−2d−1
at the last visit (E-5). Station E-4W, not included in the time series, had an EP100 of 6.7 ± 0.9 mmol m−2d−1, very
similar to E-4E on the eastern edge of the PF meander. At 200 m, export fluxes ranged between 1.8 ± 0.9 (R-2)
and 8.2 ± 0.8 mmol m−2d−1 (E-3). At the re-visited
sta-tions, carbon export was also estimated using the NSS model approach. NSS EP100 varied from 4.6 ± 1.3 (E-4E)
to 8.4 ± 1.1 mmol m−2d−1 (E-5). Within the uncertainty,
NSS EP100 were similar (E-5 and E-4E) or higher (A3) in comparison to SS EP100. EP200 determined with the
234Th proxy could be directly compared to fluxes
esti-mated with sediment traps deployed at the same depth (Ta-ble 1). Trap fluxes in comparison to EP200 were in very good agreement within uncertainties at E-1 (7.0 ± 2.3 and 7.7 ± 1.0 mmol m−2d−1for trap and234Th-based fluxes,
re-spectively) and A3-2 (2.2 ± 0.7 and 3.1 ± 0.6 mmol m−2d−1
for trap and 234Th-based fluxes, respectively), and 1.7-fold and 3.3-fold lower at E-3 and E-5, respectively.
4 Discussion
The principal aim of this study was to estimate how nat-ural Fe fertilization affects carbon export at high produc-tivity sites over and off-plateau during the early stages of the bloom. In the following sections, results obtained with
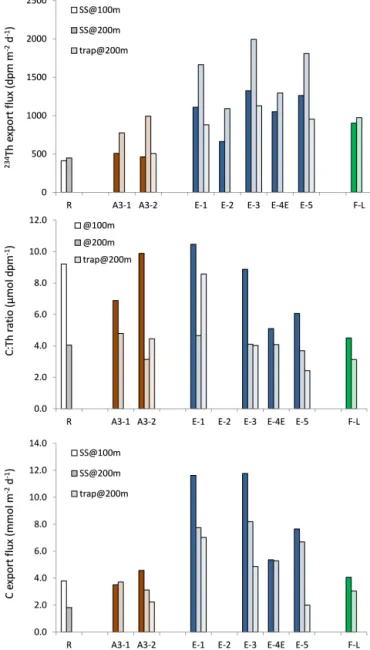
the234Th-based approach and summarized in Fig. 5 are
dis-cussed according to the four distinct zones investigated dur-ing the survey (control station R-2, north of the PF sta-tion F-L, plateau stasta-tion A3, and PF meander E stasta-tions). For each zone, we briefly review the mode and timing of iron supply, described in more details elsewhere (Trull et al., 2015), deduced from dissolved and particulate iron invento-ries (Quéroué et al., 2015; van der Merwe et al., 2015) and from iron budgets in the surface mixed-layer (Bowie et al., 2015). We examine POC export efficiencies using two dif-ferent metrics (Table 1): (1) ThE ratio defined as the ratio
Figure 5. Summary results of234Th export fluxes (dpm m−2d−1), sinking particles C : Th ratios (µmol dpm−1), and POC export fluxes (mmol m−2d−1) obtained at 100 and 200 m depth and comparison with sediment trap data obtained at 200 m depth during KEOPS2 survey.
of POC export to net primary production (NPP) (Buesseler, 1998) and (2) EP / NP ratio estimated as the ratio between POC export to new production (NP) (Joubert et al., 2011; Planchon et al., 2013). NPP and NP are estimated from short-term (24 h) deck board13C-HCO−3,15N-NO−3,15N-NH+4 in-cubation experiments (Cavagna et al., 2014). NP, the frac-tion of C uptake supported by NO−3 assimilation, is estimated from the NPP and the f-ratio (Cavagna et al., 2014). NP is considered to provide an estimate of potentially “exportable production” based on a number of assumptions (Sambrotto
and Mace, 2000) and despite several limitations (Henson et al., 2011).
4.1 Reference site R-2
At reference station R-2, the observed EP100 of
3.8 ± 1.2 mmol m−2d−1is very small and reflects mainly a small and shallow export of234Th (412 ± 134 dpm m−2d−1 at 100 m). Low EP100 is consistent with the HNLC con-ditions at station R-2, where high concentrations of nitrate (25 µM), silicic acid (12–13 µM) (Blain et al., 2015), and very low biomass (Lasbleiz et al., 2014) are observed
in surface waters. Dissolved iron (< 0.1 nmol L−1) and
particulate iron (pFe) levels (0.3 nmol L−1) are also very low in surface waters (Quéroué et al., 2015; van der Merwe et al., 2015). Fluxes of dFe to the surface mixed layer
are estimated to be very limited (94 nmol m−2d−1) and
essentially driven by vertical supplies (Bowie et al., 2015). Biomass at station R-2 appears to be dominated by small, slow-growing phytoplankton (Trull et al., 2015), which offer a limited potential for export. This feature is reflected in
the partitioning of POC and 234Thp, with ∼ 90 % being
associated with the small (1–53 µm) size fraction between 25 and 110 m depth. C : Th ratios of particles show no variation with particle size (Fig. 5) and suggest that large sinking particles may be a result of aggregation processes (Buesseler et al., 2006). This is supported by gel trap observations, revealing that phytodetrital aggregates are an important fraction of sinking material between 110 and 430 m depth (Laurenceau-Cornec et al., 2015a).
The flux obtained at the KEOPS2 reference station is similar to results obtained during the first leg of CROZEX (November–December 2004) at control sites M2 and M6, with carbon export of 4.9 ± 2.7 and 5.8 ± 3.9 mmol m−2d−1, respectively (Morris et al., 2007). Our value for C export is however much lower than the flux obtained in summer at the KEOPS1 control site C11 (12.2 ± 3.3 mmol m−2d−1; January–February 2005; Savoye et al., 2008) or during the second Leg of CROZEX (December 2004–January 2005)
with 18.8 ± 3.4 at M2 and 14.4 ± 3.0 mmol m−2d−1at M6
(Morris et al., 2007).
For the reference station R-2, ThE and EP / NP ratios were high with 34 and 73 %, respectively, and indicate a rela-tively efficient carbon pump despite the limited magnitude of
carbon export and uptake (NPP = 11.2 mmol m−2d−1). The
ThE ratio falls in the range of most literature data for the SO, which is generally elevated (> 10 %) in HNLC waters (Bues-seler et al., 2003; Savoye et al., 2008). During KEOPS1, a ThE ratio as high as 58 % was observed at the reference sta-tion C11 (Savoye et al., 2008). The reasons for this high ef-ficiency could be numerous, and a detailed discussion can be found elsewhere (Laurenceau-Cornec et al., 2015a). Briefly, efficient scavenging of POC at the low productivity site (R-2) may be mediated by fast-sinking aggregates composed of heavily silicified diatoms. Although BSi levels are low
(Lasbleiz et al., 2014), this scenario is supported by the di-atom community found at the reference station R-2, which was dominated by the heavily silicified Fragilariopsis spp. and Thalassionema nitzschioides (Laurenceau-Cornec et al., 2015b and references therein). In addition, the limited zoo-plankton biomass at R-2 (Carlotti et al., 2015) and the rar-ity of fecal pellets in exported material (Laurenceau-Cornec et al., 2015a) suggest that attenuation/transformation of the POC flux through grazing is rather limited, and thus could also partly explain the high export efficiency at the reference station R-2.
With depth, carbon export decreased rapidly at station R-2, and more than 50 % of EP100 was lost between 100 and 200 m depth. Consequently, export efficiency decreased at 200 m depth to 16 and 34 % based on the ThE and NP ra-tios, respectively. A similar trend was deduced from gel traps (Laurenceau-Cornec et al., 2015a). In our case, a sharp de-crease of export with depth seems to be essentially driven by the C : Th ratio of sinking particles, which decreases from
9.2 to 4.1 µmol dpm−1 between 100 and 200 m (Fig. 4).
Such a decrease may support a preferential loss of C
rel-ative to234Th due to a partial degradation of sinking
par-ticles (Buesseler et al., 2006). This feature could involve heterotrophic bacterial activity, since high content of bacte-ria cells (2.9 × 10⁵cell mL−1) are found between 100–150 m (Christaki et al., 2014).
4.2 North of PF site (F-L)
The northern PF station (F-L) exhibits moderate dFe
enrich-ment in surface waters (∼ 0.26 nmol L−1) (Quéroué et al.,
2015). Enrichment is much higher for pFe (1–2.5 nmol L−1)
presumably reflecting biological iron uptake and conversion into biogenic particulate fraction (van der Merwe et al., 2015). The iron budget is not available for station F-L so it is difficult to determine the mode of iron fertilization. However, dFe is likely to be supplied by both vertical exchanges with the Fe-rich reservoir from below and by lateral advection of iron-rich coastal waters from the northern Kerguelen shelf along the northern side of the PF jet (d’Ovidio et al., 2015; Park et al., 2014a; Trull et al., 2015). Analysis of drifter tra-jectories and altimetry-based geostrophic currents (d’Ovidio et al., 2015) indicate that advection of water parcels from the Kerguelen shelf is relatively short to station F-L (0.5 to 1 month). However, iron-rich waters rapidly disperse in this area and limit the persistence of iron fertilization (Trull et al., 2015).
EP100 at station F-L is low (4.1 ± 0.6 mmol m−2d−1) and
is only 1.1-fold higher than at the control station R-2. This suggests no impact of Fe fertilization on upper-ocean
car-bon export in early bloom conditions. However,234Th
ex-port at F-L is 2.2 times higher in comparison to the refer-ence station at the same depth, and indicates a more efficient scavenging of particles in the PFZ. This is supported further
at TEW-8 (886 ± 162 dpm m−2d−1, see Table S3). It should
be mentioned that EP100 at F-L may be underestimated be-cause the C : Th ratio used to convert the234Th flux into C flux was taken at 130 m depth and may be lower than at 100 m depth. As an example, C : Th ratio of 1–53 µm par-ticle at station F-L is 6.0 at 70 m and strongly decreases to
4.5 µmol dpm−1 at 130 m. However, considering deeper
ex-port, EP200 at F-L (3.0 ± 0.8 mmol m−2d−1) appears 1.6-fold higher than EP200 at the reference station R-2 suggest-ing an early impact of Fe fertilization on C export at this
depth. In this area, EP200 estimated using the 234Th proxy
shows excellent agreement with fluxes deduced from gel traps (Laurenceau-Cornec et al., 2015a).
The observed trend in EP drastically contrasts with the very high productivity at F-L. A massive bloom rapidly de-veloped in early November in this area as revealed by satel-lite images (F. D’Ovidio, personal communication, 2014) and station F-L was visited only a few days after the start of the bloom. Phytoplankton biomass was high with total
Chl a up to 5.0 µg L−1, total BSi up to 3.9 and POC up
to 28.2 µmol L−1 (Lasbleiz et al., 2014), with the
diatom-dominated phytoplankton community in the fast-growing phase as revealed by Si (Closset et al., 2014) and C (Cavagna et al., 2014) uptake rates. The phytoplankton community was composed of a broad spectrum of size and taxa (Trull et al., 2015). Considering the three size fractions dominated by phytoplankton (5–20, 20–50, 50–210 µm), 48 and 52 % of POC was found above and below 50 µm, respectively, with small species presumably originating from Fe-rich waters of the northern Kerguelen shelf, and large species being char-acteristic of low biomass waters south of the PF offshore of the islands (Trull et al., 2015). It is interesting to note that the high biomass content is reflected in the partitioning of234Th showing very high234Thpactivity (0.9 dpm L−1at 40 m, see
Fig. 2). Furthermore,234Thpappears to be evenly distributed
between small and large particles similarly to phytoplank-ton community structure. Between 40 and 70 m depth, 40 %
of 234Thp is found with the small (1–53 µm) particles and
60 % with the large (> 53 µm) particles. This size spectrum of particles clearly offers higher potential for C export at F-L compared to the HNLC reference station.
However, comparison with NPP and NP reveals that export efficiency is very low at F-L with ThE and EP / NP ratios of 1 and 2 %, respectively. The two indicators clearly support an inefficient transfer of C to depth and indicate a pronounced decoupling between export and production. Observed decou-pling may partly result from methodological mismatches in the measurements since time and space scales integrated by
NPP and NP (24 h incubation) differs from the 234Th
ap-proach (∼ 1 month). However, very low ThE and EP / NP ratios may also indicate that biomass is in an accumulation phase at station F-L and a major export event is likely to be delayed until later in the season. Such an accumulation scenario is supported by the small, fast-growing, and less-silicified phytoplankton species observed at F-L (Trull et al.,
2015) which are presumably less efficient at exporting car-bon to depth. Furthermore, high mesozooplankton biomass (4.5 gC m−2) (Carlotti et al., 2015) as well as the dominance
of cylindrical fecal pellets in gel traps (Laurenceau-Cornec et al., 2015a) supports an intense grazing activity at F-L, which may contribute to the reduction of the POC flux and to the low export efficiency.
Comparison with literature data shows that EP100 at F-L (4.1 ± 0.6 mmol m−2d−1) remains substantially lower than POC export reported during CROZEX experiment both
dur-ing leg 1 (range 4.9–17 mmol m−2d−1) and leg 2 (13–
30.0 mmol m−2d−1), even though similar Fe-rich waters of the PFZ were sampled (Morris et al., 2007).
Attenuation of export production with depth is relatively weak at F-L, as only 25 % of EP100 is lost between 100 and 200 m depth. This decrease is due to the decreasing C : Th ra-tio of sinking particles from 4.5 to 3.1 µmol dpm−1between
130 and 200 m. As already mentioned for the reference site, this trend may involve heterotrophic degradation of sinking particles. However, bacterial production at F-L is most in-tense in the first 60 m and decreases rapidly with depth to reach values similar to the reference station below 100 m depth (Christaki et al., 2014). At F-L, large particles seems to be more resistant to heterotrophic degradation and this may be linked to the higher abundance of fast-sinking cylindrical fecal pellets (Laurenceau-Cornec et al., 2015a).
4.3 Plateau site A3
Station A3 was located in iron- and silicic acid-rich waters over the central plateau and was visited twice, early (20 Oc-tober) and late (16 November) in the survey. Surface mixed
layer dFe levels were high at A3-1 (0.28–0.32 nmol3 L−1)
and decreasing at A3-2 (0.14–0.18 nmol L−1) probably due
to biological uptake (Quéroué et al., 2015). Surface pFe ex-hibits a similar trend as dFe, with higher concentrations at A3-1 compared to A3-2, but with a more important bio-genic fraction at A3-2 (van der Merwe et al., 2015). Vertical dFe fluxes are by far the dominant sources of iron over the Plateau, and fuel the surface waters during episodic deepen-ing of the upper mixed-layer (Bowie et al., 2015). Conse-quently, fertilization over the plateau is considered to be rel-atively recent, occurring during the maximum winter mixing period in August–September (Trull et al., 2015) and persist-ing over 2–3 months based on the estimated residence times of water parcels over the plateau (Park et al., 2008b).
EP100 over the plateau was very limited, with 3.5 ± 0.9 and 4.6 ± 1.5 mmol m−2d−1at A3-1 and A3-2, respectively,
based on the SS model. Based on the NSS model, EP100 at A3-2 appears slightly higher with 7.3 ± 1.8 mmol m−2d−1. EP100 at A3 shows no difference or a maximum of 1.9-fold higher flux in comparison to the HNLC reference sta-tion R-2 suggesting limited impact of Fe fertilizasta-tion. In-terestingly, the 234Th deficit follows the density structure and extends to the bottom of the mixed layer at 150–200 m.
This is much deeper than at stations R-2 or F-L, and
con-sequently 234Th export increases to 776 ± 171 at A3-1 and
to 993 ± 200 dpm m−2d−1at A3-2 between 100 and 200 m
depth. At A3-2, POC flux was the highest at 150 m depth
with EP150 of 7.1 ± 1.5 and of 8.4 ± 1.8 mmol m−2d−1
based on SS and NSS model respectively, and is 2.8–3.4-fold higher in comparison to EP150 at the HNLC station. At 200 m, increasing234Th export is canceled out by the si-multaneous decrease of C : Th ratios resulting in low carbon export similar to A3-1. Comparison of PPS3/3 and gel sed-iment traps can be conducted at A3-2. First, we observe ex-cellent agreement between ISP and PPS3/3 trap C : Th ra-tios (Fig. 5), indicating that the choice of large (> 53 µm) particles collected via ISP as representative of sinking par-ticles was appropriate. Second, EP200 estimated in this
study (3.1 ± 0.6 and 3.8 ± 0.8 mmol m−2d−1 with SS and
NSS model, respectively) compare well with PPS3/3 trap flux (2.2 ± 0.7 mmol m−2d−1) and are smaller than gel
trap-derived fluxes (5.5 mmol m−2d−1) (Laurenceau-Cornec et
al., 2015a). The low flux collected with PPS3/3 traps may indicate under-trapping, but given that the trap was deployed only for 1 day, this site is particularly susceptible to tempo-ral mismatch resulting from short–term variations in particle fluxes. However, it is worth mentioning that the good agree-ment found between the different and totally independent ap-proaches is encouraging and tends to confirm that export pro-duction over the central plateau was rather low throughout the survey.
Low export at A3 contrasts with the rapid biomass in-crease that occurred a few days before the second visit as re-vealed by satellite images (F. D’Ovidio, personal communi-cation, 2014). The phytoplankton bloom at A3 showed differ-ent characteristics compared to station F-L, suggesting vari-able biological responses to Fe fertilization. The bloom over the central plateau was dominated by fast-growing, large, and heavily silicified diatoms (Trull et al., 2015) showing very high Si uptake rates (Closset et al., 2014). The change in
biomass levels at A3 is well reproduced by 234Thpactivity
which increases from 0.25 to 0.55 dpm L−1between the first and the second visit. These changes are observed also in the size partitioning of234Thp. While at A3-1, 95 % of234Thp
is found to be associated with small (1–53 µm) particles, at A3-2 ∼ 70 % is found to be associated with large (> 53 µm) particles between 55 and 165 m depth. This clearly suggests a very high potential for export at A3-2, although the mas-sive export event had not yet commenced. Delayed export is suggested further by the very low ThE and EP / NP ratios at 100 m depth of 3 and 5 %, respectively, at A3-2, which indi-cates that biomass was accumulating in the mixed layer.
Over the central plateau, EP200 during the early stages of the bloom (range of 3.1 ± 0.6–3.8 ± 0.8 mmol m−2d−1) are 4.4 to 12 times smaller than during the KEOPS1 late summer condition at the same depth horizon (13.9 ± 5.9–
37.7 ± 13.3 mmol m−2d−1) (Savoye et al., 2008). This
difference is essentially due to much higher 234Th
fluxes reported during KEOPS1 (range 2249 ± 772–
8016 ± 949 dpm m−2d−1), indicating that particle
scav-enging is much more intense in January–February during the peak and decline of the bloom. Interestingly, the C : Th ratio of sinking particles exhibits a similar range over the entire growth season, 3.1–9.9 during KEOPS1 and
4.7–7.7 µmol dpm−1 during KEOPS-2, between 100 and
200 m depth. This is relatively surprising because sinking particles are very different between the early and late bloom period over the plateau. During KEOPS2, sinking particles were dominantly composed of phytodetrital aggregates (Laurenceau-Cornec et al., 2015a), and rapid aggregation of diatom cells was also evidenced from underwater vision profiler observations and modeling (Jouandet et al., 2014). During KEOPS1, the export process was different and the majority of the particle flux (composed of fecal pellets and fecal aggregates) was processed through the heterotrophic food web (Ebersbach and Trull, 2008).
4.4 PF meander site E
Export in the recirculation feature south of the PF (E stations) was the highest for the whole survey (Fig. 5). The four visits carried out as a pseudo-Lagrangian survey (E-1, E-3, E-4E, and E-5) revealed the short-term temporal variability of car-bon export over 19.6 days. Surface waters in this area show low-to-moderate enrichment in dFe levels relative to the ref-erence station R-2 but with a high variability (range of 0.06–
0.38 nmol L−1) (Quéroué et al., 2015). Mode and timing of
iron fertilization appears to be complex in the PF meander and differs from over the plateau. The iron budgets suggest that lateral supplies of dFe are the dominant sources of iron for the recirculation feature (4–5-fold greater than the verti-cal flux) (Bowie et al., 2015). Based on water parcel trajecto-ries, the recirculation region could be fueled with Fe-rich wa-ters from the northern Kerguelen shelf, similarly to the north of PF region (station F-L) but delayed. Also, waters derived from northeast are diluted with waters derived from the south (d’Ovidio et al., 2015; Park et al., 2014a). Thus, fertilization of the recirculation region is likely to be less recent and less intense than at station F-L, but is probably more persistent (Trull et al., 2015).
EP100 was particularly elevated at the first
(11.6 ± 1.3 mmol m−2d−1, E-1) and second visit
(11.8 ± 1.1 mmol m−2d−1, E-3), decreased at the third
visit (5.4 ± 0.7 mmol m−2d−1, E-4E), and then increased
again during the fourth visit (7.7 ± 1.3 mmol m−2d−1,
E-5). A comparison with the reference station indicates 1.4–3-fold enhanced export (at 100 m) within the recircula-tion feature suggesting an early impact of Fe fertilizarecircula-tion. High EP100 appears primarily influenced by an elevated
100 m 234Th export, ranging between 1051 ± 121 and
1326 ± 110 dpm m−2d−1. Note that high 234Th export
was also observed in the same area earlier in the survey (21–22 October) at transect stations TNS-6 and TNS-8 (see
Table S3). These results support an early export event in the PF meander that had occurred before the start of the bloom and was associated with moderate biomass levels. The integrated total Chl a stocks at 200 m were relatively stable with 141 at E-1, 112 at E-2, 96 at E-3, 108 at E-4E,
and 126 mg m−2at E-5 (Closset et al., 2014). Furthermore,
the relatively constant 234Th flux over the 19-day period
may indicate that particle scavenging is at steady state, i.e., constant export (Savoye et al., 2006). This is supported also by the excellent agreement found between SS and NSS
estimates of 100 m 234Th fluxes at E-4E and E-5 (Table 1).
However, local variation in 234Th distribution seems to
exist in the PF meander as seen with the smaller234Th flux
recorded at station E-2 which was part of the west-to-east transect (TEW, Table S3 and Fig. 5). The smaller deficit at this station may have been caused by lateral advection
of 234Th-rich (lower deficit) waters originating from the
jet of the PF passing to the north. The second controlling factor of EP100 was the sinking particles C : Th ratio,
showing elevated values at E-1 (10.5 ± 0.2 µmol dpm−1)
and E-3 (8.9 ± 0.3 µmol dpm−1), decreasing progressively
at E-4E (5.1 ± 0.3 µmol dpm−1), and increasing again at
E-5 (6.1 ± 0.2 µmol dpm−1). As already mentioned, such a
decrease may indicate preferential loss of carbon relative
to 234Th (Buesseler et al., 2006). This may involve food
web interactions including bacterial production in the mixed layer increasing from 30 (E-1) to 54.7 nmol C L−1d−1(E-5) (Christaki et al., 2014) and grazing activity by zooplankton (Carlotti et al., 2015).
EP200 was also elevated in the recirculation feature (range of 5.3 ± 1.0 to 8.2 ± 0.8 mmol m−2d−1) but shows less
tem-poral variability. High EP200 results from a very deep234Th deficit extending down to 200 m depth, except at E-4E where
the export depth (depth at which 234Th is to back
equilib-rium with238U) is shallower (∼ 150 m). Consequently,
im-portant increases in234Th export (up to a factor of 2 at E-5) were observed between 100 and 200 m depth. This feature is not in line with the relatively shallow mixed layer depth es-timated in the PF meander (range of 38 to 74 m depth) and seems to follow the depth of the winter mixed layer. Note that macronutrients (nitrate and silicic acid) and dissolved trace elements profiles (Quéroué et al., 2015) display simi-lar patterns to the 234Th deficit. Such a vertical distribution suggests important vertical mixing in the area and tends to confirm that234Th export has occurred earlier in the survey. The234Th export at 200 m displays little variability over the 19.6 days of sampling and this feature is also observed in sediment traps deployed at E-1, E-3, and E-5, even though the traps have collected ∼ 50% of the flux deduced from the
234Th deficit. The C : Th ratio in sinking particles decreases
sharply between 100 and 200 m depth at E-1 and E-3 and to a lesser extent at E-4E and E-5 (Fig. 5). Ratios estimated from ISP show very good agreement with trap C : Th ratios at E-3 and E-5 but not at E-1. The trap C : Th ratio at E-1 was highly variable (8.6 ± 3.9 µmol dpm−1) and appears closer to
C : Th ratios of small (1–53 µm) particles, suggesting a po-tential contribution of these particles to the overall export. A decreasing C : Th ratio results in lower EP200 compared with EP100. However, a comparison with the HNLC refer-ence station reveals between 2.9- and 4.5-fold higher carbon fluxes in the PF meander at 200 m depth. This suggests a strong impact of Fe fertilization in this area which is sub-jected to low-to-moderate dFe inputs. The impact of Fe fer-tilization on carbon export at this location is higher compared to the KEOPS1 study over the plateau (∼ 2-fold higher POC flux) (Savoye et al., 2008).
High export in the PF meander remains relatively unex-pected considering the temporal variation of surface phyto-plankton community structure. Initially dominated by small particles including small centric and pennate diatoms, the larger phytoplankton fraction increased progressively and be-came dominant by the end of the time series (E-5) (Trull et al., 2015). This variability is also observed in 234Thp and
POC partitioning between the surface and 150 m depth. At E1, E-3, and E-4E, small particles represent the dominant
fraction of234Thp and POC, 60–80 %, while at E-5 small
particles fraction decreases to 50 %. This suggests an increas-ing potential for export, whereas EP tends to decrease with time. The same feature is observed for C (Cavagna et al., 2014) and Si uptake rates (Closset et al., 2014) showing low productivity at the beginning increasing progressively dur-ing the course of the survey. These inverse temporal varia-tions between export and production are supported further by the ThE and EP / NP ratios at 100 m depth, where high values were observed initially (27 and 34 %, respectively) at E-1 decreasing progressively until E-5 (10 and 14 %, respec-tively). The reason for this decoupling may be numerous and highlights the complexity of export processes that cannot be easily resolved based only on primary and new production variability. One hypothesis involves food web interactions through grazing pressure, since fecal material is one of the main carriers of the POC export in the upper 200 m at the E stations (Laurenceau-Cornec et al., 2015a).
The early bloom export in the PF meander can be com-pared to the late summer situation reported for station A11 during KEOPS1 located in similar deep waters east of the Kerguelen Islands (Savoye et al., 2008). POC flux at A11 in late summer (range of 19.4–26.3 mmol m−2d−1) is substan-tially higher than EP100 (range of 5.4–11.6 mmol m−2d−1) and EP200 (5.3–7.7 mmol m−2d−1) at E stations confirming that an important fraction of the seasonal export was not sam-pled during KEOPS2. At A11, the C : Th ratio was 11.0 ± 1.2
and 6.3 µmol dpm−1 at 100 and 200 m depth, respectively,
and appears very close to the C : Th ratios measured at E-1 and E-3, and higher than the ratios measured at E-4E and E-5.