RESEARCH ARTICLE
Qualitative and Quantitative Assessment
of Metal Artifacts Arising from Implantable
Cardiac Pacing Devices in Oncological PET/CT
Studies: A Phantom Study
Mohammad R. Ay,
1,2,3,6Abolfazl Mehranian,
1,2Mehrsima Abdoli,
4Pardis Ghafarian,
2,5Habib Zaidi
4,6,71
Department of Medical Physics and Biomedical Engineering, Tehran University of Medical Sciences, Tehran, Iran
2
Research Center for Science and Technology in Medicine, Tehran University of Medical Sciences, Tehran, Iran
3
Research Institute for Nuclear Medicine, Tehran University of Medical Sciences, Tehran, Iran
4
Department of Nuclear Medicine and Molecular Imaging, University Medical Center Groningen, University of Groningen, Groningen, The Netherlands
5
Department of Radiation Medicine, Shahid Beheshti University, Tehran, Iran
6
Division of Nuclear Medicine Geneva, University Hospital, CH-1211, Geneva, Switzerland
7
Geneva Neuroscience Center, Geneva University, CH-1211, Geneva, Switzerland
Abstract
Purpose: We evaluate the magnitude of metallic artifacts caused by various implantable cardiac pacing devices (without leads) on both attenuation maps (μ-maps) and positron emission tomography (PET) images using experimental phantom studies. We also assess the efficacy of a metal artifact reduction (MAR) algorithm along with the severity of artifacts in the presence of misalignment betweenμ-maps and PET images.
Methods: Four pacing devices including two pacemakers (pacemakers 1 and 2) and two cardiac resynchronization therapy (CRT) devices of pacemaker (CRT-P) and defibrillator (CRT-D) type were placed in three phantoms including a cylindrical Ge-68 phantom, a water-bath phantom and an anthropomorphic heart/thorax phantom. The μ-maps were derived from computed tomography (CT) images reconstructed using the standard method supplied by the manufacturer and those reconstructed using the MAR algorithm. In addition, the standard reconstructed CT images of the last two phantoms were manually misaligned by 10 mm along the patient’s axis to simulate misalignment between CT and PET images.
Results: The least and severest artifacts produced on both μ-maps and PET images of the Ge-68 phantom were induced by CRT-P and pacemaker 1 devices, respectively. In the water-bath phantom, CRT-P induced 17.5% over- and 9.2% underestimation of tracer uptake whereas pacemaker 1 induced 69.6% over- and 65.7% underestimation. In the heart/thorax phantom representing a pacemaker-bearing patient, pacemaker 1 induced 41.8% increase and 36.6% decrease in tracer uptake and attenuation coefficients on average in regions corresponding to bright and dark streak artifacts, respectively. Statistical analysis revealed that the MAR algorithm was successful in reducing bright streak artifacts, yet unsuccessful for dark ones. In the heart/thorax phantom, the MAR algorithm reduced the overestimations to 4.4% and the underestimations to 35.5% on average. Misalignment betweenμ-maps and PET images increased the peak of pseudo-uptake by approximately 20%.
Conclusions: This study demonstrated that, depending on their elemental composition, different implantable cardiac pacing devices result in varying magnitudes of metal artifacts and thus pseudo-uptake on PET images. The MAR algorithm was not successful in compensating for underestimations which calls for a more efficient algorithm. The results showed that misalign-ments between PET and CT images render metal-related pseudo-uptake more severe. Key words:PET/CT, Attenuation correction, Metal artifact reduction, Pacemaker, Defibrillator, Misalignment
Introduction
A
ttenuation correction plays an important role inimprov-ing the quality and quantitative accuracy of positron emission tomography (PET) images. Attenuation corrected PET images are more reliable and adequate for visual assessment and quantitative measurement. In stand-alone PET scanners, this correction is performed through lengthy transmission measurements using external radioactive sources followed by forward projection of the obtained attenuation map to generate attenuation correction factors (ACF) corresponding to the emission data [1]. However, due to substantial noise propagation from transmission to emission data, small foci of uptake may be harboured and left undiagnosed [2]. With the advent of combined PET/ CT scanners, the attenuation of annihilation photons can nowadays be corrected using essentially noise-free attenuation maps (μ-maps) derived from CT images acquired in a considerably shorter time [3]. Furthermore, the combination of functional and anatomical images provides accurate localization of metabolically active lesions. Although through these capabilities, PET/CT has had a rapid penetration in the clinic and gained a large market size, CT-based attenuation correction (CT-AC) still faces some challenges that need to be addressed [4]. The propagation of CT streak artifacts induced by non-removable metallic objects into CT-AC PET images has been one of the most challenging problems that triggered many efforts toward understanding its clinical significance [5–7] and developing metal artifact reduction (MAR) algorithms to reduce its
adverse effects [8–11]. In patients with pacemaker and
defibrillator implants, streak artifacts are produced by the metallic components of these devices (i.e., leads, battery and casing) which might result in artifactual overestimation and/or underestimation of tracer uptake in the vicinity of the implant on corresponding PET images. In addition, the motion of metallic objects which occur during PET/CT data acquisition is
known to produce more severe artifacts [12,13].
Although the prevalence of cardiac pacing devices and consequently the number of pacemaker-bearing patients referred for PET/CT scanning has increased in recent years [14], the impact of metallic artifacts caused by such devices (apart from leads) on CT-AC PET images has been addressed only in a limited number of studies [4]. Moreover, their clinical significance in oncological imaging has not
been studied thoroughly compared with other metallic objects
such as dental metallic implants [6, 15, 16] and orthopedic
prostheses [12, 17]. Some studies reported that pacemakers
might induce falsely increased uptake at the site of the implant [18,19] which can be misinterpreted as a metabolically active tumour or metastatic deposit. It is also worth noting that the impact of metallic artifacts arising from pacemaker and implantable cardioverter–defibrillator (ICD) leads on the local tracer uptake in the myocardium has been well studied in the context of cardiac PET/CT imaging [20].
The aim of the present study is to evaluate the influence of metallic artifacts induced by various implantable cardiac pacing devices on CT-derived attenuation maps and attenu-ation corrected PET images using experimental phantom studies. This study attempts to address different pacemaker and defibrillator units whose elemental composition and thus the magnitude of metallic artifacts varies depending on their model and function. We also evaluated the efficacy of an image-based MAR algorithm [8] in terms of artifact reduction
and the impact of misalignment between μ-maps and PET
images on the severity of metal-related pseudo-uptake.
Materials and Methods
PET/CT Scanner
PET/CT imaging was performed on a Biograph Hi-Rez TP PET/CT scanner with 64-slice CT capability (Siemens Medical Solutions, Erlangen, Germany). The PET subsystem accommodates 24,336 high count rate lutetium oxyorthosilicate crystals arranged in 39 rings to provide a high volumetric spatial resolution. The CT subsystem consists of a 40-row ceramic detector equipped with 1,344 channels per row and adaptive collimation. It delivers 64 slices per rotation with high temporal resolution. The Syngo reconstruction software (Siemens Medical Solutions, Erlangen) provides an option to utilize the MAR algorithm developed by Hamill et al. [8] to reduce artifacts related to pacing and defibrillator leads in cardiac studies but is also applicable to other metallic artifacts.
Phantoms Data Acquisition
Three phantoms including a solid cylindrical68Ge/68Ga phantom, a water-bath phantom and the anthropomorphic heart/thorax phantom (Radiology Support Devices, Inc.) were used in this study.
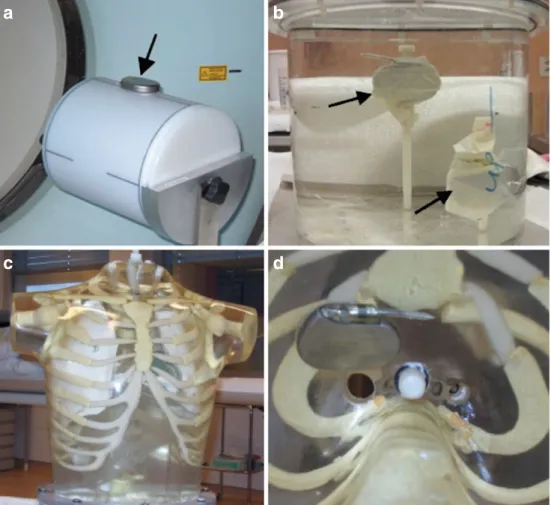
Moreover, two pacemakers, namely pacemaker 1 (Actros SR Model 120082, Biotronik, Inc.) and pacemaker 2 (Meridian DR Model 1276, Guidant, Inc.) along with two cardiac resynchroniza-tion therapy (CRT) devices including a CRT defibrillator–CRT-D (InSync Marquis model 7277, Medtronic, Inc.) and a CRT pacemaker–CRT-P (InSync III Model 8042, Medtronic, Inc.) were used in this study (Fig.1). For the first phantom, each device was separately attached to the outer side of the uniform cylindrical phantom (22 cm diameter) containing 74 MBq of 68Ge/68Ga (Fig. 1a). The visual assessment demonstrated the strongest artifacts when using pacemaker 1 and the weakest when using CRT-P. Therefore, in the second phantom (Fig.1b), pacemaker 1 and CRT-P were placed inside a uniform water-filled cylinder (20 cm in diameter) containing 37 MBq of Fluorine-18. To emulate typical metallic artifacts in a pacemaker-bearing patient, pacemaker 1, which showed the strongest artifacts in the previous phantom study, was implanted under the right clavicle (Fig.1c) of the RSD heart/thorax phantom (Fig. 1d). This tissue-equivalent anthropo-morphic phantom is primarily designed for cardiac imaging studies and includes a typical human thorax, heart, lungs and liver. To model typical 2-deoxy-2-[18
F]fluoro-D-glucose distribution in the human body, the phantom’s individual organs were filled with Fluorine-18 approximately 1 h after 300–400 MBq administration of 2-deoxy-2-[18F]fluoro-D-glucose, as follows: 43.46 MBq in the thorax cavity, 5.71 MBq in the myocardial wall, 1.22 MBq in left lung, 1.74 MBq in right lung and 12.45 MBq in the liver [21].
After centering the phantoms in the scanner, a low-dose CT protocol was used for the first two phantoms where CT scans were acquired using the following parameters: 120 kVp, 65 mAs, slice thickness of 5 mm, helical pitch of 0.45:1, collimation 24×1.2 mm and 1 s per tube rotation. The PET emission scan was started immediately following the CT scan, lasting 20 min for a single bed position. For the heart/thorax phantom, the CT scan was performed at 120 kVp, 55.5 mAs slice thickness of 5 mm, helical pitch of 0.8:1, collimation 24×1.2 mm and 0.33 s per tube rotation, followed by the PET emission scan (15 min per bed position). Several bed positions were used in the latter case to match the larger axial extent of the heart/thorax phantom.
Image Reconstruction
The CT data were reconstructed twice at standard CT resolution (512× 512 pixels). The first reconstruction was performed using the filtered back-projection algorithm, where beam hardening effects are not considered, and, as such, the produced images produce bright and dark streak artifacts in the presence of metallic objects. The second reconstruction used the image-based MAR algorithm developed by [8]. Following compensation for decay, scattered photons and random coincidences, the PET emission data were corrected for attenuation using CT-AC and then reconstructed using a 2D ordered subsets— expectation maximisation iterative algorithm with the following
a
b
c
d
Fig. 1. Photographs of the experimental phantoms used in this study. a Cylindrical Ge-68 phantom where various pacing devices are attached to the outer side of the phantom. b Water-bath phantom containing pacemakers 1 and 2 on the top and bottom, respectively. c The RSD heart/thorax phantom in which pacemaker 1 was implanted under the right clavicle near the sternum (d).
parameters: six iterations, eight subsets, and a zoom of 2 and 5.0 mm Gaussian smoothing. To model misalignment between CT and PET data, CT images of the water-bath and heart/thorax phantoms were manually shifted upward along patient’s axis (Z-direction) by 10 mm. The accuracy of the misalignment was verified by experimental measurement of the 68Ga cylindrical source. After deriving ACFs, PET emission data were reconstructed again using the same parameters described above.
Assessment Strategy
Region-of-interest (ROI)-based quantitative analysis was performed on attenuation maps obtained without (no MARμ-maps) and with MAR algorithm (MAR μ-maps), corresponding PET images corrected for attenuation without (no MAR-AC PET) and with MAR (MAR-AC PET). PET images corrected for attenuation with misaligned CT images were also analysed. For no MAR-CT
images, 25 ROIs were defined on various slices of flare regions where bright streak artifacts overestimated CT numbers and on photopenic regions where dark streak artifacts underestimated CT numbers and up to three ROIs in regions far away from streak artifacts which served as reference for analysis. The defined ROIs were then transferred to co-registeredμ-maps and PET images. Mean linear attenuation coefficient (LAC; cm–1) and mean activity concentration (kBq/cc) were calculated for the over- and underestimated regions by averaging the values of corresponding ROIs and compared with the reference values. Since many ROIs were defined in various locations on artifactual regions, the obtained results are independent of ROI location. To evaluate the impact of motion, ROIs were defined on overestimated regions of motion-affected PET images and the calculated mean and peak uptake values were compared with corresponding reference regions. A two-tailed paired t test was used for statistical analysis of attenuation maps and PET images reconstructed with and without MAR, including PET images.
Table 1. Overestimation (in%) of attenuation coefficients for μ-maps and tracer uptake values derived from PET images of the Ge-68 phantom for the various pacing devices obtained with and without MAR in CT images (PG0.0001 in all cases)
no MAR MAR
μ-map PET μ-map PET
Pacemaker 1 24.7 37.7 4.7 10.2 Pacemaker 2 20.0 31.6 4.3 9.4 CRT-D 10.5 16.8 4.2 7.4 CRT-P 2.3 8.2 1.9 5.3
a
b
c
d
e
i
f
j
g
k
l
h
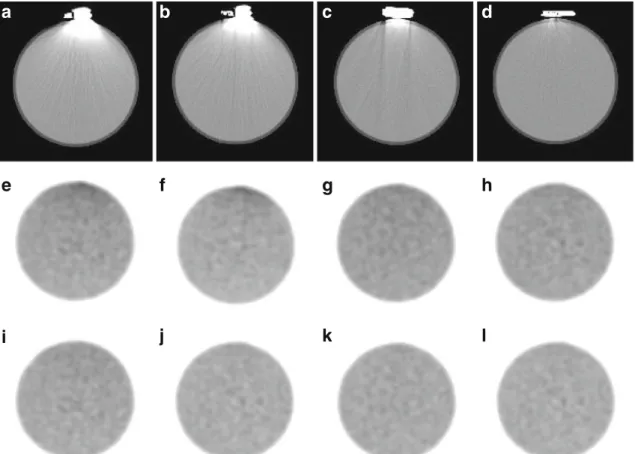
Fig. 2. Representative slices of the Ge-68 phantom study showing: original CT images (a–d), noMAR-AC PET images (e–h), and MAR-AC PET images (i–l), respectively. From left to right: pacemaker 1, pacemaker 2, CRT-D and CRT-P devices.
Statistical analysis was performed at 5% level of significance. It is worth to point out that failure to prove statistically significant differences is not sufficient to confirm that the results are statistically identical.
Results
Metal Artifact Reduction
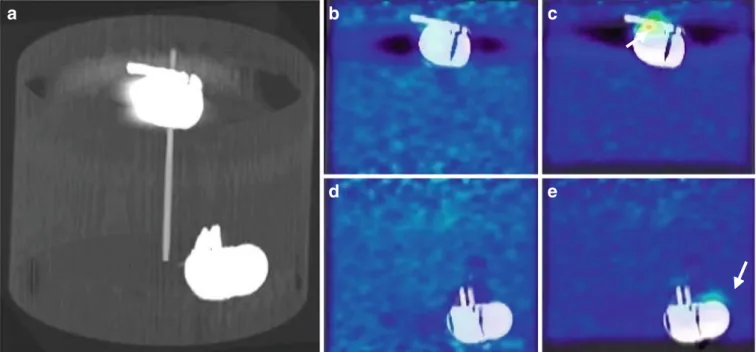
Figure2shows representative slices of CT and PET images
of the Ge-68 phantom where the presence of cardiac pacing devices resulted in metallic artifacts on CT images and consequently, through CT-AC, on apparent tracer accumu-lation in the proximity of the devices in noMAR-AC PET images. Since the devices were attached to the outer wall of the phantom, only bright streak artifacts were dominantly produced and propagated downwardly into CT images.
Table1summarizes the statistical analysis results ofμ-maps
and PET images comparing noMAR and MAR-mediated reconstructions for this phantom incorporating the four pacing devices used in this study. According to this table, the largest apparent uptake and LAC flare are brought by pacemaker 1 (37.7% and 24.7%, respectively) whereas the
smallest apparent uptake and LAC flare are induced by the CRT-P device (8.2% and 2.3%, respectively). As presented
in this table and observed in Fig. 2i–l, applying the MAR
algorithm resulted in a reduction of the apparent increased uptake (PG0.0001) to the extent that there was no pseudo-uptake larger than 10% of the background, thus confirming the efficacy of the MAR algorithm in reducing bright streak artifacts. Likewise, statistical analysis revealed a significant difference (PG0.0001) between noMAR-AC and MAR-AC PET images for all metallic devices. It should be emphasized that the paired t test analysis comparing noMAR and MAR μ-maps or those of noMAR and MAR-AC PET images.
Figure3shows representative slices ofμ-maps, CT and PET
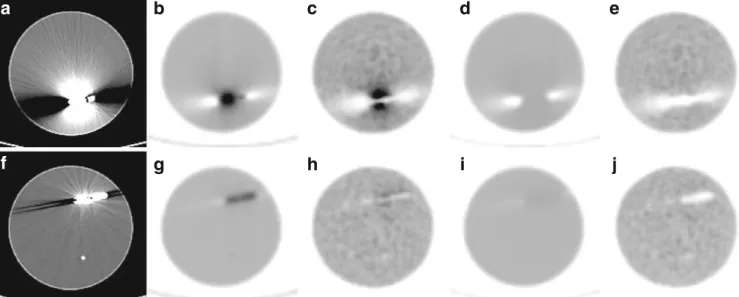
images of the water-bath phantom. As can be seen, pacemaker 1 produced more severe bright and dark streak artifacts than
CRT-P. As summarized in Table2, this device resulted in a larger
over- or underestimation ofμ-maps and PET images. In the
absence of MAR of CT images, the tracer uptake in the presence of pacemaker 1 and CRT-P was overestimated by 69.6% and 17.5% in flare regions and underestimated by 65.7% and 9.2% in photopenic regions, respectively. Likewise, linear attenuation
coefficients inμ-maps near metallic devices were overestimated
by 33.9% and 11.5% in flare regions and underestimated by 46.8% and 7.4% in photopenic regions, respectively. As shown
f
b
g
c
h
d
i
e
j
a
Fig. 3. Representative slices of CT images,μ-maps and PET images of the water-bath phantom for (a–e) pacemaker 1 and (f–j) CRT-P devices. From left to right: original noMAR CT images, noMAR μ-maps, noMAR-AC PET images, MAR μ-maps and MAR-AC PET.
Table 2. Under- (unROI) and overestimation (ovROI) (in percent) of attenuation coefficients for μ-maps and tracer uptake values derived from PET images of the water-bath phantom for pacemaker 1 and CRT-P, obtained with and without MAR in CT images
no MAR MAR P value
μ-map PET μ-map PET μ-map PET Pacemaker 1 ovROI 33.9 69.6 8.1 0.8 G0.0001 G0.0001
unROI −46.8 −65.7 −46.2 −63.6 0.096 0.051 CRT-P ovROI 11.5 17.5 4.9 0.3 G0.0001 G0.0001
in Fig.3d–e, i–j, the MAR algorithm considerably reduced the
falsely increased LACs and tracer uptake in corresponding
μ-maps and PET images but seems unsuccessful for compensation of the underestimations. The algorithm significantly reduced overestimations (PG0.0001) and underestimations (without proof of statistically significant difference in the latter case) of
both LACs and tracer uptake (Table2).
The fused PET/CT image of the RSD heart/thorax phantom
is shown in Fig.4. The streak artifacts caused by pacemaker 1
have adversely affected a large area on the CT image which propagated into the PET image through the CT-AC procedure.
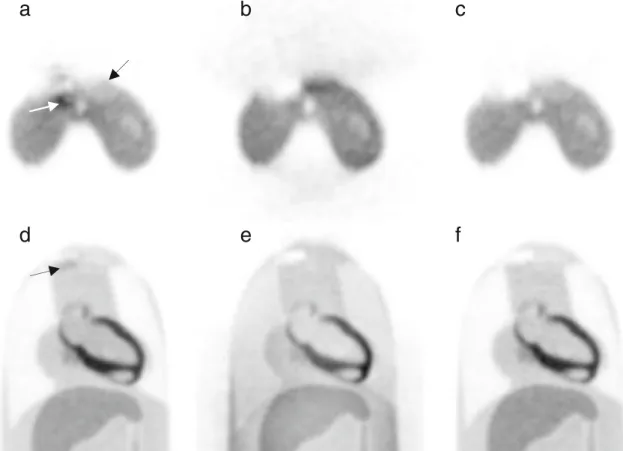
As shown in Fig. 5a, d, the over- and under-correction by
inappropriate linear attenuation coefficients resulted in artifi-cially increased and decreased uptake in the vicinity of the implant on the noMAR-AC PET image. Compared with the
uncorrected PET image (NAC-PET) shown in Fig. 5b, e, it
turns out that the increased uptake mimicking pathology near
the implant (black arrow in Fig.5a, d) is artifactual. Moreover,
the uptake in regions corresponding to dark streak artifacts
(white arrow in Fig. 5a) has considerably falsely decreased
which demonstrates that underestimation of tracer uptake has the potential to harbour small or low-uptake tumours in photopenic regions. On the MAR-AC PET images, the overestimations around the pacemaker were substantially
b
a
c
Fig. 4. PET/CT images of the RSD heart/thorax phantom showing bright and dark streak artifacts caused by pacemaker 1 displayed on a transverse b coronal, and c sagittal views.
c
a
b
e f
d
Fig. 5. a–c Transverse and d–f coronal views of a representative PET slice of the RSD heart/thorax phantom in the presence of pacemaker 1. From left to right: noMAR-AC PET images, NAC-PET images and MAR-AC PET images.
reduced; however, the underestimations remained visible
(Fig.5c, f). Figure6shows the effectiveness of the algorithm
in reducing overestimated regions and in compensating
under-estimated ones on μ-maps and corresponding ACFs of the
heart/thorax phantom.
Table3 summarizes statistical analysis results of noMAR
and MAR-mediated reconstructions of the heart/thorax phan-tom. The overestimation of tracer uptake was significantly reduced from 42.1% to 2.2% (PG0.0001) while the under-estimated regions remained, for the most part, uncorrected
(slight reduction from−40.5% to −39.4%) on MAR-AC PET
images. Likewise, the overestimation of LACs was reduced from 41.4% to 6.6% with only a slight reduction in the
underestimated regions (from−32.6% to −31.5%). The results
of this phantom study seem to confirm that metallic artifacts can induce significantly increased or decreased uptake in PET images and demonstrate the efficiency of the MAR algorithm in reducing the overestimations.
Misalignment between PET and CT Images
Figure 7 shows fused PET/CT images of the water-bath
phantom before and after 10 mm upward misalignment
between PET and CT images. In the presence of metallic objects such as pacemakers, if a misalignment occurs
between a PET image and its corresponding μ-map, the
high-attenuation coefficients corresponding to the location of the device are mistakenly used for attenuation correction of PET emission data in the vicinity of the device in the direction of misalignment which results in overcorrection for photon attenuation and consequently, overestimation of
tracer uptake in these regions (Fig.7c, e). In contrast, when
PET images and their correspondingμ-maps are aligned, the
artifactual increased uptake is not observed (Fig. 7b, d),
although overestimation and underestimation of tracer uptake resulting from bright and dark streak artifacts arising from the device still remains a concern in both cases.
Figure8shows the mean and peak tracer uptake (in kBq/cc)
in artifactually metabolic regions around pacemaker 1 and CRT-P in the water-bath phantom, when PET and CT images are aligned (noMotion) and when they are mis-aligned (Motion). The results demonstrated that a 10 mm misalignment for pacemaker 1 causes an increase of the mean and peak activity concentration from 5.1 to 7.1 kBq/cc (PG0.0001) and from 9.0 to 10.7 kBq/cc, respectively. Likewise, they increased from 3.4 to 4.3 kBq/cc (PG0.0001) and from 4.4 to 5.2 kBq/cc, respectively, for CRT-P.
b
a
d
c
Fig. 6. Illustration of the performance of the MAR algorithm. Representative slices of noMAR (left) and MAR (right)μ-maps of the RSD heart/thorax phantom (a–b) and their corresponding ACFs (c–d).
Table 3. Under/overestimation (in%) of attenuation coefficients for μ-maps and uptake values for PET images of the RSD heart/thorax phantom for pacemaker 1 and CRT-P, obtained with and without MAR in CT images
no MAR MAR P value
μ-map PET μ-map PET μ-map PET Pacemaker 1 ovROI 41.4 42.1 6.6 2.2 G0.0001 G0.0001
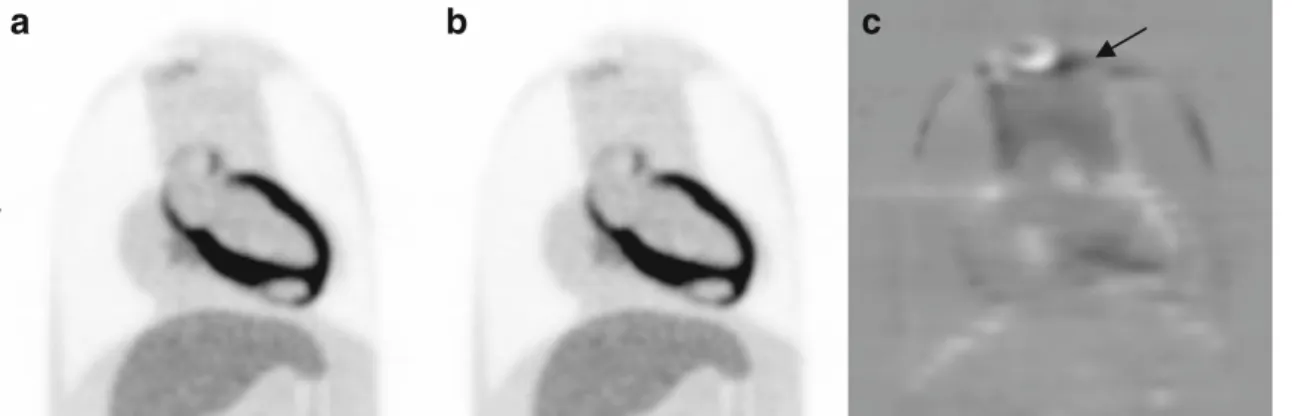
Figure 9 shows the impact of misalignment on the severity of artifactual uptake around pacemaker 1 in the
heart/thorax phantom. The PET images shown in Fig.9a–b
were corrected for attenuation in the conditions of perfect alignment and 10 mm upward misalignment. The difference
image is also shown in Fig.9cwhere the influence of motion
is observed as a noticeable apparent uptake in the vicinity of
the implant. The ROI analysis presented in Fig. 10 shows
that the mean uptake in active regions around the implant increased owing to the above-mentioned misalignment from
5.2 to 6.1 kBq/cc (PG0.0001) while the peak uptake
increased from 5.8 to 7.0 kBq/cc.
Discussion
Streaking artifacts caused by metallic implants such as cardiac pacing devices are known to produce pseudo-uptake
in PET images through CT-AC [19, 20]. For the energy
range used for CT scanning, the low-energy X-rays of the polychromatic beam are attenuated by a greater rate compared with high-energy X-rays, particularly in the presence of high atomic number materials such as cardiac pacemakers. As a result, the X-ray beam gets richer in high-energy photons and becomes harder. The filtered back-projection algorithm used for standard CT reconstruction fails to consider beam hardening effect, thereby the reconstructed images exhibit bright and dark streak artifacts resulting from over- and underestimation of LACs in some regions. When employing artifactual images for CT-AC, the incorrectly scaled attenuation coefficients result in over- or under-correction of photon attenuation, which in turn causes over- or underestimation of tracer activity in the affected regions. Since the severity of metallic artifacts is highly dependent on the atomic number, our study aimed to quantify the clinical relevance of such artifacts for various pacemakers and defibrillators in the context of interpretation in oncological PET/CT imaging, especially in staging of supraclavicular lymph node metastasis and chest wall invasions.
The results showed that cardiac pacing devices used in this phantom study give rise to streak artifacts with different
magnitude where LACs inμ-maps and tracer uptake in PET
images are over- or underestimated. Compared with other devices, pacemaker 1 and CRT-P produced the most and
least streak artifacts on both μ-maps and PET images,
a
d
b
e
c
Fig. 7. Effect of misalignment between PET and CT images of the water-bath phantom. a A volumetric CT image in which the locations of pacemaker 1 (top) and CRT-P (bottom) are shown. b PET/CT image of pacemaker 1 corrected for attenuation using the aligned CT image, and c using misaligned CT image by 10 mm. d PET/CT image of the CRT-P device corrected for attenuation using aligned CT image and e using misaligned CT image by 10 mm.
5.1 9.0 3.4 4.4 7.1 10.7 4.3 5.2 0.0 2.0 4.0 6.0 8.0 10.0 12.0
Mean Peak Mean Peak
Me a n /P e a k U p ta ke ( k Bq/ c c ) Pacemaker 1 CRT-P no Motion Motion
Fig. 8. Comparison between mean and peak tracer uptake in surrounding areas of pacemaker 1 and CRT-P device before (noMotion) and after (Motion) 10 mm upward misalign-ment between PET and CT acquisitions of the water-bath phantom.
respectively, when using Ge-68 and water-bath phantoms
(Figs.2and3). It turned out that the magnitude of apparent
local uptake produced by pacemaker 1 in flare regions for the Ge-68 phantom is 37.7% whereas it is 69.5% in flare
regions and−65.7% in photopenic regions of the water-bath
phantom. The heart/thorax phantom incorporating this pace-maker simulated a patient having a pacepace-maker or a defibrillator implant under his/her clavicle. As observed by Bujenovic et al. [18] and Halpern et al. [19] in clinical setting, PET images of this phantom showed that metallic artifacts arising from the pacemaker, as a representative implantable cardiac pacing device, induce substantial pseudo-uptake nearby the implant resulting in overestima-tion and underestimaoverestima-tion of tracer uptake by 42.1% and 40.5% in areas corresponding to bright and dark artifacts,
respectively. As seen in Fig.5a, d, the erroneously increased
uptake can mimic metabolically active tumours whereas the decreased uptake can harbour small and low-uptake lesions in supra- and infra-clavicular regions, representing important areas for staging metastatic deposits. Although the pace-makers in the water-bath and heart/thorax phantoms were cold, as revealed by uncorrected PET images, where no
observable uptake is seen, small uptake was observed at their corresponding location in noMAR-AC PET images
(Fig.5a). One possible explanation is the fact that 511 keV
photons can interact with the pacemakers dominantly by Compton scattering and as such few counts can be detected at pacemaker’s location. When these events are corrected by the overestimated LACs of pacemakers, they falsely appear as focal tracer uptake.
Since X-ray absorption properties of pacemakers and defibrillators (ICDs and CRT-Ds) at CT energies are primarily governed by photoelectric absorption, knowing the elemental composition of high-Z components of these devices, i.e. casing and battery, contributes to explain the magnitude of the artifacts arising from these devices. The casing of a pacemaker or a defibrillator is commonly made of titanium (Z=22), a biocompatible metal that is as strong as steel but 45% lighter. The titanium casing along with special filters helps to reduce outside electromagnetic interferences. Defibrillator batteries are called upon to deliver high-energy cardioversion/defibrillation pulses whereas pacemaker batteries should supply electrical stimuli lower in amplitude. The battery composition needed for this feature makes defibrillator batteries last shorter than pace-maker batteries. Lithium/silver vanadium oxide (Li/SVO) batteries having high-Z elements such as silver (Z=47), vanadium (Z=23) and iron (Z=26) are the most frequently used power sources for defibrillators. The majority of cardiac pacemakers are powered by lithium-iodine batteries in which iodine (Z=53) and iron are the high-Z elements. Recently, lithium carbon monofluoride (Li/CFx) batteries with fluorine (Z=9) and iron as the highest-Z elements have been introduced for use in powering pacemakers and even in ICD and CRT-D devices. Although pacemakers are smaller in size compared with defibrillators, the elemental compo-sition of their batteries (other than Li/CFx batteries) shows that they have a higher effective atomic number and, as such, a higher potential to produce metallic artifacts. As
noted in Fig.2, pacemakers 1 and 2 produced more intense
streak artifacts compared with the D device. The CRT-P device produced the least amount of artifacts among other
c
b
a
Fig. 9. Effect of misalignment in the RSD heart/thorax phantom. a PET image corrected for attenuation using aligned CT image and b using misaligned CT image by 10 mm. c The difference image (a–b) shows the increase of apparent uptake resulting from motion.
5.2 5.8 6.2 7.0 0.0 1.0 2.0 3.0 4.0 5.0 6.0 7.0 8.0 Peak Mean Me a n /P e a k U p ta ke ( K bq/ c c ) Pacemaker 1 no Motion Motion
Fig. 10. Comparison of mean and peak tracer uptake in surrounding areas of pacemaker 1 before (noMotion) and after (Motion) 10 mm upward misalignment between the PET and CT acquisitions of the RSD heart/thorax phantom.
devices which should be ascribed to its low-Z battery chemistry consisting of a mixture of lithium/silver vanadium oxide and lithium carbon monofluoride.
As noted in Figs. 3 and 5, the MAR algorithm is much
more efficient in reducing bright streak artifacts than dark ones which should be ascribed to its inability in considering underestimations. This algorithm employs an image-based MAR method in which metal artifact regions are segmented by morphological operations and replaced with appropriate values. It was shown that this algorithm is successful in reducing the magnitude of metallic artifacts caused by automatic implantable cardioverter defibrillator leads [8]. In our study, the algorithm was successful in reducing bright
streak artifacts (Figs. 3 and 5), while dark streak ones
remained as severe as before correction. The statistical
analysis presented in Tables 2 and 3 did not reveal
statistically significant difference between affected regions in both attenuation maps and PET images when comparing noMAR and MAR-mediated reconstructions. As observed in Fig.6, the overestimated LACs were reduced after applying the MAR algorithm whereas the underestimated ones were not adequately tackled. This substantiates that this algorithm is not efficient for suppressing all artifacts arising from implantable pacemakers and defibrillators. It should be noted that uncorrected PET images of the heart/thorax phantom
(Fig. 5b, e) led to apparent activity in the superficial
structures which disappeared after attenuation correction.
According to the results presented in Fig. 8, it turns out
that a misalignment between PET and CT images of the water-bath phantom produces an apparent increase in peak uptake by 18.8% for pacemaker 1 and 18.2% for CRT-P
appearing as hot spots in PET images (Fig.7c, e). Likewise,
a misalignment by 10 mm upward resulted in 20.7% apparent increase in the peak tracer uptake for the heart/
thorax phantom nearby the pacemaker implant (Fig.10). As
mentioned earlier, when a misalignment occurs between the
PET image andμ-map of a subject bearing a pacemaker or a
defibrillator, the overestimated LACs of the device are partially applied to adjacent areas, thus producing hot spots and as such the effect of metal artifacts becomes more severe. Consistent with our study, various phantom studies reported a bias in activity concentration and uniformity in the presence of a metallic objects when motion occurs
between PET and CT images [12,13], which highlights the
importance of immobilization aids and motion compensation algorithms.
With the increasing prevalence of cardiac pacing devices and growing market size of PET/CT scanners, taking appropriate measures to reduce metallic artifacts caused by these devices with the aim to improve diagnostic accuracy is highly demanded. The most promising approaches to reduce metallic artifacts focused on the development of sophisti-cated image reconstruction algorithms having a potential to produce artifact-free images. Moreover, our study demon-strated that advances in battery composition and shift towards new low-Z compositions are an inherently effective
approach to reduce metal artifacts considerably. Beyond that, the introduction of MRI-compatible pacemakers and defibrillators may substantially reduce the generation of metallic artifacts more than ever before.
Conclusion
This work demonstrated that depending on their elemental composition and function, different implantable cardiac pacing devices can give rise to varying magnitudes of metal artifacts on CT images whereby artifactual over/under-estimated tracer uptake can be induced in attenuation corrected PET images. Misalignment between PET images and attenuation maps produced more severe metal-related pseudo-uptake, which highlights the clinical relevance of patient immobilization devices and the use of advanced motion correction algorithms. Qualitative and quantitative assessment proved that the devices powered by newly introduced battery compositions induce less severe streak artifacts. The reduction of streak artifacts of pacemakers and defibrillators calls for a more robust metal artifact reduction algorithm outperforming the MAR algorithm used in this work [22]. However, further assessment of the performance of this algorithm in clinical setting is still required.
Acknowledgments. This work was supported by the Research Center for Science and Technology in Medicine and Tehran University of Medical Sciences, Tehran, Iran, under grant no. 88/254 and 8596 and the Swiss National Science Foundation under grant no. 31003A-125246 and Geneva Cancer League.
Conflict of Interest. The authors declare that they have no conflict of interest.
References
1. Bailey DL (1998) Transmission scanning in emission tomography. Eur J Nucl Med 25:774–787
2. Zaidi H, Hasegawa BH (2003) Determination of the attenuation map in emission tomography. J Nucl Med 44:291–315
3. Alessio AM, Kinahan PE, Champley KM, Caldwell JH (2010) Attenuation-emission alignment in cardiac PET/CT based on consis-tency conditions. Med Phys 37:1191–1200
4. Zaidi H, Montandon M-L, Alavi A (2007) Advances in attenuation correction techniques in PET. PET Clinics 2:191–217
5. Kamel EM, Burger C, Buck A, von Schulthess GK, Goerres GW (2003) Impact of metallic dental implants on CT-based attenuation correction in a combined PET/CT scanner. Eur Radiol 13:724–728
6. Nahmias C, Lemmens C, Faul D, Carlson E, Long M, Blodgett T et al (2008) Does reducing CT artifacts from dental implants influence the PET interpretation in PET/CT studies of oral cancer and head and neck cancer? J Nucl Med 49:1047–1052
7. Lemmens C, Montandon M-L, Nuyts J, Ratib O, Dupont P, Zaidi H (2008) Impact of metal artefacts due to EEG electrodes in brain PET/CT imaging. Phys Med Biol 53:4417–4429
8. Hamill JJ, Brunken RC, Bybel B, DiFilippo FP, Faul DD (2006) A knowledge-based method for reducing attenuation artefacts caused by cardiac appliances in myocardial PET/CT. Phys Med Biol 51:2901– 2918
9. Abdoli M, Ay MR, Ahmadian A, Zaidi H (2010) A virtual sinogram method to reduce dental metallic implant artefacts in computed tomography-based attenuation correction for PET. Nucl Med Commun 31:22–31
10. Yu H, Zeng K, Bharkhada DK, Wang G, Madsen MT, Saba O et al (2007) A segmentation-based method for metal artifact reduction. Acad Radiol 14:495–504
11. Lemmens C, Faul D, Nuyts J (2009) Suppression of metal artifacts in CT using a reconstruction procedure that combines MAP and projection completion. IEEE Trans Med Imaging 28:250–260
12. Goerres GW, Ziegler SI, Burger C, Berthold T, Von Schulthess GK, Buck A (2003) Artifacts at PET and PET/CT caused by metallic hip prosthetic material. Radiology 226:577–584
13. Kaneta T, Takanami K, Wakayama Y, Sato A, Higano S, Fukuda H et al (2007) High-density materials do not always induce artifacts on PET/ CT: what is responsible for the difference? Nucl Med Commun 28:495– 499
14. Zhan C, Baine W, Sedrakyan A, Steiner C (2008) Cardiac device implantation in the United States from 1997 through 2004: a population-based analysis. J Gen Intern Med 23(Suppl 1):13–19 15. Goerres GW, Hany TF, Kamel E, von Schulthess GK, Buck A (2002)
Head and neck imaging with PET and PET/CT: artefacts from dental metallic implants. Eur J Nucl Med Mol Imaging 29:367–370 16. Schafers KP, Raupach R, Beyer T (2006) Combined 18 F-FDG-PET/
CT imaging of the head and neck. An approach to metal artifact correction. Nuklearmediziner 45:219–222
17. Heiba SI, Luo J, Sadek S, Macalental E, Cacavio A, Rosen G et al (2000) Attenuation-correction induced artifact in F-18 FDG PET imaging following total knee replacement. Clin Positron Imaging 3:237–239
18. Bujenovic S, Mannting F, Chakrabarti R, Ladnier D (2003) Artifactual 2-deoxy-2-[(18)F]fluoro-D-glucose localization surrounding metallic objects in a PET/CT scanner using CT-based attenuation correction. Mol Imaging Biol 5:20–22
19. Halpern BS, Dahlbom M, Waldherr C, Yap CS, Schiepers C, Silverman DH et al (2004) Cardiac pacemakers and central venous lines can induce focal artifacts on CT-corrected PET images. J Nucl Med 45:290–293 20. DiFilippo FP, Brunken RC (2005) Do implanted pacemaker leads and
ICD leads cause metal-related artifact in cardiac PET/CT? J Nucl Med 46:436–443
21. Zasadny KR, Wahl RL (1993) Standardized uptake values of normal tissues at PET with 2-[fluorine-18]-fluoro-2-deoxy-D-glucose: varia-tions with body weight and a method for correction. Radiology 189:847–850
22. Abdoli M, Ay M, Ahmadian A, Dierckx R, Zaidi H. (2010) Reduction of dental filling metallic artefacts in CT-based attenuation correction of PET data using weighted virtual sinograms optimized by a genetic algorithm. Med Phys 37:6166–6177