PHARMACOKINETICS AND DISPOSITION
Low allopurinol doses are sufficient to optimize azathioprine
therapy in inflammatory bowel disease patients
with inadequate thiopurine metabolite concentrations
Ivanka Curkovic&Katharina M. Rentsch&Pascal Frei&
Michael Fried&Gerhard Rogler&Gerd A. Kullak-Ublick&
Alexander Jetter
Received: 30 November 2012 / Accepted: 12 March 2013 / Published online: 16 April 2013 # Springer-Verlag Berlin Heidelberg 2013
Abstract
Purpose Recent studies in patients with inflammatory bow-el diseases (IBD) on thiopurine therapy suggest that too low 6-thioguanine nucleotide concentrations (6-TGN) and too high methylmercaptopurine nucleotide concentrations (MMPN) can be reversed by a combination therapy of allopurinol and low-dose thiopurines. To date, however, optimal dosing has not been established. The aim of this study was to evaluate the minimal allopurinol doses neces-sary to achieve adequate 6-TGN concentrations in combi-nation with low-dose azathioprine.
Methods A stepwise dose-escalation of allopurinol was performed in 11 azathioprine-pretreated IBD patients with inadequately low 6-TGN concentrations (<235
pmol/8 × 108 erythrocytes) and/or elevated MMPN
con-centrations (>5,000 pmol/8 × 108 erythrocytes) and/or
el-evated liver enzymes (alanine aminotransferase and/or aspartate aminotransferase levels one- to threefold the upper limit of normal). Six patients were recruited into an open study, and five were treated in the context of an individualized therapeutic approach. Adverse effects, azathioprine metabolites, liver enzymes and whole blood counts were monitored two to three times per month. Results Adequate 6-TGN concentrations were achieved with a combination of 25 mg allopurinol and 50 mg azathi-oprine in one patient and with 50 mg allopurinol and 50 mg azathioprine in nine patients. Median 6-TGN concentrations
(range) were 336 (290–488) pmol/8×108
erythrocytes after an 8-week-long intake of the final dose combination. One patient dropped out due to nausea after the first intake. MMPN concentrations and liver enzymes normalized im-mediately in all affected patients. All patients finishing the dose-escalation regimen tolerated the treatment without toxicity.
Conclusions Combination therapy with only 50 mg allopu-rinol and 50 mg azathioprine daily is sufficient, efficacious and safe in most IBD patients with inadequate thiopurine metabolite concentrations to optimize azathioprine-based IBD therapy.
Keywords Azathioprine . Allopurinol . Inflammatory bowel diseases . 6-Thioguanine nucleotide .
Methylmercaptopurine nucleotide
I. Curkovic
:
G. A. Kullak-Ublick:
A. Jetter (*)Department of Clinical Pharmacology and Toxicology, University Hospital Zurich, Rämistrasse 100,
8091 Zurich, Switzerland e-mail: alexander.jetter@usz.ch K. M. Rentsch
Department of Clinical Chemistry, University Hospital Zurich, Rämistrasse 100,
8091 Zurich, Switzerland
P. Frei
:
M. Fried:
G. RoglerDepartment of Gastroenterology and Hepatology, University Hospital Zurich, Rämistrasse 100,
8091 Zurich, Switzerland DOI 10.1007/s00228-013-1500-1
Introduction
In patients with inflammatory bowel disease (IBD), the thiopurine immunomodulators azathioprine and 6-mercaptopurine are used to induce and maintain remission. These substances are prodrugs that undergo a complex meta-bolic transformation resulting in the formation of the pharma-cologically active, immunosuppressive metabolites
6-thioguanine nucleotides (6-TGN) [1]. In a competing
path-way, the formation of methyl-thiopurines, such as the methylmercaptopurine ribonucleotides (6-MMPN), which are not directly immunosuppressive, is catalyzed by the en-zyme thiopurine methyl transferase (TPMT). Between 10 and 15 % of IBD patients are thiopurine refractory due to the preferential production of MMPN rather than active
6-TGN [1–4]. This may result in insufficient clinical response
and/or an increased rate of adverse effects [2,5]. Upon
dose-escalation in these patients, concentrations of 6-TGN often remain below the lower limit of the therapeutic range of
approximately 235 pmol/8×108erythrocytes (EC) [2] while
conversely 6-MMPN concentrations increase above a value of
5,000 pmol/8×108 EC, which has been associated with an
increased risk for hepatotoxicity [1]. Several studies have
recently provided evidence that IBD patients with an unfavor-able MMPN/6-TGN ratio can benefit from adding allopurinol to a reduced dose of thiopurines. The effects of this combina-tion therapy are (1) an increased produccombina-tion of 6-TGN, (2) a reduced formation of 6-MMPN, (3) a normalization of liver function tests and (4) better disease control and less
corticosteroid usage [6–12]. In terms of the metabolic
pathway of thiopurines, the shunting of metabolism to-wards the production of 6-TGN induced by allopurinol can be explained by inhibition of the enzyme xanthine oxidase. However, the mechanism by which allopurinol leads to a reduction in 6-MMPN concentrations has not yet been determined.
In previous studies and case reports, thiopurine doses were reduced to 25–50 % of the initial thiopurine dose and usually combined with daily doses of allopurinol 100–
200 mg [6–9,12–15] or even 300 mg [10]. The thiopurine
dose was reduced empirically or according to published recommendations. Accordingly, in their study, Ansari et al.
[9] reduced the thiopurine dose to 25–33 % of the
monotherapy dose as proposed earlier for the use of
thiopurine in renal transplant patients [16]. Other
re-searchers [15] reduced the thiopurine dose to 25 % of the
standard dose based on the report by Sparrow et al. [6].
However, the rationale for the selection of daily doses of 100–200 mg allopurinol has never been provided; this is particularly true in the case of the combination therapy in renal transplant recipients, where only 25 mg allopurinol
each second day was administered [16]. To our knowledge,
the optimal allopurinol–azathioprine combination dose has
not been studied systematically in IBD patients, and neither the minimally effective nor the maximally tolerated doses of this combination are as yet known. The appropriate dose adjustment with a decrease of both azathioprine and allopu-rinol drug exposures to a minimum may help to avoid toxic side effects. Accordingly, we conducted a dose-escalation study to evaluate the minimal allopurinol dose that, in combination with low-dose azathioprine, would result in therapeutic 6-TGN concentrations in azathioprine-pretreated patients. Our secondary objectives were to eval-uate whether maintenance of remission could be achieved with the low dose allopurinol–azathioprine combination and whether allopurinol influences TPMT activity.
Materials and methods Study procedures
We conducted a prospective, open, non-randomized single-center cohort study in patients with IBD. Six otherwise
healthy female azathioprine-pretreated patients with Crohn’s
disease (CD) and ulcerative colitis (UC) who had received
subtherapeutic 6-TGN concentrations (<235 pmol/8× 108
EC) and insufficient disease control despite adequate thera-py dosing and duration, and/or had elevated 6-MMPN
con-centrations (>5,000 pmol/8×108 EC) and/or elevated liver
enzymes [alanine aminotransferase (ALT) and/or aspartate aminotransferase (AST) of one- to threefold the upper limit of normal range (ULN)] were included in the study. Addi-tionally, we performed a stepwise dose-escalation of allopu-rinol in five male and female CD and UC patients who did not meet the study eligibility criteria (e.g. patients with relevant comorbidities or obesity), but who we considered would benefit clinically from the combination therapy of allopurinol and low-dose azathioprine. These patients were treated with allopurinol in combination with azathio-prine in the context of an individualized therapeutic approach.
The inclusion criteria were: age≥18 years, normal weight
with a body mass index (BMI) of 18–30 kg/m2
, a confirmed diagnosis of either CD or UC based on clinical, endoscopic and histologic criteria, normal TPMT activity (≥30 nmol MTG/gHb/h), azathioprine metabolite concentrations and/or hepatic azathioprine side effects as defined above. The main exclusion criteria were pregnancy or lactation, any current or previous immunosuppressive therapy except for cortico-steroids and/or azathioprine within 3 months before the first study-drug intake and any clinically relevant comorbidity (including malignancy and relevant infections in the last 3 months), as based on extensive medical history, physical examination, vital signs, routine laboratory screen and 12-lead electrocardiogram (ECG).
On day 1 of the study, the azathioprine dose was reduced to a dose of 50 mg once daily (qd) for one 28-day therapy cycle. Allopurinol 25 mg qd was added to the therapeutic regimen on day 1 of the second cycle, if the 6-TGN concentrations were
<350 pmol/8×108EC and if no relevant toxicity had occurred
(Fig. 1). A subsequent cycle with a higher dose of either
allopurinol or azathioprine according to the dose escalation
scheme (Fig.1) was started if the two aforementioned criteria
were not met, otherwise, the follow-up month was begun. In the case of severe toxicity, the combination was stopped and the patient excluded from the study. A total of seven cycles and 1 month of follow-up examination was the maximum scheduled study duration. The study patients received com-mercially available azathioprine 50 mg film-coated tablets (Imurek®; Glaxo SmithKline, Münchenbuchsee, Switzerland, and ProConcepta Zug, Zug, Switzerland), while allopurinol 25 mg and 50 mg capsules were manufactured by the Can-tonal Pharmacy of Zürich, Zürich, Switzerland.
The following study procedures were carried out repeated-ly in each patient: update of medical history, determination of adverse events, measurement of body temperature and
labo-ratory measurements three times per cycle (on study days 8–
10, 23–25 and 26–28) and a short physical examination. Crohn's Disease Activity Index (CDAI)/Rachmilewitz disease activity scores were evaluated to assess clinical response. Repeated laboratory measurements consisted of a complete blood cell count, creatinine, lactate dehydrogenase, AST, ALT, alkaline phosphatase, gamma-glutamyltransferase, total bilirubin, C-reactive protein and concentrations of the thiopurine metabolites 6-TGN and 6-MMPN in serum and blood, respectively. The TPMT activity was measured at screening and once every month thereafter because the effect of allopurinol on TPMT activity was not known at the time of study design. At the end of each cycle, the allopurinol dose was adapted according to tolerability, clinical response, hema-tology and clinical chemistry parameters and 6-TGN concentrations.
The dose-escalation was finished in an individual patient
when 6-TGN concentrations were≥350 pmol/8×108EC or if
moderate/serious toxicity occurred (Fig.1). The study ended
for each patient after 1 month of follow-up with an end-of study examination that consisted of laboratory measurements, physical examination, 12-lead ECG and CDAI/Rachmilewitz index assessment.
For the patients who were treated with the azathioprine– allopurinol combination in the context of an individualized therapeutic approach, dose increments were approximated to the study protocol. The azathioprine dose was initially reduced to 50 mg qd for 2–3 weeks, following which an allopurinol dose of 50 mg qd was added. Further monthly allopurinol dose increases in steps of 25 mg were intended in case of persisting subtherapeutic 6-TGN concentrations. Determination of adverse effects and metabolite and other
laboratory measurements were performed twice each month, and physical examinations were performed at least once each month. The patients took in commercially available azathioprine film-coated tablets (Imurek®) and commercial-ly available allopurinol tablets (either Mephanol® 100 mg, Mepha Pharma, Aesch BL, Switzerland, or Allopur® 100 mg, Sandoz, Cham, Switzerland), and each patient was responsible for dividing the tablets into the proper dose. The study was approved by the Ethics Committee of the Canton of Zurich, Switzerland and by the Swiss Health Au-thority Swissmedic, Bern, Switzerland. It has been registered at ClinicalTrials.gov with the number NCT00849368. Metabolite measurements
The cycle duration of 28 days was chosen to ensure that metabolite concentrations reflected steady state before a dose increase was performed, as the average half-life of
6-TGN in EC is 5 days [17–19].
Blood samples for the measurement of TGN and 6-MMPN concentrations were collected at least 5 h after the daily drug intake. Blood was collected in vacutainers supplemented with heparin (5 ml per sample), then spiked
with 100 μl of the antioxidant 1,4-dithio-D,L-threitol at a
concentration of 1 mg/ml and stored at−20 °C until
analy-sis. 6-TGN and 6-MMPN were measured using a validated, specific and selective high-performance liquid
chromatog-raphy (HPLC) method [20,21]. The HPLC system consisted
of a 9010 pump, a ProStar 410 autosampler and a 9050 UV-VIS detector (Varian, Sunnyvale, CA). The lower limit of
quantification (LLQ) was 50 pmol/8 × 108 EC for TGN
and 100 pmol/8 × 108 EC for MMPN. For values under
the LLQ, one-half of the LLQ was considered for further analysis.
TPMT activity
The TPMT assay (5 ml EDTA whole blood) was performed
according to Kröplin et al. [22] with minor modifications.
The Hb of the red blood cell lysate was measured by a Microcell counter F500 (Sysmex, Hamburg, Germany).
The sample volume of each patient consisted of 50 μl red
blood cell lysate (in accordance with the published method), whereas the extraction of the product was made with dichlormethane/2-propanol (90/10; v/v). The same HPLC system as for metabolite quantifications was used. The cut-off between normal and intermediate or low TPMT activity was defined as 30 nmol MTG/gHb/h.
Statistical analysis
Descriptive analyses were performed in all 12 patients. The results are presented as median values and ranges.
Results Study patients
The baseline characteristics of the study patients are presented
in Table1.
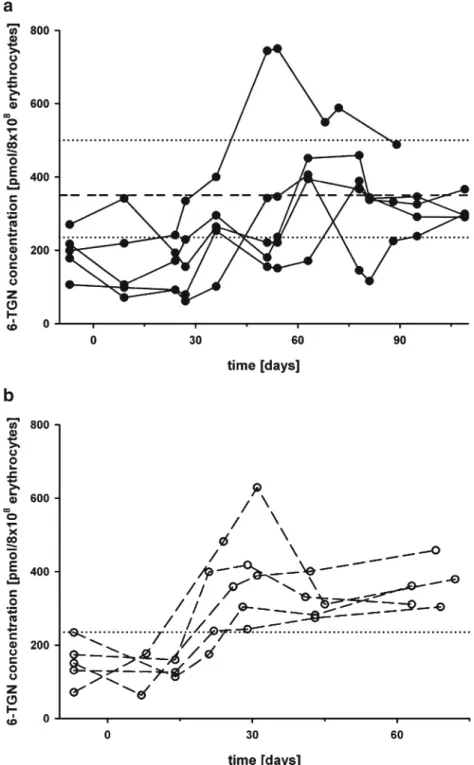
At inclusion, five of six patients had 6-TGN concentrations
below the recommended threshold of 235 pmol/8×108EC
(Fig.2a) and five of six patients showed elevated MMPN
concentrations of >5,000 pmol/8×108EC (Fig.3a). One of
these patients initially had normal 6-TGN. Four patients need-ed corticosteroids at study entry. Three patients had mildly elevated liver transaminases up to threefold the ULN (all considered to be azathioprine-related), one had an additional total bilirubin elevation (1.5-fold ULN). With the exception of slightly reduced neutrophil counts in one patient (1,220/μl, normal range 1,400–8,000/μl) and reduced lymphocyte counts in three patients (270–970/μl, normal range 1,500– 4,000/μl), all other laboratory values, including markers of inflammation, were normal.
In one of the two patients with CD, the CDAI of 162 points revealed clinically active disease (active disease >150 points). The other CD patient (CDAI 40 points) and all four patients with UC were in clinical remission (Rachmilewitz index <4 points).
Five of six patients completed the study. One patient achieved therapeutic 6-TGN concentrations with a combina-tion of allopurinol 25 mg qd and azathioprine 50 mg qd,
whereas four patients needed allopurinol 50 mg qd in
combi-nation with azathioprine 50 mg qd (Fig.2a). One CD patient
dropped out due to nausea at the azathioprine 50 mg dose level. The median 6-TGN and MMPN concentrations, TPMT activity, leukocyte and lymphocyte counts and ALT, AST and bilirubin values at the different azathioprine and allopurinol
dose levels are shown in Table 2. In all five patients who
completed the study, MMPN concentrations normalized dur-ing the first 8–10 days after the reduction of azathioprine to 50 mg qd (first cycle) and remained normal after the addition
of allopurinol to the therapeutic regimen (Fig. 3a). In both
patients with initially elevated liver enzymes who completed the study, liver enzymes normalized at the azathioprine 50 mg qd dose level and remained stable thereafter. One patient with initially normal liver enzymes developed elevated transami-nases up to 5.7-fold greater than the ULN in the course, which normalized at follow-up without any modification of the doses of azathioprine and allopurinol. At the end of the study labo-ratory examinations revealed normal liver enzyme levels in all patients. Lymphocytes were below the lower limit of normal range in three patients 1,190–1,300/μl at the end of the follow-up. Routine laboratory testing found no relevant abnormalities in any patient at the end of the study.
The CDAI values and the Rachmilewitz indices were be-low 150 and 3, respectively, throughout the study in four patients. The administration of corticosteroids was stopped in three patients after the addition of allopurinol. One UC patient with azathioprine and rectal corticosteroids at study
Fig. 1 Study dose escalation scheme.Asterisk If 6-thioguanine
nucle-otide (6-TGN) concentrations were <350 pmol/8 × 108erythrocytes
(EC) and there were no signs of major or minor toxicity, the next dose increment was initiated. Serious toxicity was defined as: neutrophils
<500/μl and/or hemoglobulin (Hb) decline of >2 g/dl and/or
thrombo-cytes <100,000/μl and/or lymphocytes <500/μl and/or rise in alanine/
aspartate aminotransferases (ALT/AST) of >50 % of the pre-study
examination value and/or diagnosis of pancreatitis independent of 6-TGN concentrations. Moderate toxicity was defined as: neutrophils
1,000–1,500/μl, Hb decline of <2 g/dl, thrombocytes 100,000–
140,000/μl, ALT/AST rise of 15–50 % of the pre-study examination.
In case of moderate toxicity: maintenance of dose level, in case of persistence for >1 month: study termination
entry, who was in remission based on clinical and endoscopic evidence, relapsed at the azathioprine 50 mg dose level (first cycle) and exhibited an intermittent liver enzyme increase. The therapeutic regimen of this patient was supplemented with oral prednisone until the follow-up period. The Rachmilewitz indices in this patient were 3, 11, 1, 4, 4 and 0. At the end of the study all patients were clinically in remission and were receiving neither oral nor rectal
corticosteroids. With the exception of the above-mentioned transient liver enzyme increase, all patients who finished the
study tolerated the azathioprine–allopurinol combination
without relevant signs of toxicity. TPMT activity
Thiopurine methyl transferase activity was normal in all patients at study entry and did not change after the addition
of allopurinol to the therapeutic regimen (Table2).
Non-study patients
The baseline characteristics of the five IBD patients who were treated with azathioprine and allopurinol in the context of an individualized therapeutic approach are
presented in Table 3. Concomitant diseases precluding
study inclusion were a chronic depression, bronchial
asthma, obesity (BMI 35 kg/m2), hypertensive and
cor-onary heart disease and primary sclerosing cholangitis. At the time of allopurinol initiation, two patients were receiving oral corticosteroids. All patients had subtherapeutic 6-TGN concentrations ranging from 71
to 234 pmol/8 × 108 EC (Fig. 2b) and three had elevated
MMPN concentrations of >5,000 pmol/8 × 108 EC
(Fig. 3b). The median 6-TGN and MMPN
concentra-tions, leukocyte and lymphocyte counts and ALT, AST and bilirubin values at the different azathioprine and
allopurinol dose levels are shown in Table 4. All
pa-tients had active disease based on clinical and/or endo-scopic evidence despite adequate azathioprine dosing of 2–2.5 mg/kg body weight and adequate therapy dura-tion. In one CD patient infliximab as an add-on therapy to oral budesonide and azathioprine was stopped 5 months before initiation of the azathioprine–allopurinol combination therapy due to intolerable pruritus and er-ythema. Following discontinuation of infliximab the pa-tient suffered from clinically active disease despite therapy with 9 mg oral budesonide qd in combination with azathioprine. The other CD patient had persistent abdominal pain and elevated calprotectin levels in the feces. One UC patient had recurrent bloody diarrhoea, persistently elevated calprotectin values in the feces and chronic iron deficiency, all of which are indicators of chronic active disease. One UC patient with pancolitis showed low 6-TGN concentrations and chronic active disease based on endoscopic findings. This patient re-fused tumor necrosis factor (TNF) blocker therapy. The third patient with UC had endoscopically confirmed moderate left-sided colitis and needed oral prednisone repeatedly.
All patients had normal TPMT activities in the beginning and during the dose-escalation procedure. Total bilirubin was
Table 1 Baseline characteristics of the study patients
Baseline characteristics Valuesa(range)
Median age (years) 40.5 (23–47)
Gender (female/male) (n) 6 / 0
Diagnosis (n)
Crohn’s disease 2
Ulcerative colitis 4
Median disease duration (years)
4.5 (0.5–20)
Crohn’s disease activity index (CDAI)
40–162 Rachmilewitz Index for ulcerative
colitis
1–3 Median body mass index
(kg/m2) 24.7 (20.4–37.5) Concomitant medications (n) ASA 3 Calcium 5 Vitamin D3 6 Corticosteroids (oral) 2 Corticosteroids (rectal) 3
Median AZAadose prior to study
entry (mg/day)
150 (125–200)
Median AZAadose prior to study
entry (mg/kg bw/day) 2.2 (2.0–2.9) Median 6-TGN concentrations (pmol/8×108EC) 208 (106–270) Median MMPN concentrations (pmol/8×108EC) 7,678.5 (2,351–16,928) Median TPMT activity (nmol MTG/gHb/h) 44.5 (34–57) Median leukocytes (/μl) 6,680 (2,390–8,120) Median lymphocytes (/μl) 1,240 (270–2,400)
Median total bilirubin (μmol/l) 10 (8–31)
Median ALT (U/l) 35.5 (15–105)
Median AST (U/l) 29.5 (21–45)
ASA, 5-aminosalicylic acid; AZA, azathioprine; bw, body weight; 6-TGN, 6-thioguanine nucleotide; MMPN, methylmercaptopurine nucle-otide; TPMT, thiopurine methyl transferase; ALT/AST alanine/aspar-tate aminotransferase
a
Normal ranges: Leukocytes, 3,000–9,600 /μl;
lymphocytes, 1,500–4,000 /μl; bilirubin, <21 μmol/l; ALT, 10–35 U/l (female)/10–50 U/l (male); AST, <35 U/l (female)/<50 U/l (male)
elevated in one patient with UC who had a genotypically
confirmed Gilbert’s syndrome [homozygous mutation in the
UGT1A1 promoter, genotype (TA)7/(TA)7]. The other four patients had normal liver enzymes. Routine laboratory examinations detected no pathological findings with the exception of moderate lymphopenia in four patients (750–1,250/μl, normal range 1,500–4,000/μl), mild
ane-mia in two patients (12.6 g/dl, normal range 13.4–
17.0 g/dl), mild leukopenia in one patient (2,850/μl, normal range 3,000–9,600/μl) and elevated C-reactive protein in one patient (6.3 mg/l, reference <5 mg/l).
All patients achieved stable therapeutic 6-TGN concen-trations with azathioprine 50 mg qd and allopurinol 50 mg
qd (Fig.2b). In all patients MMPN concentrations dropped
to normal values ranging between 228 and 1,581 pmol/8×
108 EC after the azathioprine dose had been reduced to
50 mg qd. MMPN concentrations remained low or dropped further in all patients during dose-escalation and follow-up
(Fig.3b). Liver enzymes remained normal in all patients. At
the end of the follow-up no patient had leukopenia or neutropenia. Except for stable lymphopenia, other signifi-cant laboratory abnormalities were not observed.
Fig. 2 Individual 6-TGN concentration vs. time courses in five patients participating in the dose-finding study (a) and in five patients who received the combination outside the study (b). a Patients received 50 mg azathioprine daily (median 0.7 mg/kg, range 0.6– 0.9 mg/kg) as monotherapy for 28 days before the combination was started. Dotted lines Therapeutic ranges, dashed line study target concentration. b Patients received 50 mg azathioprine daily (median
0.7 mg/kg, range 0.5–1.0 mg/
kg) as monotherapy for 2–
3 weeks, before the combination therapy was started. Dotted line Minimal recommended 6-TGN
concentration [235 pmol/8×108
At the end of the follow-up, all three non-study UC patients were in remission (two patients clinically and the patient with initially chronic-active pancolitis, both clinically and endoscopically). One CD patient was clinically in remission with intake of a reduced budesonide dose. One CD patient improved clinically, but still had very mild ileitis based on endoscopic evidence. Corticosteroid treatment had ceased in one of two patients with initial intake and had tapered in the other one. The allopurinol–azathioprine combination therapy was well toler-ated by all patients.
Long-term follow up
Although the scheduled follow-up according to the protocol was only 1 month, we can report a much longer follow-up for several patients. After 3 years of combination therapy, one non-study UC patient and one study CD patient are still in remission without signs of toxicity. After 1 year of ther-apy, one UC patient is in remission based on clinical and endoscopic findings. Another UC patient relapsed 6 months after study completion and finally required TNF-alpha blocker therapy. The follow-up for the other study and
non-Fig. 3 Individual methylmercaptopurine nucleotide (MMPN)
concentration vs. time courses in five patients participating in the dose-finding study (a) and in five patients who received the combination outside the study (b). a Patients received 50 mg azathioprine daily as monotherapy for 28 days, before the combination was started. b Patients received 50 mg azathioprine daily as
monotherapy for 2–3 weeks,
before the combination was started. Dotted line Upper limit of normal MMPN
concentrations (5,000 pmol/8×
study patients was 6–9 months. One patient had an acute relapse that was successfully treated with rectal corticoste-roids, and another patient still has mildly active disease. The other four patients have remained in remission, in two of these clinical remission was confirmed endoscopically.
T able 2 Results of the laboratory examinations of the study patients at the dif ferent dose levels Laborat ory paramete r Azathiop rine 50 mg/d ay Azathioprine 50 mg/day + allopurinol 25 mg/day azathiopri ne 50 mg/day + allopuri nol 50 mg/day a Mainten ance dose Days 8– 10 Days 23 –25 Days 26 –28 Days 8– 10 Days 23 –25 Days 26 –28 Days 8– 1 0 D ays 23 –2 5 Days 26 –28 Follow-up week 1 b Follow-up week 2 Follow-up week 4 6-TGN (pmol/ 8× 1 0 8EC) 106 (71 –341) 171 (92 –241) 155 (61 –334) 264 (101 –400) 221 (155 –744) 236 (151 –750) 400 (171 –451) 377.5 (145 –459) 339 (1 16 –344) 332 (225 –549) 325 (238 –588) 299 (290 –488) MMPN (pm ol/ 8× 1 0 8EC) 2,060 (350 –3,768) 9 1 7 (1 5 6– 2, 141) 2 0 6 (5 0– 3,391) 3 8 7 (5 0– 1,92 1) 36 6 (50 –1 ,282) 3 6 7 (5 0– 2,304) 368 (50 –404) 441 (1 13 –639) 352 (50 –561) 804 (141 –1,931) 630 (50 –1,455) 455 (50 –1,106) TP MT ac ti vity (n mo lM T G / gHb/h) 45 (35 –65) 44 (41 –52) 51 (41 –62) 46 (32 –66) Le uk oc yte s (/μ l) 8,160 (3,700 – 1 1,130) 7,6 00 (5,17 0– 16 ,3 90 ) 5, 300 (3 ,700 –8,830) 6, 23 0 (4 ,480-10, 520) L ymphocy tes (/ μ l) 1,70 0 (7 80 –3 ,1 4 0) 1, 140(1,0 30 –2, 760) 1, 81 0 (8 10 –2, 550) 1, 30 0 (1, 190 -2, 49 0) Bilirubin total (μ mol/l) 7( 5– 24) 8 (7 –27) 10.5 (6 –12) 10 (6 –15) AL T (U/l) 23 (16 –51) 25 (1 1– 1 1 6 ) 18.5 (10 –124) 1 8 (7 –26) AST (U/l) 24 (21 –29) 21 (15 –49) 23 (16 –45) 22 (14 –27) Normal ranges and abbreviations: See footnote to T able 1 Data are presented as the median (n = 5 ) with the range in parenthesis a Only 4 patients in this dose level b V alues for two patients are missing due to stay abroad
Table 3 Baseline characteristics of the non-study patients
Baseline characteristics Values (range)
Median age (years) 35 (20–68)
Gender (female/male) (n) 2/3
Diagnosis (n)
Crohn’s disease 2
Ulcerative colitis 3
Median disease duration (years) 9 (2–15)
Median body mass index (kg/m2) 24.8 (17.9–35.0)
Concomitant medications (n) ASA 3 Calcium 1 Vitamin D3 1 Corticosteroids (oral) 1 Corticosteroid s(rectal) 3 Antihypertensives 1 Statins 1 Thyroid hormone 1 Antiplatelets 1 Antidiarrheals 2 Spasmolytic drugs/analgesics 2 Antipsychotics 1 Benzodiazepines 1 Antiasthmatics 1 Colestyramine 1 Other vitamins 1
Median AZA dose prior to study entry (mg/day)
150 (100–250)
Median AZA dose prior to study entry (mg/kg bw/day) 2.2 (1.8–2.3) Median 6-TGN concentrations (pmol/8×108EC) 151 (71–234) Median MMPN concentration (pmol/8×108EC) 6,086 (2,794–13,783) Median TPMT activity (nmol MTG/gHb/h)a 52.5 (44–56) Median leukocytes (/μl) 7,250 (2,850–8,910) Median lymphocytes (/μl) 1,150 (750–2,040)
Median total bilirubin (μmol/l)b 7 (3–25)
Median ALT (U/l) 24 (12–50)
Median AST (U/l) 30 (22–34)
Normal ranges and abbreviations: See footnote to Table1
a
Value of one patient, which was assessed after the addition of allopu-rinol to the therapeutic regimen, was not included
bThe patient with an elevated total bilirubin had confirmed Gilbert’s
syndrome with a homozygous mutation in the UGT1A1 promoter [UGT1A1 promoter genotype (TA)7/(TA)7]
Discussion
Our study provides evidence that lower doses than previ-ously reported of both azathioprine and allopurinol are sufficient to achieve therapeutic 6-TGN concentrations and to reverse elevated MMPN concentrations and elevated liver enzymes in IBD patients with insufficient response to aza-thioprine monotherapy. In our patients, a maximum dose of 50 mg azathioprine in combination with 50 mg allopurinol was sufficient to achieve biochemical response. This low-dose combination was adequate not only in the setting of a clinical study, but also in patients who did not meet the strict study inclusion criteria.
The use of thiopurines is limited due to a lack of response
or side effects in approximately one-third of IBD patients [23,
24], and 10–15 % of patients do not achieve therapeutic
6-TGN concentrations and have preferential MMPN
metabo-lism [1–4]. Several studies have reported the favorable
meta-bolic interaction between thiopurines and allopurinol in IBD patients—if thiopurine doses are reduced to avoid excessive bone marrow toxicity. Dosing in these studies was usually based on recommendations from the literature. Typically, thiopurine doses were reduced to 25–50 % of the initial thiopurine dose and combined with allopurinol 100–300 mg
qd [6–9,12–15]. In one retrospective chart analysis, a starting
dose of allopurinol 50 mg qd in combination with thiopurines
was recommended [25]. Not only hepatotoxicity but also
myelosuppression is one of the most relevant side effects of
thiopurine therapy. In several of the thiopurine–allopurinol
combination trials, leukopenia rates ranged between 20 and
50 % [6,7,12,14]. None of our patients experienced
leuko-penia or neutroleuko-penia and, overall, the combination was well tolerated. In one patient with an acute UC flare after the azathioprine dose had been reduced to 50 mg qd, transami-nases increased after the initiation of oral prednisone
treatment; this increase was probably not related to allopurinol but to prednisone. Considering the overall good tolerability in our patients, lower dosing might be a helpful means to reduce toxicity rates.
There are, however, a number of unresolved questions about azathioprine dose adaptations. In our study, we defined
a target 6-TGN concentration limit of 350 pmol/8×108EC;
this had to be attained to begin with the follow-up period and to stop dose-escalation. According to the literature, the
thera-peutic range of 6-TGN concentrations is 235–450 pmol/8×
108EC [1,21,26]. However, the upper limit of 450 pmol/8×
108EC is not well corroborated by experimental data. As
thiopurine concentrations show a high variability between
two measurements, the target of 350 pmol/8 ×108EC was
chosen to ensure that the concentrations were reliably within the therapeutic range when the decision on further dose in-crease or initiation of the follow-up was made. Additionally, this value is roughly the mean of the therapeutic range.
The mechanism of how allopurinol increases 6-TGN concentrations and at the same time lowers MMPN concen-trations remains to be elucidated. An effect of allopurinol on TPMT activity could neither be demonstrated in vitro nor in
vivo [6,7], which is in accordance with our observation that
TPMT activity in the study patients did not change. Further-more, current data do not support the hypothesis that allo-purinol metabolites inhibit TPMT activity and thus decrease
MMPN production [7]. Other, so far unproven explanations
might be the induction of other enzymes, such as hypoxan-thine guanine phosphoribosyltransferase and/or of enzymes which biotransform MMPNs, or the inhibition of unknown TPMT co-enzymes by allopurinol or its metabolites. Alter-natively, the mere reduction of azathioprine dose may inter-fere with the activation of TPMT and thus lower MMPN concentrations simply by decreasing the azathioprine bur-den. To our knowledge, we are the first to perform an
Table 4 Results of the laboratory examinations at the different dose levels in the non-study patients
Laboratory parameter Azathioprine
50 mg/day
Azathioprine 50 mg/day + allopurinol 50 mg/day Maintenance dose azathioprine
50 mg/day + allopurinol 50 mg/day
Week 1–2 Week 1 Week 2 Week 4 Follow-up week 3–4
6-TGN (pmol/8×108EC) 126 (63–177) 359 (175–482) 389 (243–629) 311 (274–401) 361 (304–458) MMPN (pmol/8×108EC) 497 (228–1,581) 223 (50–958) 342 (50–743) 380 (100–750) 441 (50–1,790) Leukocytes (/μl) 5,640 (2,720–11,620) 5,900 (3,480–10,570) 6,000 (4,820–8,110) Lymphocytes (/μl) 1,210 (360–1,990) 1,290 (340–2,350) 1,110 (520–2,350)
Bilirubin total (μmol/l) 7 (3–34) 6 (2–30) 7.5a(2–15)
ALT (U/l) 13 (12–25) 16 (13–29) 17 (12–25)
AST (U/l) 24 (19–30) 22 (19–40) 28 (20–35)
Normal ranges and abbreviations: See footnote to Table1
Data are presented as the median (n = 5) with the range in parenthesis a
azathioprine dose-reduction phase prior to combination with allopurinol. MMPN concentrations were already normalized in all of our patients after the azathioprine dose had been reduced to 50 mg qd. Since the median MMPN remained stable after the addition of allopurinol to the therapeutic regimen, this observation supports the hypothesis that re-duction of the azathioprine dose burden is responsible for the rapid normalization of MMPN concentrations.
Three of five patients who completed the study needed oral and/or rectal corticosteroids to be in remission at inclusion, and one patient had active disease despite oral prednisone intake. All patients had one or more episodes of corticosteroid intake in the months preceding study entry. Thus, despite formally normal disease activity indices in most patients at inclusion, response to thiopurine monotherapy was unsatis-factory. Likewise, all non-study patients had clinically active disease prior to the addition of allopurinol to the therapeutic regimen. In conclusion, the good response to the allopurinol– azathioprine combination can not be explained simply by a mild disease activity prior to allopurinol addition.
Up to the present, seven of the ten patients remain in remission based on clinical and/or endoscopic findings. This number is in accordance with data from the literature de-scribing clinical response rates for the
thiopurine–allopuri-nol combination of >70 % [7,9,12]. However, our patients
took lower doses to reach the same result. Follow-up periods
of up to 71 months [8] have shown that thiopurines and
allopurinol can be safely and effectively combined for long time periods.
After study completion metabolite concentrations were
controlled every 3–6 months in our patients. Without any
obvious explanation, in one CU patient, 6-TGN
concentra-tions continued to rise above 500 pmol/8 ×108EC after
ap-proximately 6 months of combination therapy. This led to the azathioprine being reduced to an alternating dose of 50 mg and 25 mg qd, while allopurinol was maintained at 50 mg qd. According to the literature, the estimated half-life of 6-TGN in EC is 3–13 days, with an average of about
5 days [17,19,27]. However, much longer half-lives have
been reported [28], and our observation in one patient may
be explained by 6-TGN accumulation caused by prolonged elimination.
We decided to apply the allopurinol–azathioprine combi-nation therapy in five patients who did not fulfil the study inclusion criteria, as all five patients were insufficiently treated with azathioprine alone. The aim was to avoid a therapy escalation to a TNF-alpha blocker. With the exception of xanthine oxidase inhibitors, such as allopurinol, and aminosalicylates, which inhibit TPMT activity in high doses
[29], no pharmacokinetic drug interactions affecting
thiopurine metabolite concentrations are known for azathio-prine. Thus, the concomitant medications should not have had any significant influence on azathioprine pharmacokinetics.
Seven patients had lymphopenia at follow-up, which is a
recognized effect of thiopurines [30]. One of these patients
received corticosteroids at follow-up, which may have con-tributed to the lymphopenia. In the patient with the lowest lymphocyte count at inclusion (750/μl), lymphocytes
dropped to as low as 320/μl, but finally reached stable values
of approximately 500/μl at follow-up. Lymphopenia-related complications, such as infections, did not occur in any of the patients. Interestingly, two of the patients with normal lymphocyte counts relapsed.
A shortcoming of our study is the low number of patients. However, in view of the consistency of the clinical and biochemical results within and outside the study protocol, the number of relapses, which is comparable to treatments with higher doses, and the length of follow-up, it may be concluded that low doses of 50 mg allopurinol in combina-tion with 50 mg azathioprine qd are sufficient in most IBD patients with inadequate thiopurine metabolite concentra-tions. Even in patients with relevant comorbidities, the low-dose combination proved to be efficacious and safe. Tolerability can be optimized and thiopurine-induced toxic-ity, such as leukopenia, can be prevented by lowering doses to the required minimum. Further studies are necessary to confirm our findings in larger patient groups and to evaluate if the low-dose combination may also prevent toxicity and improve efficacy in thiopurine-naїve patients.
Acknowledgments We thank all patients for participation. Dr.
Stephan Vavricka, Zürich, Switzerland, and Dr. Daniel Heinrich, Bülach, Switzerland, are acknowledged for the allocation of some of the study patients.
Conflict of interest statement None.
Funding This study was funded in part by the Hartmann
Müller-Stiftung, Zürich (identification number 1244) and in part by the Matching Funds of the University Hospital of Zürich.
References
1. Dubinsky MC, Lamothe S, Yang HY, Targan SR, Sinnett D, Theoret Y, Seidman EG (2000) Pharmacogenomics and metabolite measurement for 6-mercaptopurine therapy in inflammatory bowel
disease. Gastroenterology 118(4):705–713
2. Osterman MT, Kundu R, Lichtenstein GR, Lewis JD (2006) As-sociation of 6-thioguanine nucleotide levels and inflammatory bowel disease activity: a meta-analysis. Gastroenterology
130(4):1047–1053
3. Cuffari C, Theoret Y, Latour S, Seidman G (1996)
6-Mercaptopurine metabolism in Crohn’s disease: correlation with
efficacy and toxicity. Gut 39(3):401–406
4. Leong RW, Gearry RB, Sparrow MP (2008) Thiopurine hepato-toxicity in inflammatory bowel disease: the role for adding
allo-purinol. Expert Opin Drug Saf 7(5):607–616. doi:10.1517/
5. Dubinsky MC, Yang H, Hassard PV, Seidman EG, Kam LY, Abreu MT, Targan SR, Vasiliauskas EA (2002) 6-MP metabolite profiles provide a biochemical explanation for 6-MP resistance in patients
with inflammatory bowel disease. Gastroenterology 122(4):904–
915
6. Sparrow MP, Hande SA, Friedman S, Lim WC, Reddy SI, Cao D, Hanauer SB (2005) Allopurinol safely and effectively optimizes tioguanine metabolites in inflammatory bowel disease patients not responding to azathioprine and mercaptopurine. Aliment
Pharmacol Ther 22(5):441–446
7. Sparrow MP, Hande SA, Friedman S, Cao D, Hanauer SB (2007) Effect of allopurinol on clinical outcomes in inflammatory bowel disease nonresponders to azathioprine or 6-mercaptopurine. Clin
Gastroenterol Hepatol 5(2):209–214
8. Ansari A, Elliott T, Baburajan B, Mayhead P, O’Donohue J,
Chocair P, Sanderson J, Duley J (2008) Long-term outcome of using allopurinol co-therapy as a strategy for overcoming thiopurine hepatotoxicity in treating inflammatory bowel disease.
Aliment Pharmacol Ther 28(6):734–741
9. Ansari A, Patel N, Sanderson J, O’Donohue J, Duley JA, Florin TH (2010) Low-dose azathioprine or mercaptopurine in combina-tion with allopurinol can bypass many adverse drug reaccombina-tions in patients with inflammatory bowel disease. Aliment Pharmacol Ther 31(6):640–647. doi:10.1111/j.1365-2036.2009.04221.x 10. Gardiner SJ, Gearry RB, Burt MJ, Chalmers-Watson T, Chapman
BA, Ross AG, Stedman CA, Huelsen A, Barclay ML (2011) Allopurinol might improve response to azathioprine and 6-mercaptopurine by correcting an unfavorable metabolite ratio. J
Gastroenterol Hepatol 26(1):49–54. doi:
10.1111/j.1440-1746.2010.06489.x
11. Panchal PC, Zielman CJ, Schuhmacher C, Valentine JF (2006) Allopurinol favorably affects AZA/6MP metabolism by lowering 6-MMP levels in patients with hepatoxicity from AZA/6MP with-out affecting red blood cell thiopurine methyltransferase (TMPT) activity. Gastroenterology 130(4):A660
12. Leung Y, Sparrow MP, Schwartz M, Hanauer SB (2009) Long term efficacy and safety of allopurinol and azathioprine or 6-mercaptopurine in patients with inflammatory bowel disease. J Crohns Colitis 3(3):162–167. doi:10.1016/j.crohns.2009.02.003 13. Rahhal RM, Bishop WP (2008) Initial clinical experience with
allopurinol-thiopurine combination therapy in pediatric inflamma-tory bowel disease. Inflamm Bowel Dis 14(12):1678–1682. doi:10.1002/ibd.20522
14. Witte TN, Ginsberg AL (2008) Use of allopurinol with low-dose 6-mercaptopurine in inflammatory bowel disease to achieve optimal active metabolite levels: a review of four cases and the literature.
Can J Gastroenterol 22(2):181–185
15. Gerich ME, Quiros JA, Marcin JP, Tennyson L, Henthorn M, Prindiville TP (2010) A prospective evaluation of the impact of allopurinol in pediatric and adult IBD patients with p r e f e r e n t i a l m e t a b o l i s m o f 6 m e r c a p t o p u r i n e t o 6
-methylmercaptopurine. J Crohns Colitis 4(5):546–552.
doi:10.1016/j.crohns.2010.03.004
16. Chocair P, Duley J, Simmonds HA, Cameron JS, Ianhez L, Arap S, Sabbaga E (1993) Low-dose allopurinol plus azathioprine/cyclo-sporin/prednisolone, a novel immunosuppressive regimen. Lancet
342(8863):83–84
17. Derijks LJ, Gilissen LP, Engels LG, Bos LP, Bus PJ, Lohman JJ, Curvers WL, Van Deventer SJ, Hommes DW, Hooymans PM (2004) Pharmacokinetics of 6-mercaptopurine in patients with inflammatory bowel disease: implications for therapy. Ther Drug
Monit 26(3):311–318
18. Sandborn W, Sutherland L, Pearson D, May G, Modigliani R, Prantera C (2000) Azathioprine or 6-mercaptopurine for inducing
remission of Crohn’s disease. Cochrane Database Syst Rev (2):
CD000545
19. Lennard L, Lilleyman JS (1989) Variable mercaptopurine metab-olism and treatment outcome in childhood lymphoblastic
leuke-mia. J Clin Oncol 7(12):1816–1823
20. Wusk B, Kullak-Ublick GA, Rammert C, von Eckardstein A, Fried M, Rentsch KM (2004) Thiopurine S-methyltransferase polymor-phisms: efficient screening method for patients considering taking
thiopurine drugs. Eur J Clin Pharmacol 60(1):5–10. doi:10.1007/
s00228-004-0728-1
21. Wusk B, Kullak-Ublick GA, Rammert C, von Eckardstein A, Fried M, Rentsch KM (2004) Therapeutic drug monitoring of thiopurine drugs in patients with inflammatory bowel disease or autoimmune hepatitis. Eur J Gastroenterol Hepatol 16(12):1407–1413 22. Kröplin T, Weyer N, Gutsche S, Iven H (1998) Thiopurine
S-methyltransferase activity in human erythrocytes: a new HPLC method using 6-thioguanine as substrate. Eur J Clin Pharmacol 54(3):265–271
23. Gisbert JP, Linares PM, McNicholl AG, Mate J, Gomollon F (2009) Meta-analysis: the efficacy of azathioprine and mercapto-purine in ulcerative colitis. Aliment Pharmacol Ther 30(2):126– 137. doi:10.1111/j.1365-2036.2009.04023.x
24. Prefontaine E, Macdonald JK, Sutherland LR (2009) Azathioprine or 6-mercaptopurine for induction of remission in Crohn’s disease. Cochrane Database Syst Rev (4):CD000545. doi:10.1002/ 14651858.CD000545.pub2
25. Govani SM, Higgins PD (2010) Combination of thiopurines and allopurinol: adverse events and clinical benefit in IBD. J Crohns Colitis 4(4):444–449. doi:10.1016/j.crohns.2010.02.009
26. Cuffari C, Hunt S, Bayless T (2001) Utilisation of erythrocyte 6-thioguanine metabolite levels to optimise azathioprine ther-apy in patients with inflammatory bowel disease. Gut 48(5):642–646
27. Sandborn WJ, Van OE, Zins BJ, Tremaine WJ, Mays DC, Lipsky JJ (1995) An intravenous loading dose of azathioprine decreases
the time to response in patients with Crohn’s disease.
Gastroenter-ology 109(6):1808–1817
28. Lennard L, Harrington CI, Wood M, Maddocks JL (1987) Metabolism of azathioprine to 6-thioguanine nucleotides in patients with pemphigus vulgaris. Br J Clin Pharmacol
23(2):229–233
29. Szumlanski CL, Weinshilboum RM (1995) Sulphasalazine inhibi-tion of thiopurine methyltransferase: possible mechanism for in-teraction with 6-mercaptopurine and azathioprine. Br J Clin
Pharmacol 39(4):456–459
30. Al Rifai A, Prasad N, Shuttleworth E, McBurney H, Pushpakom S, Robinson A, Newman W, Campbell S (2011) Natural history of azathioprine-associated lymphopenia in inflammatory bowel dis-ease patients: a prospective observational study. Eur J Gastroenterol