HAL Id: inserm-00428687
https://www.hal.inserm.fr/inserm-00428687
Submitted on 29 Oct 2009HAL is a multi-disciplinary open access archive for the deposit and dissemination of sci-entific research documents, whether they are pub-lished or not. The documents may come from teaching and research institutions in France or abroad, or from public or private research centers.
L’archive ouverte pluridisciplinaire HAL, est destinée au dépôt et à la diffusion de documents scientifiques de niveau recherche, publiés ou non, émanant des établissements d’enseignement et de recherche français ou étrangers, des laboratoires publics ou privés.
Liver vessels segmentation using a hybrid geometrical
moments/graph cuts method.
Simon Esneault, Cyril Lafon, Jean-Louis Dillenseger
To cite this version:
Simon Esneault, Cyril Lafon, Jean-Louis Dillenseger. Liver vessels segmentation using a hybrid ge-ometrical moments/graph cuts method.. IEEE Transactions on Biomedical Engineering, Institute of Electrical and Electronics Engineers, 2010, 57 (2), pp.276-83. �10.1109/TBME.2009.2032161�. �inserm-00428687�
Liver vessels segmentation using a hybrid
geometrical moments/graph cuts method
Simon Esneault*,** Cyril Lafon***,**** Jean-Louis Dillenseger*,**
From:
* INSERM, U642, Rennes, F-35000, France;
** Universit´e de Rennes 1, LTSI, Rennes, F-35000, France; *** INSERM, U556, Lyon, F-69003 France.
**** Universit´e Claude Bernard Lyon 1, Lyon, F-69000 France. Corresponding author:
Jean-Louis Dillenseger
Laboratoire Traitement du Signal et de l’Image, INSERM U642, Universit´e de Rennes I,
Campus de Beaulieu, 35042 Rennes Cedex, France. tel: +33 (0)2 23 23 55 78 fax: +33 (0)2 23 23 69 17 email: [email protected]
Abstract
This paper describes a fast and fully-automatic method for liver vessel segmentation on CT scan pre-operative images. The basis of this method is the introduction of a 3-D geometrical moment-based detector of cylindrical shapes within the min-cut/max-flow energy minimization framework. This method represents an original way to introduce a data term as a constraint into the widely used Boykov’s graph cuts algorithm and hence, to automate the segmentation. The method is evaluated and compared with others on a synthetic dataset. Finally, the relevancy of our method regarding the planning of a -necessarily accurate- percutaneous high intensity focused ultrasound surgical operation is demonstrated with some examples.
keywords
HCC, liver Segmentation, graph cuts, geometrical moments, vessels extraction.
1
Introduction and state of the art
Hepatocellular carcinoma (HCC) is the third most common cause of mortality from cancer, with incidences rising in western countries [1]. At an early stage, HCC is commonly confined to a solitary mass which is potentially curable by a percutaneous surgical resection such as percutaneous ethanol injection, or radiofrequency ablation [2]. Radiofrequency treatment is one of the most widely used HCC therapies. The main drawback of radiofrequency treatment is that the heating process is locally disturbed by the presence of nearby blood vessel acting as coolers, resulting in a partial therapy.
In addition to the hyperthermic interstitial techniques, ultrasound surgery is being proposed within this interstitial applicators context at an experimental stage [3, 4]. The therapeutic ultra-sound device is composed of a small (3 mm x 10 mm) planar ultrasonic transducer encapsulated in a∅ 4 mm cylindrical interstitial applicator. The surgical protocol is the following: 1) the ap-plicator is set within or on the boundary of the hepatic tumor under ultrasound image guidance; 2) the therapy consists in a sequence of high intensity ultrasound shots that can be controlled in intensity and duration. After each exposure the applicator can be rotated by a specific angle in order to heat the tissues according to the tumor geometry. The advantages to this ultrasound technique include more precise control in depth and direction than other interstitial heating modalities and perhaps more adaptability to the specific treatment, i.e. for compensating the
blood vessels cooling influence.
Like any other minimally invasive image guided therapy, clinical application requires the definition of a precise planning at the pre-operative stage as well as during the intervention itself, including the tracking and the controlling of the therapeutics effects. Thus, the anatomical description of the tumor neighboring hepatic vessels is of crucial importance for therapeutic planning for two different reasons: 1) to determine the best path for the interstitial applicator, and 2) to provide the information for an accurate dosimetry simulation which takes the blood vessels presence into account.
The segmentation of the detailed hepatic volume with all its anatomical components is still an open question [5]. In previous work, we proposed graph cuts based technique which enabled the segmentation of the liver and tumor [6]. However, this method gave poor results when used to solve the vessel segmentation problem. The poor results are mostly due to the shrinking bias problem that also occurs when working with level-set or snakes. For local thin and elongated structures, the summed cost of the cuts along the natural boundary will be higher than the one across the structures, leading to an incorrect segmentation. The natural response to avoid this bias is to locally constrain the graph with higher cost value along thin boundaries.
Several specific methods have been proposed to segment vessels in a CT volume [7]. These methods adapted from generic segmentation algorithms mainly rely on intensities analysis, gen-eralized cylinders approximations, multi-scale or skeletization schemes, or deformable model approaches. Selle et al. [8] for example define an optimal intensity threshold using region-growing, but their method appears to only be suitable for large vessels. Level-sets methods [9] have also proved to be suitable for MRA-segmentation but require good initialization and typ-ically use speed functions which implicitly assume good contrast data. These two methods are typical examples of generic segmentation algorithms adapted to the vessel extraction. But usu-ally such methods faced the complexity of the vascular trees and their images (thin elongated structures, low contrast, inhomogeneous structures, high number of bifurcations, noise induced by the imaging of the micro-vascularization, etc).
An other approach is to take the vascularization tree-like topology into account by tracking the vessel. In this class of method, starting from a focus known to be a vessel, the centerlines of the vascular tree are iteratively tracked using local features such as Hessian [10] or geometrical moments [11]. For example, some previous work based on the vessel local characterization by geometrical moments, belongs to this category and has shown some good abilities on Magnetic
Resonance Angiography [11], and on CT Scan for lower limbs vessels extraction [12]. In both cases, the algorithm follows the same iterative scheme: from interactively selected seed points, the local radius, orientation and center of the vessel are estimated with an iterative process using 3D the geometric moment. After local convergence, the process is then repeated in the direction of the previously detected orientation, hence tracking the vessel local features. This method is fast and robust, but requires special routines to handle branch points and some user-interaction to initialize. The authors also reported that in case of high curvature or complex bifurcation the tracking can be stopped. These kinds of drawbacks seems to be generally shared by the other tracking approaches. Therefore such class of methods is not suitable in our segmentation scheme as the liver vessel tree presents a high vascularization with a lot of bifurcations. We propose to take advantage of both approaches in a quick, accurate and fully automatic method for the hepatic vessel segmentation. Initially, it is first based on an automatic tubular structure detection using geometrical moments. The detected structures are described as vessel presence probabilities and set as constraints in the graph cuts segmentation. The outline of this paper is as follows: Section 2 will present the method and describe our approach to insert data related information into a graph cuts segmentation. Some results are presented in Section 3 and a conclusion is given in Section 4.
2
A hybrid method for the vessel extraction: General scheme
The proposed approach is principally based on two classes of methods: a 3-D geometrical moment-based detector to localize the center of the vessel, its diameter and its local direction. This model is then used as a local constraint into a graph cuts algorithm which delivers the final segmentation.
2.1 3-D Geometrical moment tubular structures detection process
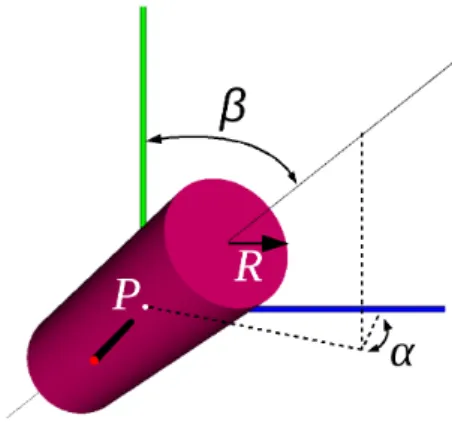
The method relies on the local modeling of the vessels using geometrical moments [11]. Near a specific voxel, a vessel is locally modeled as a cylinder described by the following parameters (Fig. 1): its orientation (α, β), its position P at a subvoxel accuracy, and its radius R. With the assumption of an a priori knowledge of the mean intensities of the vessel and the background, the model’s parameters can be analytically identified from the gray level geometrical moments computed in a spherical window centered on the voxel. The moment-based local model es-timation has proved to be robust comparatively to other methods, because of its integrative
Figure 1: Local vessel model, with α, β the orientation angles, P the center position and R the radius.
computation nature [13].
Classically this model is used in a vessel spatial tracking scheme from interactively selected seeds points [11, 12]. In our specific case, the hepatic vascularization is characterized by a high number of bifurcations which can not be directly handled by the tracking process.
Complex geometrical tracking algorithm is not necessary for this method; therefore we propose to use this model in a slightly different manner: 1) the local cylinder detector is applied on the voxels of the whole volume in an exhaustive way; 2) the voxels (and their associated local model) which present the highest probability to be in a vessel are selected; 3) the results of this research is a set of local models of the vessels not necessarily connected to one another. This information is then used in the graph cuts process in order to achieve the global vessels segmentation.
The following is a detailed scheme of this detection:
Initialization: Given that the focus is to design a segmentation framework fast enough to be used in a clinical routine, we first define a research subarea in order to restrict the amount of voxel candidates for detection. The idea is to roughly select all voxels of the volume which potentially could be in a vessel. For this, we apply thresholding, rated median filter and 3-D skeletization to the volume. The different filters parameters are chosen to achieve a selection with a high sensitivity (nearly all of the vessels voxels are correctly classified) and a small specificity (not all of the background voxels are correctly classified). Hence, a map A* of candidate voxels Pi remains.
Local modeling and detection: a multi-scale tubular structure detection method is applied for each candidate point Pi of A*. It follows an iterative scheme [12]:
1. Position refinement: an iterative process moves until convergence the center of the local spherical window toward the center of gravity with a subvoxel precision using the geometrical moments of order 1.
2. Cylinder parameters estimation: the orientation and the radius of the estimated cylinder in the 3D space are computed from analytical expressions developed in [11] using the three-dimensional geometrical moments up to order 2.
3. Resolution refinement: the local spherical window size is adapted according to the estimated vessel radius.
4. Decision: if the local spherical window converges within a specific margin, the esti-mated cylinder is retained and appended to a candidate list.
The result of this detection step is a list of cylinder parameters in the 3-D space. None of these cylinders are explicitly connected to each other; they give information about the likelihood of the presence of a vessel. These parameters will be used as local shape information for the graph cuts’ global optimization.
2.2 Graph cuts global optimization and segmentation
A number of problems in computer vision can be expressed as energy minimization. Within this class of methodologies, Greig et al. [14] then Boykov et al. [15] proposed an energy minimization method based on the partitioning of a graph into two sub-graphs by a minimum cut/maximum flow algorithm (min-cut/max-flow graph cuts).
This graph partitioning algorithm is perfectly adapted to a volume binary classification is-sue [16, 17]. Moreover, the transcription of a segmentation problematic into energy minimization makes it possible to encode various characteristics of the data: classification training, degree of similarity between voxels of the same class (region based approaches), changes between classes (boundary based approaches), and so on. As it was demonstrated in [15], the total energy mini-mization for the volume segmentation follows a Gibbs model with a data term and a smoothing term. Therefore, the method is considered to be globally optimal with respect to an objective function for segmentation.
The segmentation problematic is described by a directional flow graph [16, 17]. The nodes set is defined by two particular nodes ”source” S and ”sink” T called terminal nodes and respectively representing in our case the class ”vessel” and the class ”background”. The other nodes are
intermediate nodes which correspond to the voxels of the 3D volume. Directed weighted links connect the nodes. The link topology and the initial costs assigned to these links are derived from the energy function to minimize. Two kinds of links must be identified:
• the t-links connecting voxel to the terminals S and T. ’t’ stands for terminal. The initial
costs are derived from the data term and serve as segmentation hard constraints.
• the n-links between a pair of intermediate nodes (voxel). The initial costs will code the
dissimilarity between the two voxels. ’n’ stands for neighbors, meaning that the two nodes are usually close to each other, with an 8- or 26-neighborhood connectivity.
As initially introduced in Boykov’s papers, the energy function used for segmentation is as follows:
ET= Eregion+ Eboundary (1)
with a data term Eregion, an energy coding the probability that a voxel belong to the class ”object” or ”background” set on the t-links and a smoothing term Eboundary, an energy coding the local discontinuity between a pair of voxels represented by the n-links.
Once the graph is build with the correct weight assigned to each links according to some relevant cost functions, a min-cut/max-flow combinatorial optimization algorithm [18, 19] is applied to the graph.
In the original version of the graph cuts algorithm, the regional term cost function is defined after an interactive process. The user interactively selects one or more points representing the object, and other points representing the background. Histograms are built from this labeling and probability density functions are extracted for each class and encoded in the graph.
In our method, instead of using these interactive labeling processes, we propose the pre-viously extracted information as part of the segmentation cost function in two ways: first as automatic assignment of the regional term Eregion, and also as a new data term energy Evesselto constrain the graph cuts optimization to extract the vessels. The new energy equation is now:
ET= λ1· Eregion+ λ2· Eboundary+ λ3· Evessel (2) with λ1,2,3 weights which control the balance between the energy terms.
The energy function described in (2) is encoded in a graph. The following is an explanation of how we translate each of these three terms as weighted arcs in the graph.
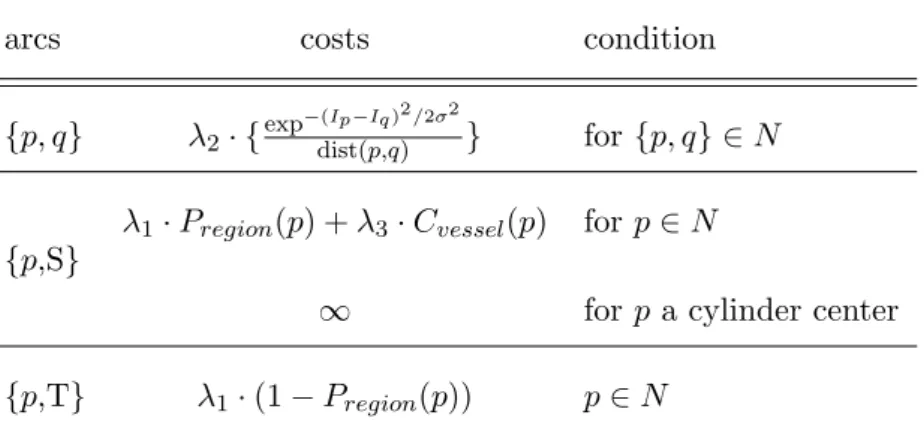
Table 1: Initial weights for the graph cuts segmentation.
arcs costs condition
{p, q} λ2· {exp
−(Ip−Iq)2/2σ2
dist(p,q) } for{p, q} ∈ N
{p,S} λ1· Pregion(p) + λ3· Cvessel(p) for p∈ N
∞ for p a cylinder center
{p,T} λ1· (1 − Pregion(p)) p∈ N
The initial costs associated to the Eboundarysmoothing term are built as suggested by Boykov et al. using an ad hoc function which penalizes discontinuities between adjacent voxels (Table 1). The initial costs related to the data term Eregion reflect the probability that a specific voxel belongs to respectively the vessel and background classes. We used the position P of each detected cylinders to automatically label some voxels as ”vessel”. The histogram built from the values on these points is used after normalization to define the probability density function
Pregion. The initial costs related to the data term Evessel reflect the probability of a vessel
presence. This information is given by the cylinders estimated in the detection process. The idea is to diffuse the strong information given by the cylinder to its neighborhood. The diffusion is promoted along the vessel axis and constrained perpendicularly to the axis according to the vessel radius (see appendix). Using this function we create a local 3-D costs map for each cylinder. The final costs map Cvessel is the result of the combination of all the individual maps
in order to take overlapping information into account.
Let N be the set of voxels or volume, {p, q} a set of neighbor nodes, the initial weights of the individual graph links are assigned to the graph according to Table 1.
Once the graph is built, min-cut/max-flow graph cuts algorithm is performed in order to extract the vessels.
3
Results and discussion
3.1 Quantitative evaluation
In order to validate our method, we create a 3D digital vessels phantom. For geometry simplicity, our phantom is based on a real coronary artery tree description. The model is constructed from 6 extracted centerlines [20] and ad-hoc chosen vessel diameters set, hence creating a realistic
Figure 2: Step of the phantom construction: centerlines, vessel mesh and a MIP of the final volume. The parameter set of this phantom is: {r = {2, 6}mm, v = 130, b = 100, σnoise= 15}.
mesh.
A rasterization algorithm enables us to get a binary volume with the following characteristics: size of 303 x 413 x 448 voxels and spacing of 0.7mm x 0.7mm x 0.7mm. The micro-vascularization is modeled by additive white Gaussian noise. The different parameters controlling the phantom are: r the vessel radius variation, b the background value, v the vessel value and σnoise the
Gaussian noise standard deviation. Fig. 2 presents the several steps of the phantom construction: centerlines, vessels mesh and a MIP of the final phantom volume with noise.
For the tests, a set of phantoms is created. The vessel geometry is fixed to r decreasing from 6mm (main branches) to 2mm, v = 130 and b = 100 with σnoise varying from 0 to 50 with
a step of 5.
We choose to compare our hybrid method with two others segmentation methods: a basic seeded region growing and the standard graph cuts algorithm. The specifications of each method are:
• The region growing is performed with 26-connectivity, with a single seed point interactively
selected inside the vessel, and an aggregation criteria based on a voxel intensity threshold fixed at v− (σnoise/2).
• The graph cuts algorithm is also performed with a 26-connectivity, the seed points are
• The parameters of the hybrid method (cf. Table 1) are set to: λ1 = 0.5, λ2 = 0.3, λ3= 0.2,
σ = 0.20 with a 26-neighborhood connectivity.
For these two later methods, the graph was built using the Boykov-Kolmogorov’s C++ graph cuts implementation1.
The binary classification results of each of the three methods are compared to the initial model on two different ways: the mutual overlap approach and statistics on the signed distances between the borders of the model and these estimated by the segmentation methods.
The mutual overlap approach also known as the Dice evaluation, is based on computing the area of overlap between ground truth and a segmented region.
MM O =
2M O
A1+ A2
(3) With A1 the area of the segmented region, A2 the area of the ground truth (the phantom) and M O the area of their mutual overlap.
Fig. 3 represents the Dice measure of the 3 methods for a parameter σnoise varying from 0
to 30. It clearly shows the robustness of our method compared to the others. With small noise all the three methods shows similar results. However, with higher σnoise, region growing (σnoise
above 15) and the classical graph cuts (σnoise above 25) failed to extract the vascular tree. For
the region growing algorithm, the simplicity of the aggregation criteria is sufficient to explain its failure. The classical graph cuts seems more robust for reasonable noise. However when the noise increase the smallest branches are no more detected. Some more interaction by adding seed points could improve the result. But practically in extreme noisy conditions even with more than 100 seeds points the algorithm failed to detect all the branches and/or to connect them. So our method seems to be the most robust in such conditions. In our opinion, this advantage is induced by the geometrical moment computation which is robust to noise because of its integrative form. Moreover, the advantage to add a robust geometrical constraint to the standard graph cuts is highlighted in this test.
With σnoise above 30, our method also misses the smallest vessels. However by enhancing
the weight of the geometrical moment energy (e.g. λ1 = 0.3, λ2 = 0.1, λ3 = 0.6) our method is still able to detect the vessels (see Fig. 3, label: Hybrid-λ3), but with an overestimation of the vessel radius. This can be explained by the fact that the noise near the vessel border is detected by our multi-scale estimator as small cylinders. With a high λ3, these small cylinders
1
Figure 3: Dice measure of the different methods vs σnoise. Region growing (RG); classical graph
cuts (GC); Hybrid method with balanced energies (Hybrid); Hybrid method with enhanced geometrical moment energy (Hybrid-λ3).
are included in the graph cuts scheme as high constraints, leading to locally over-estimated vessel radii.
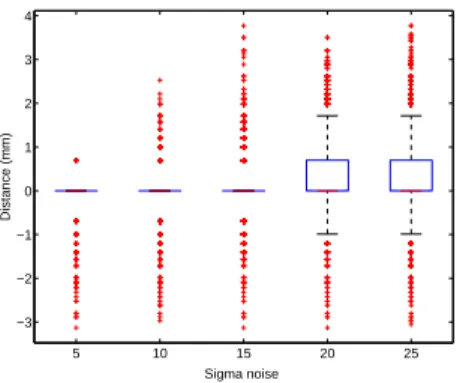
On the second evaluation, we perform some statistical measurements on the signed euclidian distances between each surface point of the model vessels border to the closest point of the estimated vessels. Because the assumption of normality of the collected distances distribution is not verified, we analyze this distribution using boxplots [21]. These plots display the maximum and minimum values as well as a central box indicating the location of the 50% central values between the lower and upper quartile. Outliers are also detected and displayed on these plots. Fig. 4 presents the boxplots of the distances distribution for σnoise varying from 5 to 25. Our
algorithm seems to be quite accurate: for a noise variance below 15 all the distances except outliers equal zero; for higher noise variance the distribution inter-quartile range is always inferior to 0.7 mm and the min and and max value are respectively -1 mm and √3 mm. As previously discussed, the radius over-estimation phenomenon is also observed on the boxplots as the inter-quartile range is spread beetween 0 and a positive value. Fig. 5 compares the accuracy of the three methods in presence of noise (σnoiseof 20 in this case). The region-growing method
is clearly unsuitable at this level of noise. The classical graph cuts and our methods show boxplots with almost a similar range. However, our method has a smaller inter-quartile range, min and max a bit closer and less outliers. This is to say that the introduction of the cylindrical model enhance the accuracy of the segmentation
5 10 15 20 25 −3 −2 −1 0 1 2 3 4 Distance (mm) Sigma noise
Figure 4: Distance to the border boxplots for the hybrid method with σnoise varying from 5 to
25.
Region growing Graph cut Hybrid
0 10 20 30 40 50 60 70 80 Distance (mm)
Figure 5: Distance to the border boxplots for the three different methods with a variance of 20.
3.2 Segmentation results on real data
This algorithm has been tested on clinical abdominal CT volumes acquired during 4 different contrast medium diffusion phases: before injection, arterial, portal and delayed phases. Each of the volumes has the following properties: approximately 120 512x512 pixels slices with a slice resolution of 0.7 mm and an inter-slice spacing of 2 mm. The parameters set for the method in the presented result is (cf. Table 1): λ1 = 0.3, λ2 = 0.1, λ3 = 0.6, σ = 0.14 with a 26-neighborhood connectivity. A bounding box region of interest is interactively defined in order to minimize the memory impact of the graph.
First, we compare the ability of the three previously mentioned methods to segment the vascular trees on real data (the portal phase volume in this case). On Fig. 6, we can notice that the region-growing is biased by the noise induced by the micro-vascularization. The classical graph cuts is less sensitive to this noise. However some branches are not detected (e.g. under the red circle). This figure highlight the ability of our method to better extract and connect branches in a real situation, thus without any manual interaction.
Figure 6: Comparison of the 3 segmentation methods: a) Region-growing b) Graph cuts c) Hybrid method. Red circles highlight the ability of the different methods to extract and connect a specific vascular branch.
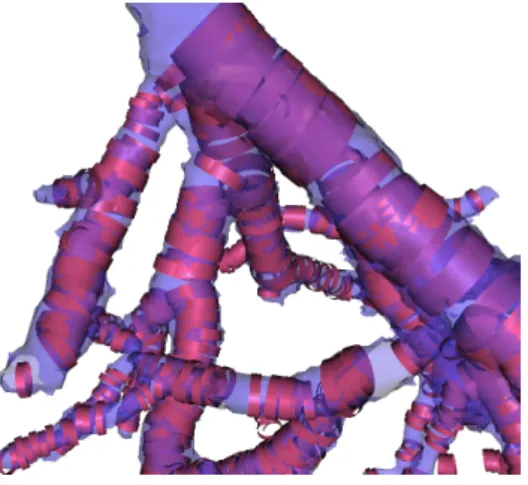
Figure 7: Visualization of the extracted vascular structures superimposed on the detected cylin-ders seen by transparency.
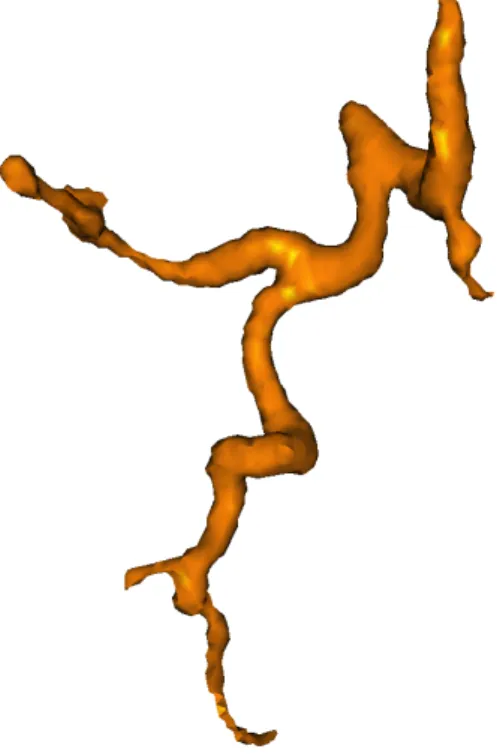
Figure 8: Visualization of the portal (dark blue) and hepatic (yellow) venous trees.
We will now show some segmentation results obtained on two different diffusion phases’ volumes acquired during a patient study. We applied our method on the portal phase volume (Fig. 7, 8, 9) which presents the highest vascular contrast enhancement for the venous trees and also on the arterial phase volume (Fig. 10). Due to the fact that we did not perform a registration between these two volumes, the segmentation results will be shown separately.
Figure 9: Visualization of the tumor and its neighboring vascularization.
Figure 10: Visualization of the hepatic arterial tree.
The use of the local geometrical model to constrain the graph cuts can be directly seen on Fig. 7. In this figure we superposed the final extracted vascular structure on the local cylinder models estimated by our geometrical moments based detector. We can observe the good correlation in diameter, position and orientation between the identified models and the final extracted vessel. We can also see that the estimated local models constrain the graph cuts process in a correct manner.
The exhaustive application of the process on the complete volume data allows to extract automatically and simultaneously the main branches of both the portal (in dark blue) and hepatic (in light yellow) venous vascular trees (Fig. 8). Even if the two trees were extracted simultaneously, they were unconnected one another. It was so easy to label them manually.
The method is accurate enough to characterize the tumor neighboring vascularization (Fig. 9). In this picture, the tumor has been separately characterized using the classical graph cuts method [6]. We then applied the hybrid method in the region of interest around the tumor. In
this region, we adapted the intensities a priori in order to recover thinner vascular branches. Such results are directly related to our medical problematic and can serve as the anatomical description for a patient specific dosimetry modeling and planning.
On Fig. 10, the hepatic artery was extracted when we applied our algorithm on the early acquisition phase study. In our actual stage of research, the venous trees and the arterial tree were extracted and displayed separately but a non-rigid registration scheme permitting them to mix together, allowing a fully integrated description of the hepatic vascularization.
The overall computation process (detection and graph cuts segmentation) takes between 10 and 100 seconds on a 1,6 GHz Xeon, 4 Go RAM PC, according to the size of the candidate voxels map.
3.3 Discussion
The moment based detector gives consistent local information about the vessel diameter. The integration of this information as a constraint in the graph cuts algorithm allows extracting the hepatic vessel trees. An extensive validation on synthetic data has shown the superiority of our algorithm compared to the classical graph cut, both in term of robustness and accuracy. The Dice measure and overall distance between the phantom and the segmented data are relevant. Moreover it has been shown that if the goal of the segmentation is the detection of all the branches versus radius accuracy, we can enhance the λ3 value, hence enabling the extraction in extreme noisy condition.
The final result on real dataset shows accurate vessel diameter estimation and good tree tracking which takes the bifurcations into account. As previously expected, our method allows us to overcome the shrinking bias on elongated structures which is the weak point of the graph cuts method, while simultaneously correctly handling the bifurcations by reconnecting the vascular subtrees, problematic in geometrical tracking. Our objective to describe the tumor’s neighboring vascularization is also achieved.
However, some drawbacks remain. The drawbacks are primarily caused by the fact that the local model detection/estimation scheme is exhaustively applied on the whole volume, in opposition to a geometrical tracking:
• The diameter estimation is computed from intensities a priori. In our case, these a priori
are global. When the tissues are very heterogeneous, this intrinsic limitation can lead to a diameter mis-estimation or in the worst case scenario, the thinnest part of the vessel not
being detected. This problem can be solved by an adaptive estimation of the intensities a priori.
• Background noise can induce some false detections. Thus, filters such as 3D anisotropic
diffusion or 3D Gaussian can be applied on the volume before the segmentation process.
• This method gives better results when applied on an anisotropic dataset. Indeed, when
an interpolation is applied in order to recover isotropy, some noise can be elongated along the interpolation direction and then be estimated as cylinder-like structures, resulting in false detections.
In conclusion, this method presents promising results. It is sufficiently generic to segment any vascular tree when the few parameters (intensities a priori, minimum and maximum vessel radius size) are correctly adjusted. The computation times are compatible with a clinical context attributes.
4
Conclusion
A fast and fully automatic method for the segmentation of the hepatic vessel trees has been presented. It is based on a graph cuts technique constrained by local vessel models in order to take advantage of both approaches: accuracy and robustness of the local modeling and global optimality of the graph cuts technique. We validate our method on synthetic data and then applied it on several CT databases acquired on different contrast medium diffusion phases. The obtained results proved that our approach is robust and fast enough to be used in a clinical context. Moreover, this method allowed us to describe the patient-specific vascularization sur-rounding a hepatocellular carcinoma. Such information is of crucial importance for the definition of accurate and patient-adapted hyperthermia therapy planning.
5
Acknowledgements
This work is part of the French SUTI project supported by an ANR Grant (ANR05RNTS01106).
References
[1] H. B. El-Serag and A. C. Mason, “Rising incidence of hepatocellular carcinoma in the United States,” N Engl J Med, vol. 340, no. 10, pp. 745–50, 1999.
[2] R. A. Lencioni, H. P. Allgaier, D. Cioni, M. Olschewski, P. Deibert, L. Crocetti, H. Frings, J. Laubenberger, I. Zuber, H. E. Blum, and C. Bartolozzi, “Small hepatocellular carcinoma in cirrhosis: randomized comparison of radio-frequency thermal ablation versus percuta-neous ethanol injection,” Radiology, vol. 228, no. 1, pp. 235–40, 2003.
[3] C. Lafon, J. Y. Chapelon, F. Prat, F. Gorry, J. Margonari, Y. Theillere, and D. Cathig-nol, “Design and preliminary results of an ultrasound applicator for interstitial thermal coagulation,” Ultrasound Med Biol, vol. 24, no. 1, pp. 113–22, 1998.
[4] B. Seket, C. Lafon, F. Mithieux, C. Goldenstedt, C. Paquet, J. Y. Chapelon, J. Y. Scoazec, M. Rivoire, and D. Cathignol, “Developing an interstitial ultrasound applicator for thermal ablation in liver: results of animal experiments,” J Surg Res, vol. 142, no. 1, pp. 81–9, 2007. [5] B. van Ginneken, T. Heimann, and M. Styner, “3D segmentation in the clinic: a grand challenge,” in Workshop on 3D Segmentation in the Clinic: - A Grand Challenge - MICCAI
2007, (Brisbane), pp. 7–15, 2007.
[6] S. Esneault, N. Hraich, E. Delabrousse, and J.-L. Dillenseger, “Graph cut liver segmen-tation for interstitial ultrasound therapy,” in 29th Conf Proc IEEE Eng Med Biol Soc, (Lyon), pp. 5247–5250, 2007.
[7] C. Kirbas and F. Quek, “A review of vessel extraction techniques and algorithms,” ACM
Computing Surveys, vol. 36, no. 2, pp. 81–121, 2004.
[8] D. Selle, B. Preim, A. Schenk, and H. Peitigen, “Analysis of vasculature for liver surgical planning,” IEEE Trans Med Imaging, vol. 21, no. 11, pp. 1344–1357, 2002.
[9] L. M. Lorigo, O. D. Faugeras, W. E. L. Grimson, R. Keriven, R. Kikinis, A. Nabavi, and C.-F. Westin, “Curves: Curve evolution for vessel segmentation,” Med Image Anal, vol. 5, pp. 195–206, 2001.
[10] K. Krissian, G. Malandain, N. Ayache, R. Vaillant, and Y. Trousset, “Model based detec-tion of tubular structures in 3D images,” Comp Vis and Im Understanding, vol. 80, no. 2, pp. 130–171, 2000.
[11] P. Reuz´e, J.-L. Coatrieux, L. Luo, and J.-L. Dillenseger, “A 3-D moment based approach for blood vessel detection and quantification in MRA,” Technol Health Care, vol. 1, no. 2, pp. 181–188, 1993.
[12] C. Toumoulin, C. Boldak, J.-L. Dillenseger, J.-L. Coatrieux, and Y. Rolland, “Fast detec-tion and characterizadetec-tion of vessels in very large 3-D data sets using geometrical moments,”
IEEE Trans Biomed Eng, vol. 48, no. 5, pp. 604–606, 2001.
[13] L. Luo, C. Hamitouche, J.-L. Dillenseger, and J.-L. Coatrieux, “A moment-based three-dimensional edge operator,” IEEE Trans Biomed Eng, vol. 47, no. 7, pp. 693–703, 1993. [14] D. M. Greig, B. T. Porteous, and A. H. Seheult, “Exact maximum a posteriori estimation
for binary images,” J R Stat Soc B, vol. 51, no. 2, pp. 271–279, 1989.
[15] Y. Boykov, O. Veksler, and R. Zabih, “Fast approximate energy minimization via graph cuts,” IEEE Trans Pattern Anal Mach Intell, vol. 23, no. 11, pp. 1222–1239, 2001.
[16] Y. Boykov and M.-P. Jolly, “Interactive graph cuts for optimal boundary & region seg-mentation of objects in N-D images,” in 8th Int Conf on Comp Vis ICCV’01, vol. 1, (Vancouver), pp. 105–112, 2001.
[17] Y. Boykov and G. Funka-Lea, “Graph-cuts and efficient N-D image segmentation,” Int J
Comput Vis, vol. 70, no. 2, pp. 109–131, 2006.
[18] L. Ford and D. Fulkerson, “Maximal flow through a network,” Can J Math, vol. 8, pp. 399– 404, 1956.
[19] Y. Boykov and V. Kolmogorov, “An experimental comparison of min-cut/max-flow algo-rithms for energy minimization in vision,” IEEE Trans Pattern Anal Mach Intell, vol. 26, no. 9, pp. 1124–1137, 2004.
[20] G. Yang, A. Bousse, C. Toumoulin, and H. Shu, “A multiscale tracking algorithm for the coronary extraction in MSCT angiography,” in 28th Conf Proc IEEE Eng Med Biol Soc, (New York), pp. 3066–3069, 2006.
[21] D. Hoaglin, F. Mosteller, and J. Tukey, Understanding robust and exploratory data analysis. John Wiley and Sons New York, 1983.
Appendix
Diffusion map of the cylinder information.
Given a cylinder with index i of radius Ri in a centered oriented coordinates system x, y, z with
z the cylinder axis, the local diffusion map DiffMapi is created by the product of two diffusion functions:
DiffMapi(x, y, z) = faxis(x, y, z)∗ fradius(x, y, z) (4)
with:
• faxis, a function promoting the diffusion along the cylinder axis. We choose a Gaussian
with σ set to 2Ri: faxis(x, y, z) = 1 2Ri √ 2πexp −Z2 8R2 i (5)
• fradius a function constraining the diffusion perpendicularly to the cylinder axis.
Perpen-dicular to the axis, the vessel shape is described by the difference of two sigmoid functions (Figure 11). The parameters of this function are Ri the vessel radius and a slope K. If r
is the perpendicular distance from a point p(x, y, z) to the cylinder axis (r =√x2+ y2):
fradius(x, y, z) =
1
1 + exp−K(r+Ri) −
1
1 + exp−K(r−Ri) (6)
The final costs map Cvessel is the result of the mixture of the local maps after translation
and rotation according to the cylinders orientation:
Cvessel =
N
∑
i=1
DiffMapi (7)
with N the number of extracted cylinders.
−5 −4 −3 −2 −1 0 1 2 3 4 5 0 0.2 0.4 0.6 0.8 1
Figure 11: Example of faxis(r) for radius Ri= 3 and a sigmoid slope K = 5. Abscissa index 0