Things versus People: Gender Differences in Vocational Interests and in Occupational Preferences
Texte intégral
Figure
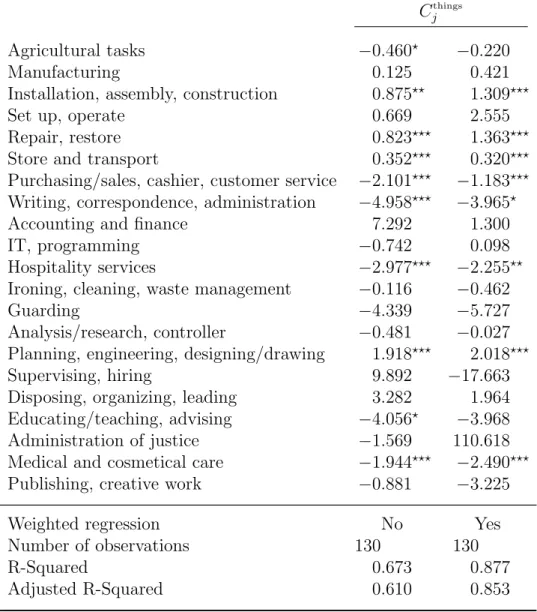
![Table 4: Individual-level regressions, occupational aspirations at the start of 8th grade c things j[i]](https://thumb-eu.123doks.com/thumbv2/123doknet/14300865.494033/30.892.153.761.121.837/table-individual-level-regressions-occupational-aspirations-start-things.webp)
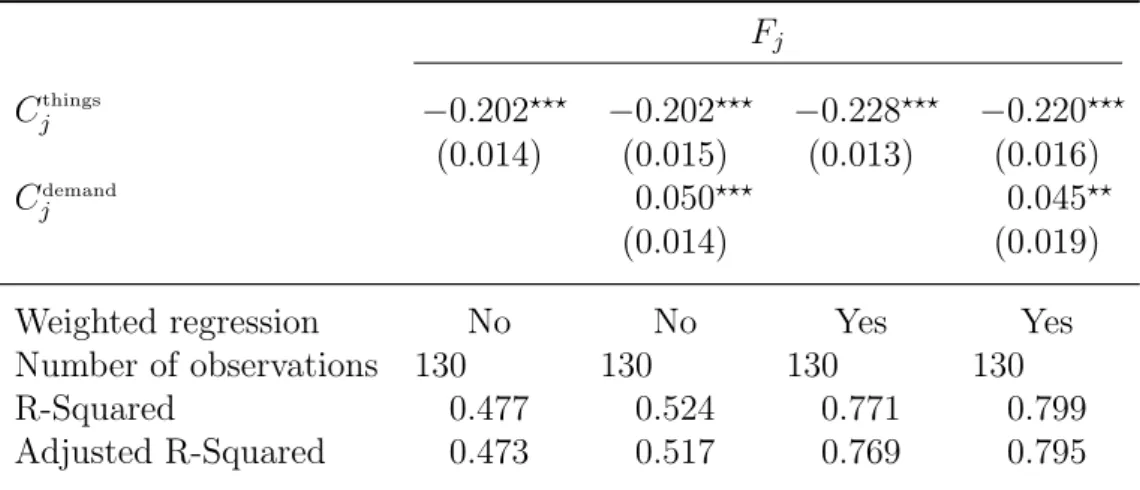
![Table 5: Individual-level regressions, occupational choices at the end of 9th grade c things j[i]](https://thumb-eu.123doks.com/thumbv2/123doknet/14300865.494033/31.892.153.761.121.837/table-individual-level-regressions-occupational-choices-grade-things.webp)

Documents relatifs
In particular, we observe that the improvements are small on AP50 (around 0.5%) but significant on AP75 (around 3%), which means that we obtain more precise detections. As analysed
The reduction in Q max (see table 2), which is proportional to the number of functional transporters present in the plasma membrane (see methods), indicates that the loss
And we believe that today, data journalism is a premier type of such intermediaries, because data journalists combine the expertise of how to access, interpret,
Some of the younger researchers in the field were not even born when Rudolf Wille’s seminal paper “Restructuring lattice theory: an ap- proach based on hierarchies of concepts”
In the present study we tested the hypothesis that sounds (human voice) broadcast to pregnant sows while they experienced positive or negative emotional situations influences
One person stated, “one should act the way they feel no matter what their gender.” (50-74) Another person said, “they should act like they feel and not pretend to be someone
These include the "Fogo Process," the work of Memorial University of Newfoundland's Extension Service, the Communication for Survival Initiative, and the development of
The point where sufficient titrant has been added to be stoichiometrically equivalent to the amount of analyte.. Just enough titrant has been added to react with all of
